

A systematic and meta-analysis review on the diagnostic accuracy of antibodies in the serological diagnosis of COVID-19
- PMID: 34039423
- PMCID: PMC8152206
- DOI: 10.1186/s13643-021-01689-3
A systematic and meta-analysis review on the diagnostic accuracy of antibodies in the serological diagnosis of COVID-19
Abstract
Background: Serological testing based on different antibody types are an alternative method being used to diagnose SARS-CoV-2 and has the potential of having higher diagnostic accuracy compared to the current gold standard rRT-PCR. Therefore, the objective of this review was to evaluate the diagnostic accuracy of IgG and IgM based point-of-care (POC) lateral flow immunoassay (LFIA), chemiluminescence enzyme immunoassay (CLIA), fluorescence enzyme-linked immunoassay (FIA) and ELISA systems that detect SARS-CoV-2 antigens.
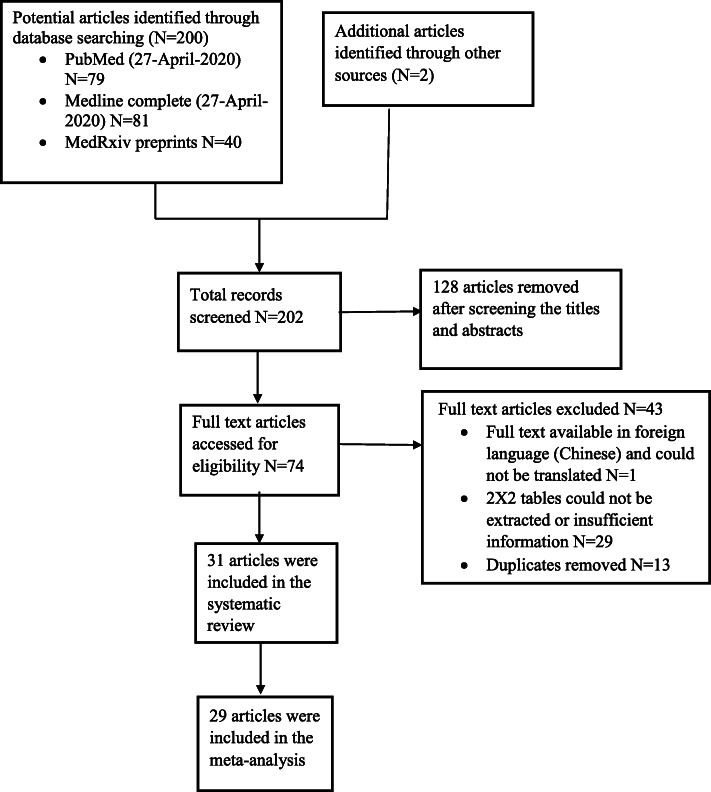
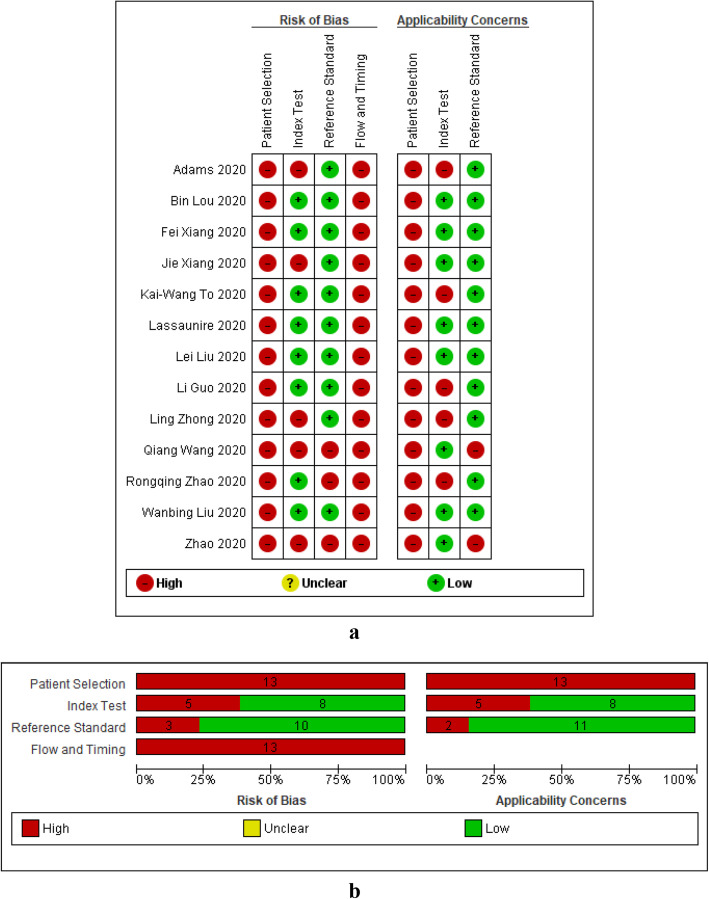
Method: A systematic literature search was carried out in PubMed, Medline complete and MedRxiv. Studies evaluating the diagnostic accuracy of serological assays for SARS-CoV-2 were eligible. Study selection and data-extraction were performed by two authors independently. QUADAS-2 checklist tool was used to assess the quality of the studies. The bivariate model and the hierarchical summary receiver operating characteristic curve model were performed to evaluate the diagnostic accuracy of the serological tests. Subgroup meta-analysis was performed to explore the heterogeneity.
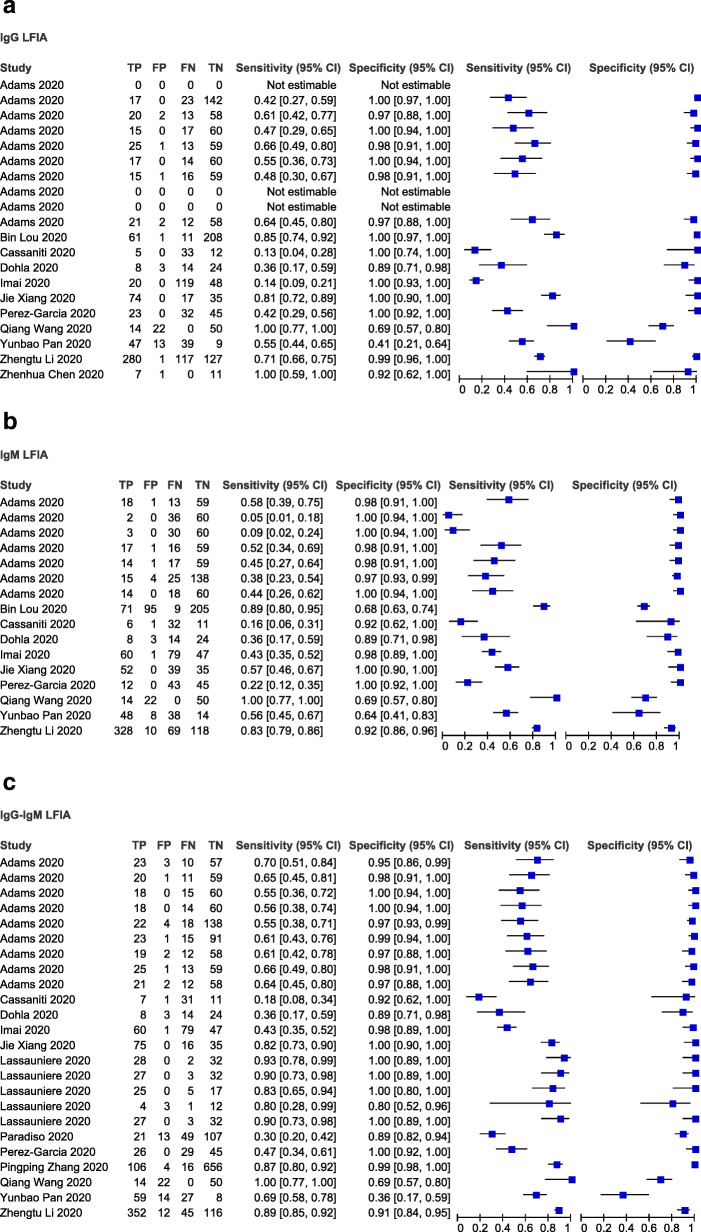
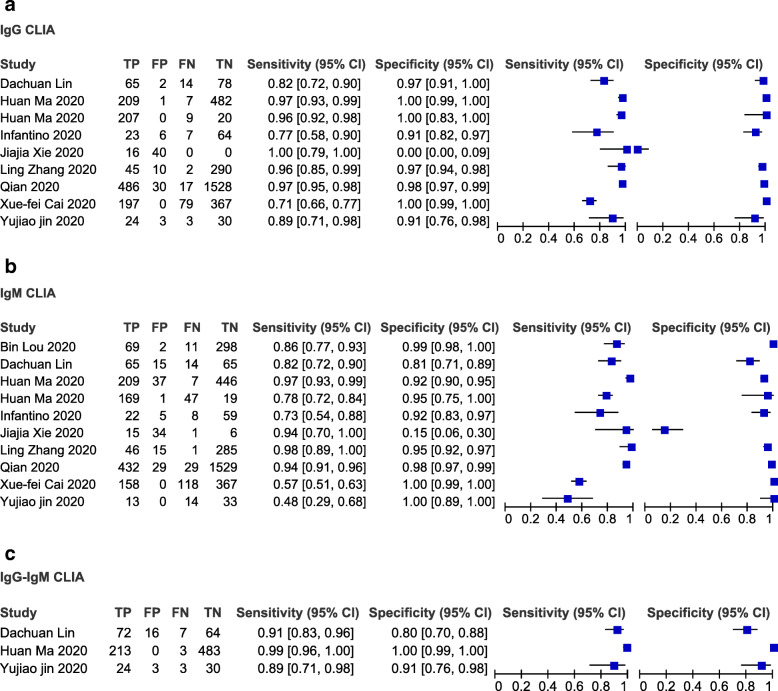
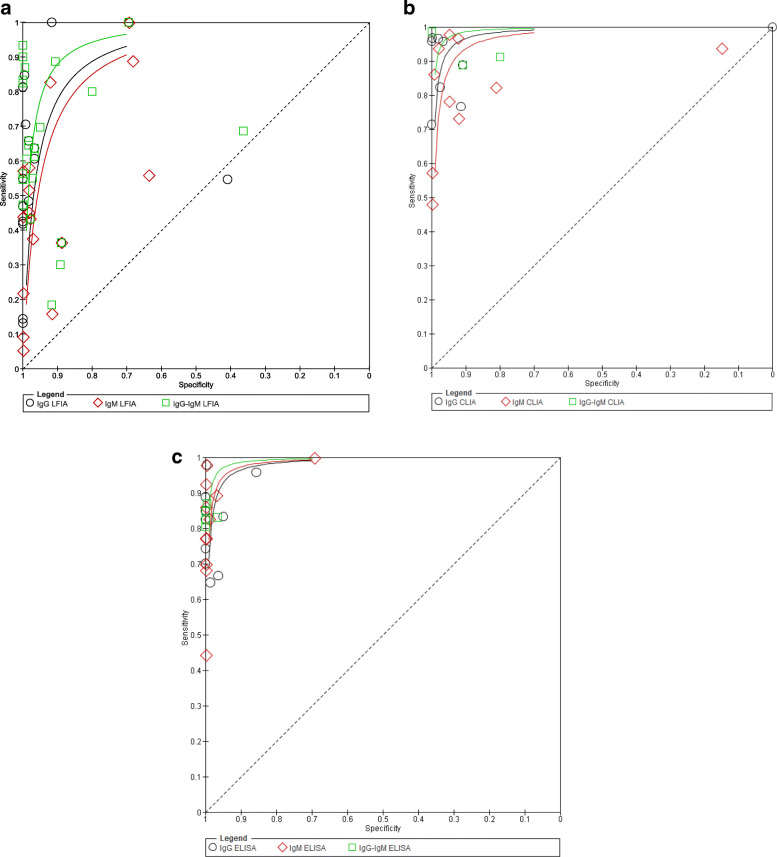
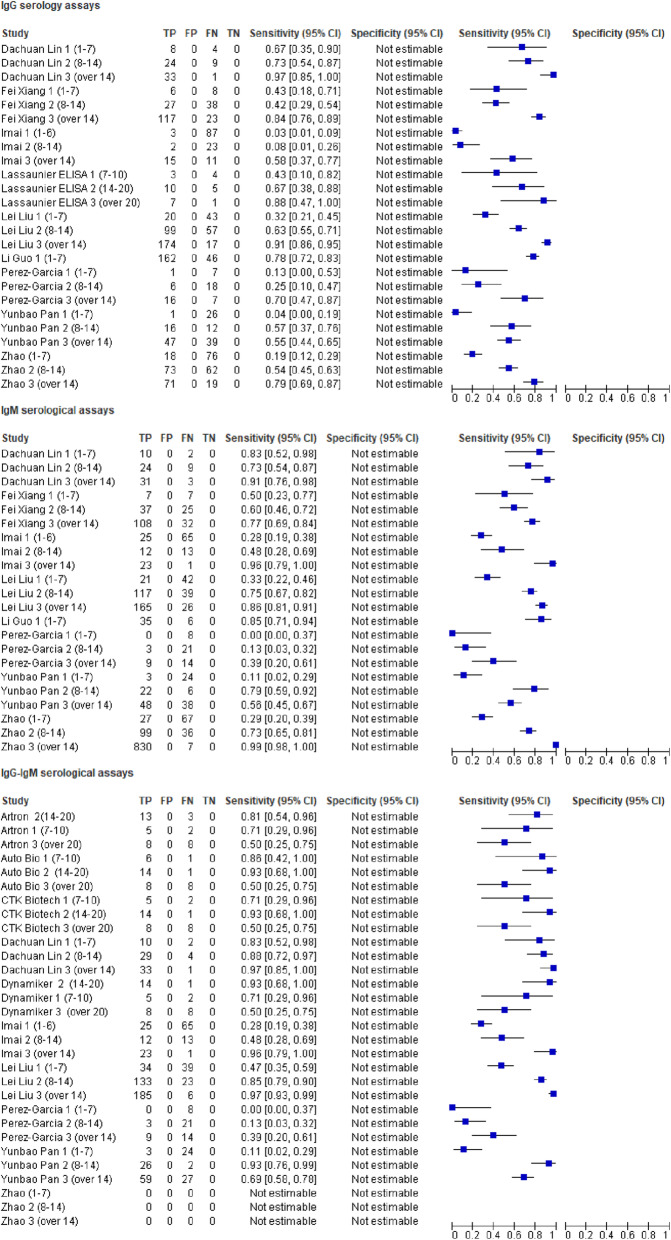
Results: The pooled sensitivity for IgG (n = 17), IgM (n = 16) and IgG-IgM (n = 24) based LFIA tests were 0.5856, 0.4637 and 0.6886, respectively compared to rRT-PCR method. The pooled sensitivity for IgG (n = 9) and IgM (n = 10) based CLIA tests were 0.9311 and 0.8516, respectively compared to rRT-PCR. The pooled sensitivity the IgG (n = 10), IgM (n = 11) and IgG-IgM (n = 5) based ELISA tests were 0.8292, 0.8388 and 0.8531 respectively compared to rRT-PCR. All tests displayed high specificities ranging from 0.9693 to 0.9991. Amongst the evaluated tests, IgG based CLIA expressed the highest sensitivity signifying its accurate detection of the largest proportion of infections identified by rRT-PCR. ELISA and CLIA tests performed better in terms of sensitivity compared to LFIA. IgG based tests performed better compared to IgM except for the ELISA.
Conclusions: We report that IgG-IgM based ELISA tests have the best overall diagnostic test accuracy. Moreover, irrespective of the method, a combined IgG/IgM test seems to be a better choice in terms of sensitivity than measuring either antibody type independently. Given the poor performances of the current LFIA devices, there is a need for more research on the development of highly sensitivity and specific POC LFIA that are adequate for most individual patient applications and attractive for large sero-prevalence studies.
Systematic review registration: PROSPERO CRD42020179112.
Keywords: COVID-19; IgG; IgM; SARS-CoV2; Sensitivity; Serology; Specificity; rRT-PCR.
Conflict of interest statement
The authors declare that they have no competing interests.
Figures


References
-
- Ren L-L, Wang Y-M, Wu Z-Q, Xiang Z-C, Guo L, Xu T, Jiang YZ, Xiong Y, Li YJ, Li XW, Li H, Fan GH, Gu XY, Xiao Y, Gao H, Xu JY, Yang F, Wang XM, Wu C, Chen L, Liu YW, Liu B, Yang J, Wang XR, Dong J, Li L, Huang CL, Zhao JP, Hu Y, Cheng ZS, Liu LL, Qian ZH, Qin C, Jin Q, Cao B, Wang JW. Identification of a novel coronavirus causing severe pneumonia in human. Chin Med J. 2020;133(9):1015–1024. doi: 10.1097/CM9.0000000000000722. - DOI - PMC - PubMed
-
- Situation Summary | CDC. Available from: https://www.cdc.gov/coronavirus/2019-ncov/cases-updates/summary.html. Cited 2020 May 27
-
- NIH clinical trial of investigational vaccine for COVID-19 begins | National Institutes of Health (NIH). Available from: https://www.nih.gov/news-events/news-releases/nih-clinical-trial-investi.... Cited 2020 May 27
-
- COVID-19 situation update worldwide, as of 11 November 2020. Available from: https://www.ecdc.europa.eu/en/geographical-distribution-2019-ncov-cases. Cited 2020 Nov 12
Publication types
MeSH terms
Substances
LinkOut - more resources
Full Text Sources
Other Literature Sources
Medical
Miscellaneous
