. 2021 May 26;7(22):eabg6424.
doi: 10.1126/sciadv.abg6424. Print 2021 May.

Disruption of paternal circadian rhythm affects metabolic health in male offspring via nongerm cell factors

Affiliations

Disruption of paternal circadian rhythm affects metabolic health in male offspring via nongerm cell factors

Maximilian Lassi et al. Sci Adv. .

Abstract

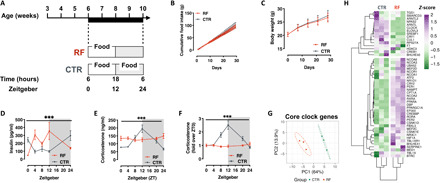
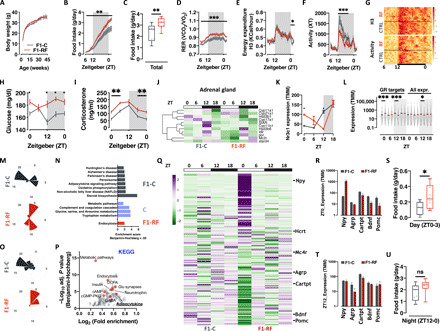
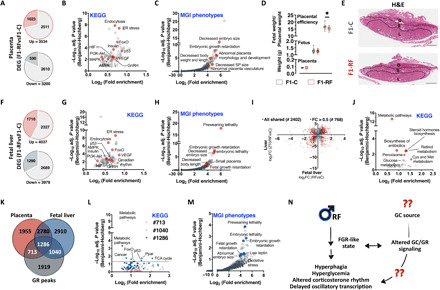
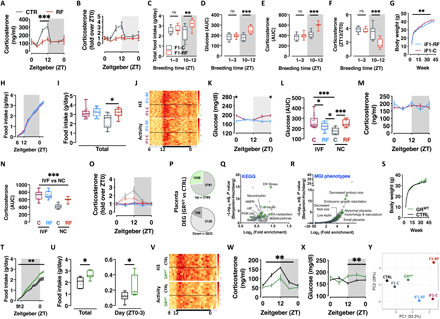
Circadian rhythm synchronizes each body function with the environment and regulates physiology. Disruption of normal circadian rhythm alters organismal physiology and increases disease risk. Recent epidemiological data and studies in model organisms have shown that maternal circadian disruption is important for offspring health and adult phenotypes. Less is known about the role of paternal circadian rhythm for offspring health. Here, we disrupted circadian rhythm in male mice by night-restricted feeding and showed that paternal circadian disruption at conception is important for offspring feeding behavior, metabolic health, and oscillatory transcription. Mechanistically, our data suggest that the effect of paternal circadian disruption is not transferred to the offspring via the germ cells but initiated by corticosterone-based parental communication at conception and programmed during in utero development through a state of fetal growth restriction. These findings indicate paternal circadian health at conception as a newly identified determinant of offspring phenotypes.


Figures

Fig. 1
Fig. 1. Thirty days of night-restricted feeding disrupt circadian rhythm in male mice.
(A) Experimental design of the circadian disruption by night-RF (RF) paradigm. (B and C) Cumulative food intake (B) and body weight trajectory (C) during the 30 days of night-RF (n = 26). (D) Circulating insulin levels after 30 days of night-RF (n = 4 to 6). (E and F) Circulating corticosterone levels (E) and rhythmicity (F) of corticosterone secretion after 30 days of night-RF (n = 4 to 8). (G) PCA representing the variance in the expression of core clock genes in liver at Zeitgeber 0 (ZT0). (H) Heatmap representation of the expression of core clock genes in CTRL and RF livers at ZT0. [***P < 0.001 (two-way ANOVA mixed effect model, time × experimental group.]
Fig. 2
Fig. 2. Paternal circadian disruption reprograms offspring feeding behavior, metabolic health, and oscillatory transcription in liver and hypothalamus.
(A) Body weight trajectories. (B and C) Single animal cumulative food intake (B) and quantification of daily food intake (C). (D to G) Single animal respiratory exchange ratio (RER) (D), energy expenditure (E), locomotor activity (F), and their heatmap representation (G). (H and I) Daily oscillations in circulating glucose (H) and corticosterone (I) levels. (J) Heatmap of the expression of genes involved in adrenal corticosterone biosynthesis. (K) Liver RNA-seq–based Nr3c1 expression. (L) Liver RNA-seq analysis of GR target genes from publicly available GR Chip-seq datasets. (All expr., all expressed genes in the dataset.) (M to P) JTK_CYCLE analysis of liver (M) and (N) and hypothalamus (O) and (P) RNA-seq data (M) and (O). Radar plot presenting the circadian gene expression in liver (M) and hypothalamus (O). (N) KEGG pathway analysis of oscillating genes in liver from F1-C (gray bars), F1-RF (red bar), or both (blue bars) F1 groups. (P) KEGG pathway analysis of genes differentially expressed in the hypothalamus of F1 male mice at ZT0. (Q) Heatmap visualization of RNA-seq–based expression of neuropeptides in F1-C and F1-RF mice. (R to T) RNA-seq–based expression of selected differentially expressed neuropeptides in the hypothalamus at ZT0 (R) and ZT12 (T) (n = 3 biological replicates). (U) Quantification of average daily food intake around ZT0 (S) and during the night phase (U). Data from F1 male mice (n = 10 to 12 or n = 3 biological replicates/ZT for RNA-seq experiments). *P < 0.05, **P < 0.01, ***P < 0.001; two-way ANOVA mixed effect model, time × experimental group or two-tailed t test. ns, not significant; GABA, γ-aminobutyric acid; DCPA, Dopamine or Dihidroxphenylalanine; ccMP-PKG, cyclic-GMP (Guanine Mono Phosphate)-Protein Kinase G.
Fig. 3
Fig. 3. Paternal circadian disruption reprograms placenta and fetal liver transcriptomes.
(A to C) Cake plot visualization of DEGs in placenta from F1-C and F1-RF male mice (A) (n = 4 biological replicates per group isolated between ZT2 and ZT4) and their functional annotation using KEGG pathway analysis (B) or the MGI phenotype database (C). D, Decidua; S, Spongiotrophoblast; L, Labyrinth. (D) Quantification of F1 placenta and fetal weight and placental efficiency at E18.5. (E) Representative placenta H&E staining (representative images of n = 4 placenta per group). (F to H) Cake plot visualization of DEGs in fetal livers from F1-C and F1-RF male mice (F) (n = 4 biological replicates per group) and their functional annotation using KEGG pathway analysis (G) or the MGI phenotype database (H). (I and J) Co-DEGs in fetal and adult liver (ZT0) (I) (red dots indicate genes with absolute log2FC > 0.5) and their functional annotation using KEGG pathway analysis (J). FC, fold change. (K to M) Venn diagram visualization of the fraction of reported GR target genes differentially expressed in the placenta and/or the fetal liver of F1-RF versus F1-C male mice (K) and their functional annotation using KEGG pathway analysis (L) or the MGI phenotype database (M). (N) Schematic summary of our findings reporting paternal circadian disruption associated to a signature of FGR.
Fig. 4
Fig. 4. Corticosterone signaling at conception is important for the effects of paternal circadian disruption on offspring phenotype.
(A and B) Corticosterone levels (A) and rhythmicity (B) in F0 mice seminal plasma (n = 8). (C to F) Total food intake (C), blood glucose (D), plasma corticosterone (E), and corticosterone surge at ZT12 (F) in F1-C and F1-RF males sired by parents mated at the beginning of the day (ZT1 to ZT3) or at the day-night transition (ZT10 to ZT12) (G) Body weight trajectories. (H and I) Single animal cumulative food intake (H) and quantification of daily total food intake compared to F1 male mice generated via natural conception (I). (J) Heatmap representation of single animals’ daily energy expenditure and locomotor activity. (K and L) Daily oscillations in circulating glucose levels (K) and comparison to F1 male mice generated via natural conception (L). (M to O) Daily oscillations in circulating corticosterone levels (M and O) compared to F1 male mice generated via natural conception (N). (P to R) Cake plot of DEGs in placenta (P) and their functional annotation using KEGG (Q) or the MGI phenotype database (R). (S) Body weight trajectories. (T and U) Single animal cumulative food intake and quantification of daily total food intake and food intake at the night-day transition (ZT0 to ZT3) (U). (V) Heatmap representation of single animals’ daily energy expenditure and locomotor activity. Data from IVF-generated F1 male mice (G to O) or GRWT (offspring of GRhet mothers) and CTRL male mice (P to X) (n = 10 two-way ANOVA mixed effect model, time × experimental group or two-tailed t test; n = 3 biological replicates for RNA-seq experiments). (W and X) Daily oscillations in circulating corticosterone (W) and glucose (X) levels. (Y) PCA-based visualization of the phenotypic distance between F1 male mice from GRhet mothers (GRWT), RF fathers (F1-RF and iF1-RF generated via natural conception or IVF, respectively), and their respective controls (CTRL, F1-C, and iF1-C). AUC, area under the curve; NC, natural conception.

Comment in

References

    1. Pittendrigh C. S., Temporal organization: Reflections of a Darwinian clock-watcher. Annu. Rev. Physiol. 55, 17–54 (1993). - PubMed
    1. Dibner C., Schibler U., Albrecht U., The mammalian circadian timing system: Organization and coordination of central and peripheral clocks. Annu. Rev. Physiol. 72, 517–549 (2010). - PubMed
    1. Golombek D. A., Rosenstein R. E., Physiology of circadian entrainment. Physiol. Rev. 90, 1063–1102 (2010). - PubMed
    1. Yoo S.-H., Yamazaki S., Lowrey P. L., Shimomura K., Ko C. H., Buhr E. D., Siepka S. M., Hong H.-K., Oh W. J., Yoo O. J., Menaker M., Takahashi J. S., PERIOD2::LUCIFERASE real-time reporting of circadian dynamics reveals persistent circadian oscillations in mouse peripheral tissues. Proc. Natl. Acad. Sci. U.S.A. 101, 5339–5346 (2004). - PMC - PubMed
    1. Takahashi J. S., Transcriptional architecture of the mammalian circadian clock. Nat. Rev. Genet. 18, 164–179 (2017). - PMC - PubMed

Publication types

LinkOut - more resources