. 2021 May 26;7(22):eabg8384.
doi: 10.1126/sciadv.abg8384. Print 2021 May.

Shared transcriptional profiles of atypical B cells suggest common drivers of expansion and function in malaria, HIV, and autoimmunity

Affiliations

Shared transcriptional profiles of atypical B cells suggest common drivers of expansion and function in malaria, HIV, and autoimmunity

Prasida Holla et al. Sci Adv. .

Abstract

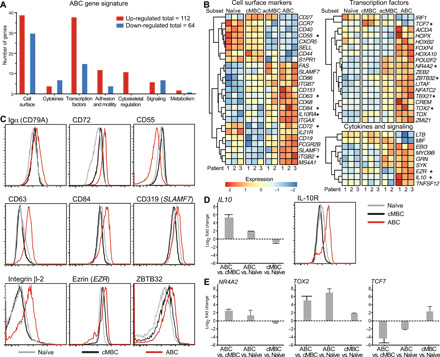
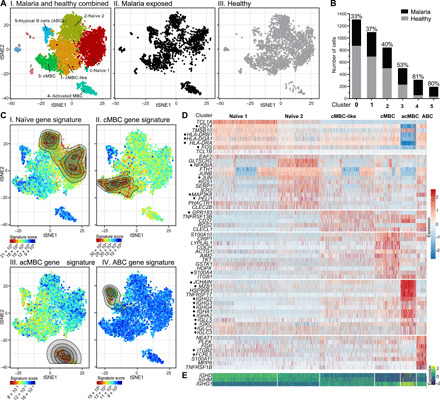
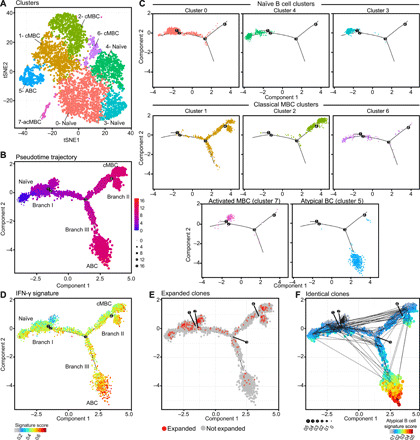
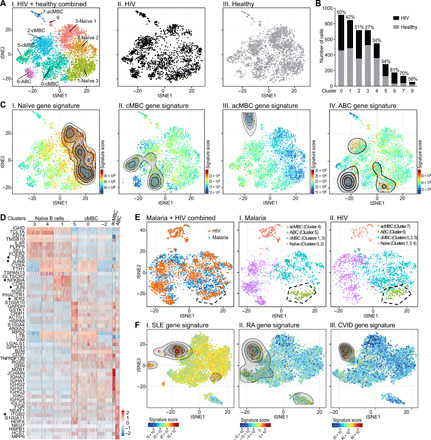
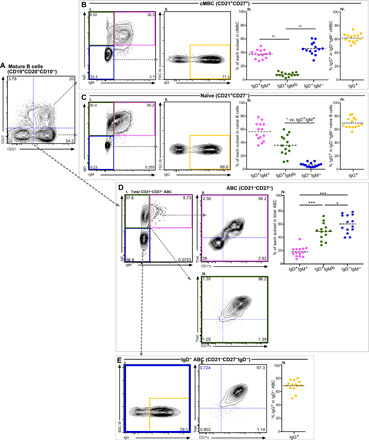
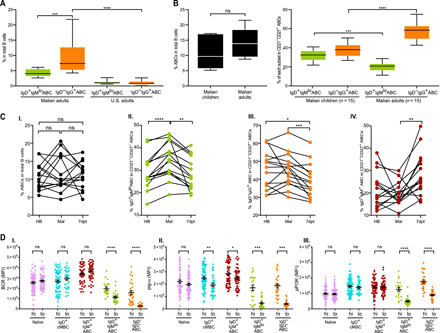
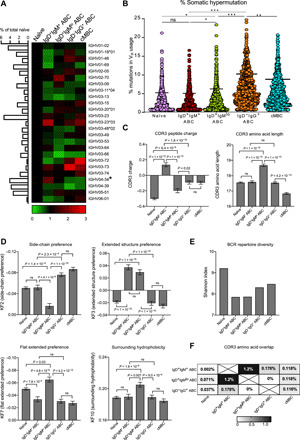
Chronic infectious diseases have a substantial impact on the human B cell compartment including a notable expansion of B cells here termed atypical B cells (ABCs). Using unbiased single-cell RNA sequencing (scRNA-seq), we uncovered and characterized heterogeneities in naïve B cell, classical memory B cells, and ABC subsets. We showed remarkably similar transcriptional profiles for ABC clusters in malaria, HIV, and autoimmune diseases and demonstrated that interferon-γ drove the expansion of ABCs in malaria. These observations suggest that ABCs represent a separate B cell lineage with a common inducer that further diversifies and acquires disease-specific characteristics and functions. In malaria, we identified ABC subsets based on isotype expression that differed in expansion in African children and in B cell receptor repertoire characteristics. Of particular interest, IgD+IgMlo and IgD-IgG+ ABCs acquired a high antigen affinity threshold for activation, suggesting that ABCs may limit autoimmune responses to low-affinity self-antigens in chronic malaria.


Figures

Fig. 1
Fig. 1. Atypical B cells express a distinct transcription signature including genes encoding cell surface markers, TFs, and signaling molecules.
(A) Distribution of up-regulated and down-regulated DEGs in sorted atypical B cells (ABC gene signature) compared to sorted naïve, classical MBCs (cMBCs), and activated MBC subsets (acMBCs) by category. (B) The DEGs in the ABC gene signature are shown in heatmaps comparing genes encoding cell surface markers, TFs, cytokines, and components of signaling pathways. Each column represents one donor of three (subject IDs: 730, 731, and 736; table S1). Donor 3 had fewer than 500 acMBCs, resulting in a low gene count, and was removed from the acMBC analysis. Genes that were previously shown to be associated with ABCs or were validated in this study are indicated by arrows. Color scale indicates relative gene expression in each subset compared to the other three subsets. (C) The expression levels of the indicated gene products quantified by flow cytometry by either cell surface or intracellular staining of naïve B cells (gray), cMBCs (black), and ABCs (red) from one Malian adult donor (subject ID: 704; table S1). (D) Left: Relative expression level of IL-10 mRNA assessed in naïve B cells, cMBCs, and ABCs from three Malian donors (subject IDs: 581, 583, and 700; table S1) by quantitative reverse transcription polymerase chain reaction (qRT-PCR) and depicted as log2 fold changes for the indicated comparisons. Right: Representative histogram of surface expression of IL-10R in the indicated B cell subsets from one Malian donor (subject ID: 706; table S1). (E) Relative expression levels of NR4A2, TOX2, and TCF7 mRNA was assessed in naïve B cells, cMBCs, and ABCs from three Malian donors by qRT-PCR (subject IDs: 581, 583, and 700; table S1).
Fig. 2
Fig. 2. scRNA-seq analysis of B cell from malaria-exposed donors reveals heterogeneity in B cell subsets.
(A) scRNA-seq data from peripheral blood B cells from three malaria-exposed Malian adults (subject IDs: 729, 732, and 745; table S1) and three healthy U.S. adults (subject IDs: US_1, US_2, and US_3; table S1) were integrated with batch correction for a total of 4453 cells (shown as individual dots) and displayed by tSNE. (I) Combined data from Malian and U.S. donors. Data from (I) separated into Malian donors (II) (1968 cells) and U.S. donors (III) (2485 cells). (B) Total number of cells per cluster and the percentage of cells in each cluster from Malian versus U.S. donors for clusters 0 to 5. (C) tSNE plots of 4290 cells combined from Malian and U.S. donors after removing 163 cells in clusters 6, 7, and 8 onto which the following gene signatures were mapped and shown as contour maps, reflecting the region of cells with signature scores above the mean: (I) Naïve B cell. (II) cMBC. (III) acMBC. (IV) ABC. Color scale reflects the expression score of each signature, with red and blue depicting the highest and lowest signature scores, respectively. (D) Heatmap showing the expression of the top DEGs in each cluster identified in (C). Genes cited in the results section text are indicated by asterisks. (E) Expression levels of IGHD, IGHM, and IGHG1 are shown for each of the clusters in (D). Color scales indicate average gene expression per cell.
Fig. 3
Fig. 3. Trajectory analysis of scRNA-seq data for B cells from malaria-exposed Malian adults.
(A) scRNA-seq data from peripheral blood B cells of one Malian adult (subject ID: 303; table S1) showing 6143 cells as individual dots. Data are displayed by tSNE with each cluster colored differently and labeled on the basis of gene signatures displayed in fig. S5A. (B) Trajectory analysis of cells shown in (A) using the naïve B cell gene signature (table 2) as the root of the trajectory. Color indicates pseudotime from 0 to 16, and dot size indicate pseudotime from 0 to 16. Three branches (I, II, and III) are described in the text. (C) Distribution of cells in each cluster is shown along the trajectory path. Top: Naïve B cell clusters 0, 4, and 3. Middle: Classical MBC clusters 1, 2, and 6. Bottom: Activated MBC cluster 7 and ABC cluster 5. (D) Cells are colored on the basis of the IFN-γ signature score used in fig. S4A. (E) BCR clones that were expanded are shown in red along the trajectory path. Clones that are unique or not expanded are in gray. (F) Identical clones are traced in black lines along the trajectory path. Cells are colored on the basis of the ABC signature. Color bar and dot size indicate the signature score of the ABC gene signature.
Fig. 4
Fig. 4. B cells from HIV-infected individuals are heterogeneous and have transcriptionally similar ABCs to malaria-exposed donors.
(A) (I) scRNA-seq data from three HIV-infected individuals (subject IDs in table S1) and three healthy U.S. donors (subject IDs in table S1) were integrated for a total of 4506 cells displayed by tSNE. Data from (I) separated into HIV-infected (II) (2021 cells) and healthy U.S. donors (III) (2485 cells). (B) Total number and percentage of cells per cluster from HIV-infected versus healthy U.S. donors. (C) tSNE plot from (A) onto which gene signatures from bulk RNA-seq of sorted B cells from HIV-infected donors were mapped and shown as contour maps of regions with signature scores above the mean: (I) Naïve B cell. (II) cMBC. (III) acMBC. (IV) ABC. Red and blue depict the highest and lowest gene expression signature scores, respectively. (D) Heatmap showing the top DEGs in each cluster in (C). Genes cited in Results are indicated by arrows. Color scale depicts average gene expression per cell. (E) tSNE plot showing integrated data from HIV-infected donors in blue and Malian donors in orange with the ABC cluster (identified in fig. S5) gated. (I) HIV-infected donors. (II) Malaria-exposed donors. Cells are colored on the basis of the gene signature to which they mapped. Numbers in brackets refer to cluster number in the malaria data (Fig. 2C) or HIV data (Fig. 3C). (F) Gene signatures of ABCs from SLE (I), rheumatoid arthritis (RA) (II), or common variable immunodeficiency (CVID) (III) were mapped onto the malaria scRNA-seq data from Fig. 2A.
Fig. 5
Fig. 5. Heterogeneity in ABCs defined by Ig isotype expression.
(A) Flow cytometry analysis of B cells purified from peripheral blood of 14 Malian children gated as CD19+CD20+CD10cells (subject IDs indicated in table S1). A representative contour plots for one child (subject ID: 523; table S1) are shown. B cell subsets were further gated on the basis of CD21 and CD27 expression as naïve B cells (CD21+CD27), classical MBCs (cMBCs) (CD21+CD27+), and atypical B cells (ABCs) (CD21CD27). (B) (I) cMBCs were stained with antibodies specific for cell surface IgD, IgM, and IgG. (II) IgDIgM cells from (I) were assessed for IgG expression. (III) Percentages of IgD+IgM+, IgD+IgMlo, and IgDIgM cells within the cMBCs. (IV) Percentage of IgDIgG+ cMBCs in IgDIgM cMBCs. (C) (I to IV) Naïve B cells were stained and analyzed as in (B). (D) (I) Total CD21CD27 ABCs were assessed for IgD and IgM expression. IgD+IgM+ ABCs (II) and IgD+IgMlo ABCs (III) were assessed for expression levels of Tbet and CD11c. (IV) Percent of IgD+IgM+, IgD+IgMlo, and IgDIgM subsets in total CD21CD27 ABCs. (E) (I) Expression of IgG in IgDIgM ABCs. (II) Expression levels of Tbet and CD11c in IgDIgG+ ABCs. (III) Percent of IgG+ cells in IgD ABCs (*P < 0.005, **P < 0.001, and ***P < 0.0001). Comparisons of population percentages in (B) to (E) were tested for statistical significance by one-way analysis of variance (ANOVA) with Brown-Forsythe test. FSC-W, forward scatter-width; SSC-W, side scatter-width.
Fig. 6
Fig. 6. IgD+IgMlo ABCs are expanded in children upon acute febrile malaria and have high antigen affinity thresholds for activation.
(A) Percentages of IgD+IgMlo atypical B cell (ABC) (green) and IgDIgG+ ABC (orange) in total B cells of 12 Malian adult donors (subject IDs indicated in table S1) and U.S. donors (subject IDs indicated in table S1). (B) Left: Percent of CD21CD27 ABCs of total B cells in 15 Malian children (subject IDs indicated in table S1) and the 12 Malian adults in (A). Right: Percent of IgD+IgMlo (green) and IgDIgG+ ABCs (orange) in the same 15 Malian children and 12 Malian adults. (C) (I) The percent of ABC at healthy baseline (HB), upon the onset of febrile malaria (Mal), and 7 days after antimalarial treatment (7 dpt) for the Malian children in (B). Each dot represents one child. Percent of IgD+IgMlo ABCs (II), IgDIgG+ ABCs (III), and IgD+IgM+ ABCs (IV) of total ABC B cells at HB, Mal, and 7 dpt. (D) Recruitment of BCR (I), phosphorylated Igα (pIgα) (II), and phosphorylated PI3K (pPI3K) (III) to the immune synapse of B cells stimulated with either high- or low-affinity membrane-bound anti-κ. Each dot represents a single cell, and colors represent different B cell subsets (indicated on the x axis). (*P < 0.01, **P < 0.005, ***P < 0.001, and ****P < 0.0001; ns, not significant). Comparisons were tested for statistical significance by either one-way ANOVA with Kruskall-Wallis test in (A) and (B), Tukey’s range test in (C), or unpaired t test for each pair consisting of high (hi)– and low (lo)–affinity antigens (D).
Fig. 7
Fig. 7. Analysis of Ig repertoire features in B cell subsets from Malian children.
(A) VH usage between naïve, IgD+IgM+ atypical B cells (ABC), IgD+IgMlo ABC, switched IgDIgG+ ABC, and classical MBC (cMBC) are shown in a heatmap depicting fold change differences in frequency relative to naïve B cells. Frequencies of VH sequences comprising the naïve B cell compartment are given on the left. An asterisk denotes the VH genes referred to in the text. Data are from three Malian children (subject IDs: 554, 562, and 566; table S1) (B) A comparison of somatic hypermutation in VH between naïve, IgD+IgM+ ABC, IgD+IgMlo ABC, switched IgDIgG+ ABC, and cMBC analyzed by one-way ANOVA with Kruskall-Wallis test. (C) Heavy-chain CDR3 features of charge and amino acid length analyzed by one-way ANOVA with Kruskall-Wallis test. (D) Representative Kidera factor (KF) analysis of CDR3 from indicated B cell subsets, including KF2 (side-chain preference), KF3 (extended structure preference), KF7 (flat extended preference), and KF10 (surrounding hydrophobicity). (E) Comparison of Shannon index of diversity calculated from total CDR3 amino acid sequences. (F) The percentage of heavy-chain CDR3 peptide sequences shared of IgD+IgM+ ABC, IgD+IgMlo ABC, and IgDIgG+ ABC subsets. (*P < 0.05, **P < 0.01, and ***P < 0.0001).

Similar articles

Cited by

References

    1. Amanna I. J., Carlson N. E., Slifka M. K., Duration of humoral immunity to common viral and vaccine antigens. N. Engl. J. Med. 357, 1903–1915 (2007). - PubMed
    1. Portugal S., Obeng-Adjei N., Moir S., Crompton P. D., Pierce S. K., Atypical memory B cells in human chronic infectious diseases: An interim report. Cell. Immunol. 321, 18–25 (2017). - PMC - PubMed
    1. Pupovac A., Good-Jacobson K. L., An antigen to remember: Regulation of B cell memory in health and disease. Curr. Opin. Immunol. 45, 89–96 (2017). - PMC - PubMed
    1. World Health Organization, World malaria report 2018 (World Health Organization, 2018).
    1. Cohen S., Mc G. I., Carrington S., Gamma-globulin and acquired immunity to human malaria. Nature 192, 733–737 (1961). - PubMed

Publication types