. 2021 Jun 15;206(12):2803-2818.
doi: 10.4049/jimmunol.2001039. Epub 2021 May 26.

Context-Dependent miR-21 Regulation of TLR7-Mediated Autoimmune and Foreign Antigen-Driven Antibody-Forming Cell and Germinal Center Responses

Affiliations

Context-Dependent miR-21 Regulation of TLR7-Mediated Autoimmune and Foreign Antigen-Driven Antibody-Forming Cell and Germinal Center Responses

Stephanie L Schell et al. J Immunol. .

Abstract

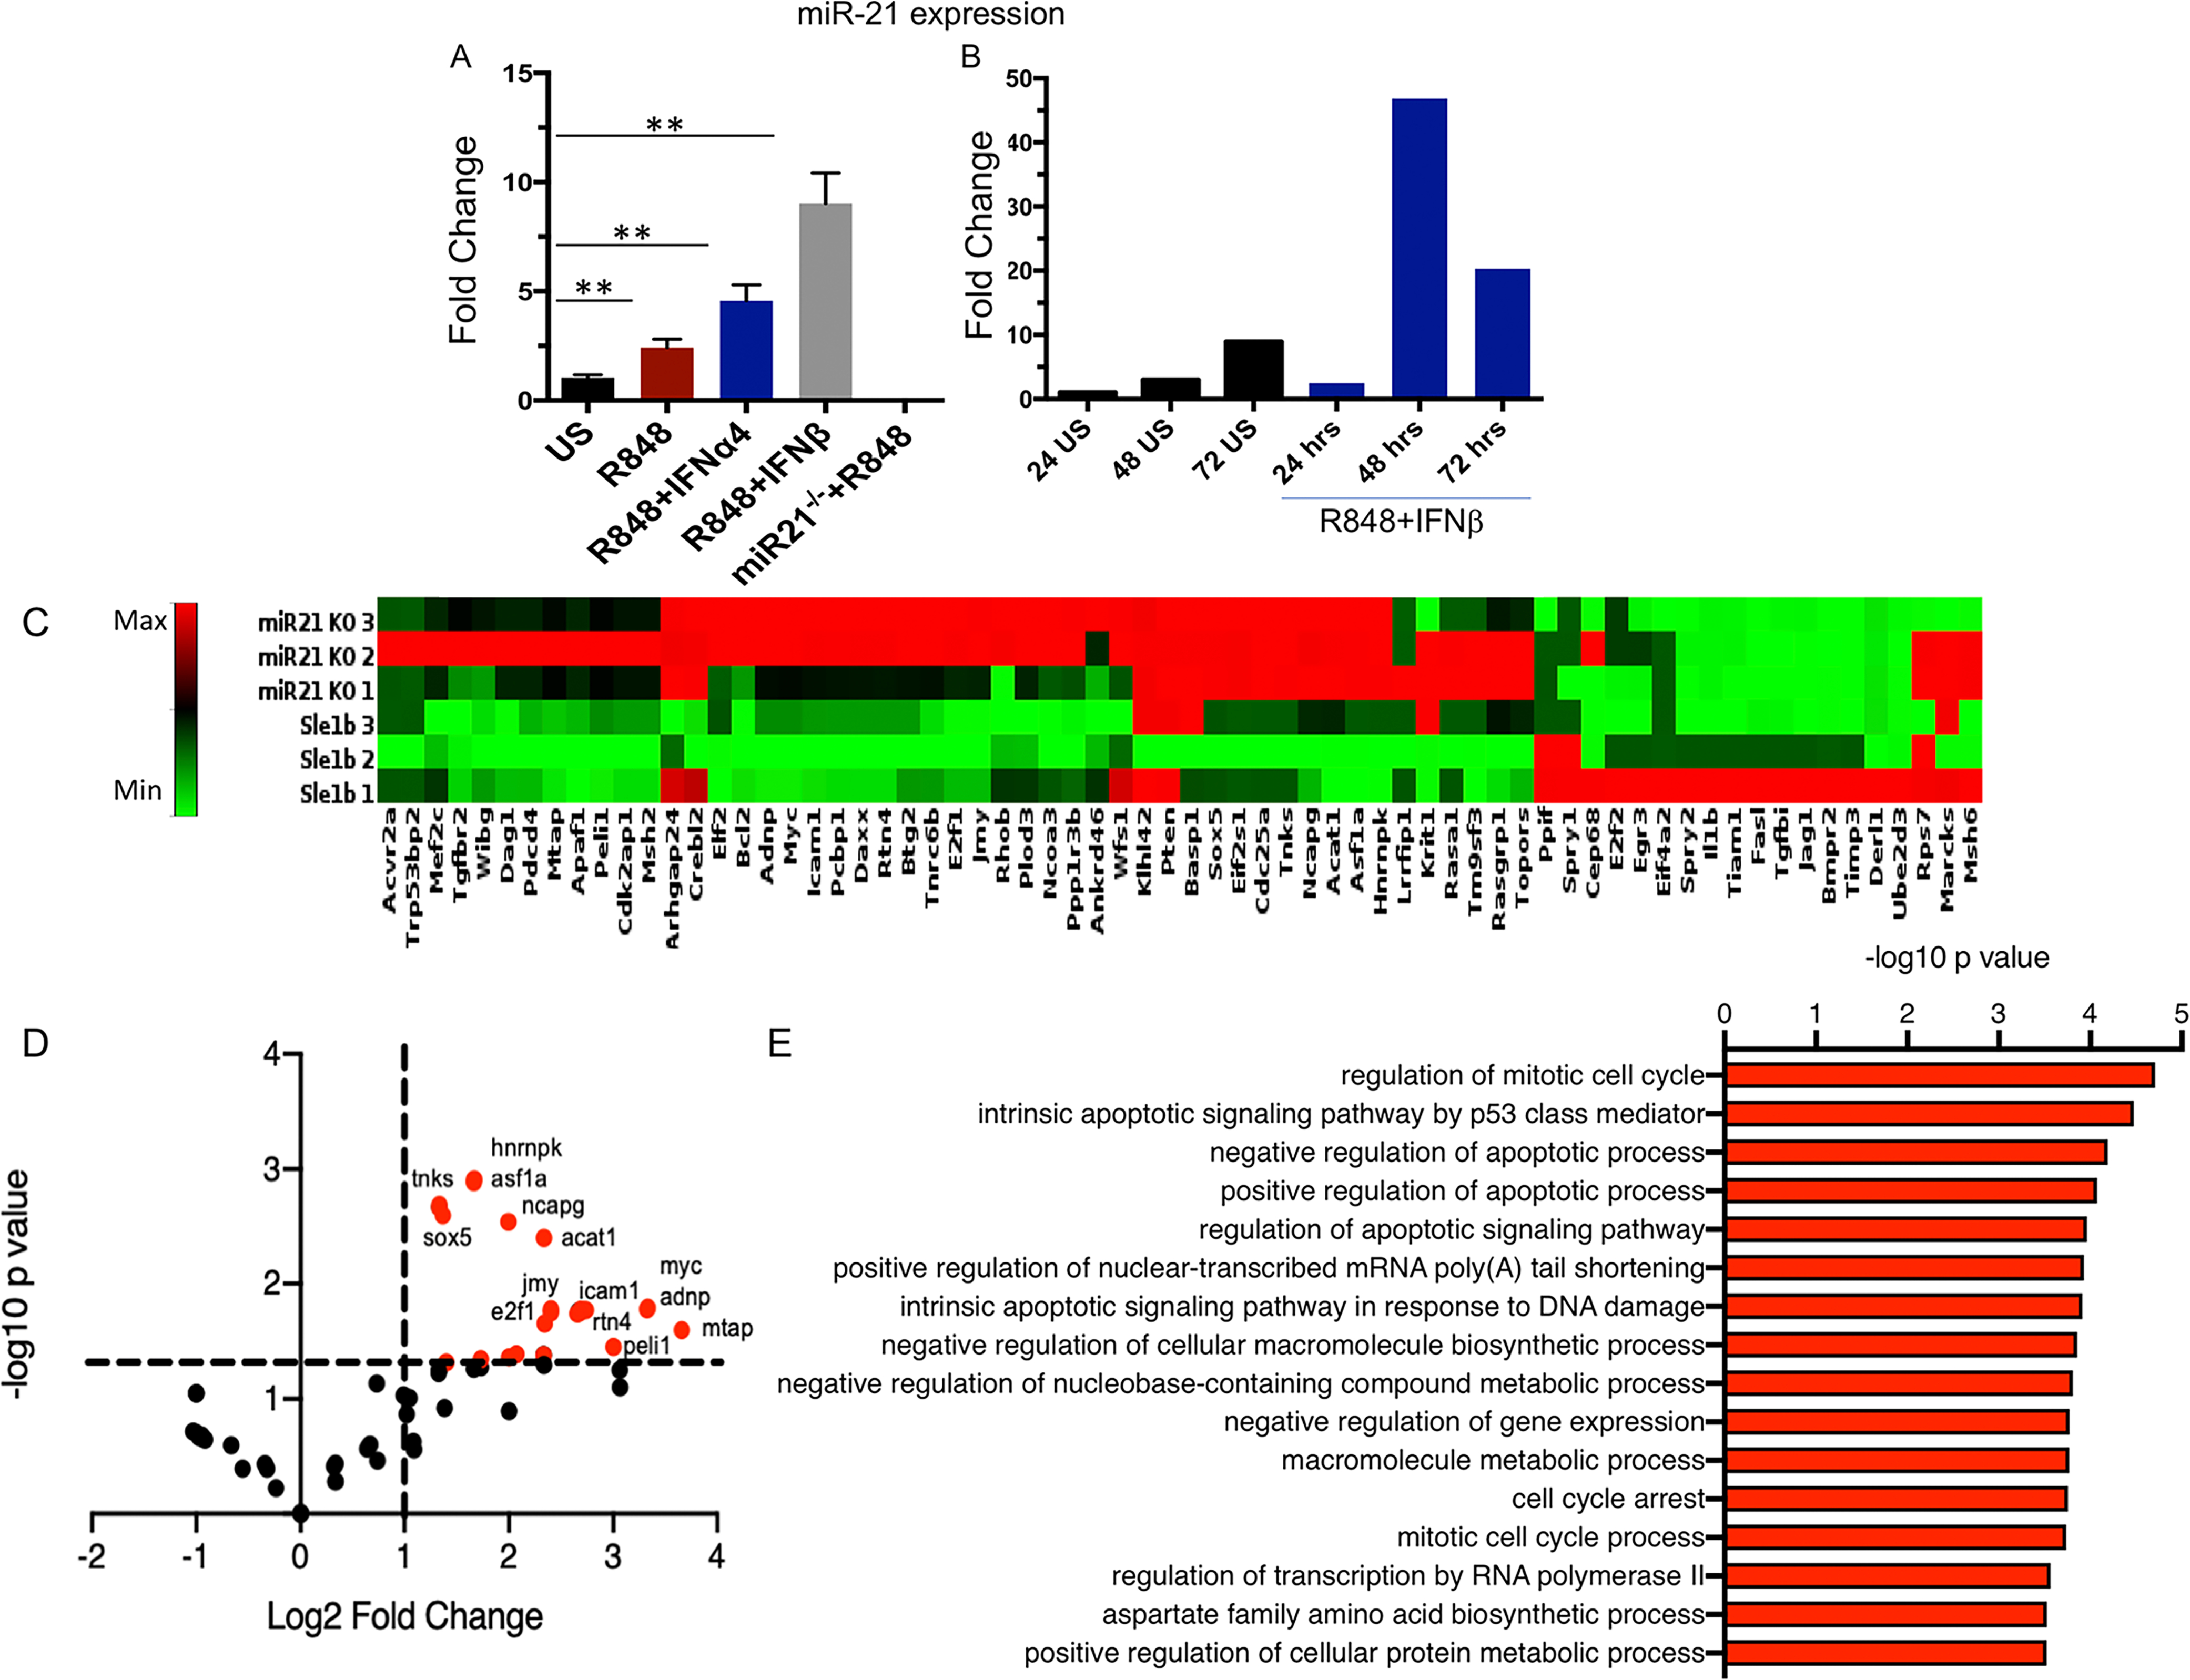
MicroRNAs (miRNAs) are involved in healthy B cell responses and the loss of tolerance in systemic lupus erythematosus (SLE), although the role of many miRNAs remains poorly understood. Dampening miR-21 activity was previously shown to reduce splenomegaly and blood urea nitrogen levels in SLE-prone mice, but the detailed cellular responses and mechanism of action remains unexplored. In this study, using the TLR7 agonist, imiquimod-induced SLE model, we observed that loss of miR-21 in Sle1b mice prevented the formation of plasma cells and autoantibody-producing Ab-forming cells (AFCs) without a significant effect on the magnitude of the germinal center (GC) response. We further observed reduced dendritic cell and monocyte numbers in the spleens of miR-21-deficient Sle1b mice that were associated with reduced IFN, proinflammatory cytokines, and effector CD4+ T cell responses. RNA sequencing analysis on B cells from miR-21-deficient Sle1b mice revealed reduced activation and response to IFN, and cytokine and target array analysis revealed modulation of numerous miR-21 target genes in response to TLR7 activation and type I IFN stimulation. Our findings in the B6.Sle1bYaa (Sle1b Yaa) spontaneous model recapitulated the miR-21 role in TLR7-induced responses with an additional role in autoimmune GC and T follicular helper responses. Finally, immunization with T-dependent Ag revealed a role for miR-21 in foreign Ag-driven GC and Ab, but not AFC, responses. Our data suggest a potential multifaceted, context-dependent role for miR-21 in autoimmune and foreign Ag-driven AFC and GC responses. Further study is warranted to delineate the cell-intrinsic requirements and mechanisms of miR-21 during infection and SLE development.


Figures

Figure 1.
Figure 1.. IMQ Treatment Drives miR-21 Expression and miR-21-Dependent Splenomegaly and Innate Cell Numbers in Autoimmune-Prone Sle1b Mice.
All data are from Sle1b and Sle1b.miR-21KO mice following 8–12 weeks of IMQ treatment. Data are from 2 independent experiments, each with 5–8 mice per group. Each data point represents one mouse. Blue circles are Sle1b IMQ and red circles are Sle1b.miR-21KO IMQ. (A) Schematic illustrating the IMQ treatment model whereby mice are treated epicutaneously on the ear surface with a cream containing 5% IMQ. (B) Images depicting a lack of visible inflammation on the ear surface of autoimmune-prone mice treated with IMQ. (C) qPCR for miR-21 expression in the spleens of B6 (clear), B6 IMQ (gray), Sle1b (green), and Sle1b IMQ (blue) mice. Bars represent the SD of data. (D) Images of spleen size in the indicated strains. (E) Weight of spleens derived from the indicated mice. (F) Quantification of the number of total splenocytes. (G-H) Quantification of the (G) percentage and (H) number of B cells within total splenocytes. (I-J) Quantification of the (I) percentage and (J) number of CD4 T cells within total splenocytes. (K-N) Quantification of the total number of (K) innate cells, (L) moDCs, (M) cDCs and (N) monocytes in the spleen. Except for (C), Bars on graphs represent the mean of the data points. Except for (C), two group comparison was performed by Mann-Whitney analysis. For (C), multiple group comparison was performed by one-way ANOVA with multiple comparisons analysis, Tukey test. *p < 0.05, **p < 0.01, ***p < 0.001, and ****p < 0.0001.
Figure 2.
Figure 2.. miR-21 Alters the Magnitude of the Plasma Cell but not GC Response in IMQ Treated Autoimmune-Prone Sle1b Mice.
All data are from Sle1b and Sle1b.miR-21KO mice following 8–12 weeks of IMQ treatment. Data are from 2 independent experiments, each with 5–8 mice per group. Except for histology, each data point represents one mouse (biological replicate). See “Materials and Methods” for more information about histology quantitation. Blue circles are Sle1b IMQ and red circles are Sle1b.miR-21KO IMQ. (A) Gating strategy for identification of plasmablasts, early plasma cells, and mature plasma cells in the spleen. (B-D) Quantification of the percentage and numbers of (B) early plasma cells, (C) mature plasma cells, and (D) plasmablasts. (E) Representative flow plots of the GC B cell (GL-7hiFashi) response. (F-G) Quantification of the (F) percentage GC B cells within the total B220+ population and the (G) total number of GC B cells. (H-I) Quantification of the (H) percentage and the (I) total number of Tfh. (J) Representative images of spleen sections stained for GL-7 (green), CD4 (red), and IgD (blue). Scale bars represent 100μm. (K) Quantification of GC responses by measuring the GC area. Data represent at least 4 mice per genotype. Two group comparison was performed by Mann-Whitney analysis. *p < 0.05, **p < 0.01, ***p < 0.001, and ****p < 0.0001.
Figure 3.
Figure 3.. miR-21 Drives Autoreactive AFC and Autoantibody Responses.
All data are from Sle1b and Sle1b.miR-21KO mice following 8–12 weeks of IMQ treatment. Blue circles are Sle1b IMQ and red circles are Sle1b.miR-21KO IMQ. Results are from 2 independent experiments, each with 4 or more mice per group. Each data point represents one mouse, except for HEp-2 quantitation which is detailed below. (A) Quantitation and representative images of ELISpot analysis of autoantibody secreting B cells producing antibodies with reactivity against dsDNA and SmRNP in the spleens of the indicated genotypes of mice. (B) Quantification and representative images of ELISpot analysis of autoantibody secreting B cells producing antibodies with reactivity against dsDNA and SmRNP in the bone marrow of the indicated genotypes of mice. (C) Representative images of seropositivity/seronegativity following incubation of serum on HEp-2 slides. (D) Quantification of the fluorescence emitted from the detection of autoreactive antibodies bound to HEp-2 cells. Staining was quantitated from 4–5 mice per group. Data points represent measurements taken from random individual 10x fields. (E-G) Serum titers of autoreactive antibodies reactive against (E) dsDNA, (F) nucleosome, and (G) SmRNP. Two group comparison was performed by Mann-Whitney analysis. *p < 0.05, **p < 0.01, ***p < 0.001, and ****p < 0.0001.
Figure 4.
Figure 4.. miR-21 Drives Effector CD4+ T Cell Responses and SLE-Associated Cytokine Production in the Spleens of Sle1b Mice.
All data are from Sle1b and Sle1b.miR-21KO mice following 8–12 weeks of IMQ treatment from 2 independent experiments. Each data point represents one mouse. Blue circles are Sle1b IMQ and red circles are Sle1b.miR-21KO IMQ. (A) Representative flow plots of the effector CD4 T cell response (CD44hiCD62Llo). These plots are pre-gated on total CD4 T cells. (B-C) Quantification of the (B) percentage and (C) number of effector CD4 T cells within the total CD4 T cell population. (D) qPCR for the expression of BAFF, IFNγ, TNF, IL-6, IL-10, IL-12, and IL-21 in total splenocytes. Expression is normalized to HPRT. Two group comparison was performed by Mann-Whitney analysis. *p < 0.05, **p < 0.01, ***p < 0.001, and ****p < 0.0001.
Figure 5.
Figure 5.. miR-21 Expression Alters Cytokine and Interferon Response and Activation Pathway in B Cells Derived from IMQ-Treated Sle1b Mice.
Data are derived from sorted B cells from Sle1b and Sle1b.miR-21KO mice following 8–12 weeks of IMQ treatment. RNAseq was performed on B cells sorted from n=4 mice per group as indicated. Each sample represents B cells sorted from an individual mouse. (A) Principal component analysis (PCA) of the samples from each group (Sle1b IMQ- blue circles; Sle1b.miR-21KO IMQ- red circles). (B) Volcano plot indicating the differentially expressed genes from Sle1b and Sle1b.miR-21KO B cells that meet an adjusted p value cutoff of 0.05. Upregulated genes are depicted in red. Downregulated genes are depicted in blue. (C) Heatmap of the top differentially expressed genes between Sle1b and Sle1b.miR-21KO B cells that meet an adjusted p value cutoff of 0.05 and fold change of 1.5. Upregulated genes are depicted in red. Downregulated genes are depicted in blue. (D) Heatmap of the specific altered genes associated with select processes indicated by GO analysis. (E-L) Significant biological processes identified as enriched by GSEA (considering changes in the entire dataset). Additional information about generation of DEG lists and statistics can be found in the “Materials and Methods.”
Figure 6.
Figure 6.. B Cell Activation Pathways and Activation are Driven by miR-21 in Sle1b Mice.
Data are from Sle1b and Sle1b.miR-21KO mice following 8–12 weeks of IMQ treatment. Blue depicts Sle1b IMQ and red depicts Sle1b.miR-21KO IMQ. (A-C) GSEA plots for enriched genes in the (A) p53, (B) Kras and (C) PI3K/Akt/mTOR pathways. GSEA data is collected from the same mice and in the same manner as detailed in Figure 6. (D, F, H) Representative histograms showing the expression of (D) CD80, (F) CD86, and (H) CD40 on B cells derived from mice of the indicated genotypes. (E, G, I) Quantification of the expression of (D) CD80, (G) CD86, and (I) CD40 on B cells derived from n=4 and n=5 mice of the indicated genotypes. Bars on graphs represent the SD of the data. Two group comparison was performed by Mann-Whitney analysis. *p < 0.05, **p < 0.01, ***p < 0.001, and ****p < 0.0001.
Figure 7.
Figure 7.. miR-21 Expression Increases in B Cells After IMQ and TI-IFN Stimulation, Leading to Suppression of Many miR-21 Target Genes.
(A) Expression of miR-21 in Sle1b B cells following stimulation with R848, R848+IFNα4, or R848+IFNβ for 36 hours. (B) Timecourse of miR-21 expression in Sle1b B cells following stimulation with R848 and IFNβ. (C) Heatmap of miR-21 target gene expression in Sle1b and Sle1b.miR-21KO B cells via qPCR array following 48 hours of stimulation with IMQ and IFNβ. (D) Volcano plot showing the significantly upregulated genes in Sle1b.miR-21KO B cells from qPCR array analysis. Select genes are identified. (E) GO analysis of the 26 upregulated genes identified by qPCR array.
Figure 8.
Figure 8.. miR-21 Drives AFC and GC responses in TLR7-overexpressing SLE-prone mice.
All data are from 3 mo old B6.Sle1b.Yaa (Sle1bYaa) and Sle1bYaamiR-21KO male mice. These data are from the analysis of spleens in 2 independent experiments, each with 4 or more mice per group. Each data point represents one mouse, except for HEp-2 quantitation which is detailed below. (A-C) Spleen size and weight, and quantification of splenocytes. (D) Flow cytometry analysis of the percentage and number of B220+GL-7hiFashi GC B cells. (E) Flow cytometry quantification of the percentage and number of CD4+ effector T cells and (F) number of Tfh cells. (G) Histological analysis of the GC structure and (H) frequency and size. Scale bars in G represent 100μm. (I) Flow cytometry quantification of IgD-CD138+TACI+ plasma cells (PCs). Quantification of ELISpot analysis of autoantibody secreting B cells producing antibodies with reactivity against dsDNA, nucleosome and SmRNP in the (J) spleens and (K) bone marrow of the indicated genotypes of mice. Quantification and representative images of ELISpot analysis of autoantibody secreting B cells producing antibodies with reactivity against dsDNA and SmRNP in the bone marrow of the indicated genotypes of mice. (L,M) IgG and IgG2c serum titers of antibodies to dsDNA, nucleosome and SmRNP, and (N) ANA seropositivity in these mice. (O) Quantification of the numbers of innate cells and various myeloid cells such as monocytes, moDCs and cDCs. Two group comparison was performed by Mann-Whitney analysis. *p < 0.05, **p < 0.01, ***p < 0.001, and ****p < 0.0001.
Figure 9.
Figure 9.. miR-21 Promotes TD-Ag Driven GC Responses.
All data presented in panels A-L are from WT and miR-21KO mice at d10 post-immunization from 3 independent experiments with 3–5 mice per group. Except for histology, each data point represents one mouse (biological replicate). (A) Quantification of the number of B cells in the spleen. (B) Representative flow plots of the GC B cell (B220+GL-7hiFashi) response. (C-D) Quantification of the (C) percentage GC B cells within the total B220+ population and the (D) total number of GC B cells. (E) Quantification of the number of CD4 T cells in the spleen. (F) Representative flow plots of the CD4+CXCR5hiPD-1hi Tfh response. (G-H) Quantification of the (G) percentage of Tfh within the total CD4 T cell population and the (H) total number of Tfh. (I) Representative flow plots for CXCR5hiPD-1hiFoxP3- Tfh and CXCR5hiPD-1hiFoxP3+ Tfr cells within the total CD4+ T cells. Total numbers of (J) Tfh and (K) Tfr cells. (L) Representative images of spleen sections stained for GL-7 (green), CD4 (red), and IgD (blue) and quantification of GC responses by measuring the GC area. Scale bars represent 100μm. Data represent at least 7 mice per genotype. (M-N) Serum antibody titers of NP-specific IgG, IgG1 and IgG2a/c at (M) 10d and (N) 21d post-immunization with NP-KLH. Two group comparison was performed by Mann-Whitney analysis. ns, not significant, *p < 0.05, **p < 0.01, ***p < 0.001, and ****p < 0.0001.

Similar articles

Cited by

References

    1. Tsokos GC 2011. Systemic lupus erythematosus. N Engl J Med 365: 2110–2121. - PubMed
    1. Flores-Mendoza G, Sansón SP, Rodríguez-Castro S, Crispín JC, and Rosetti F. 2018. Mechanisms of Tissue Injury in Lupus Nephritis. Trends Mol Med 24: 364–378. - PubMed
    1. Zeller CB, and Appenzeller S. 2008. Cardiovascular disease in systemic lupus erythematosus: the role of traditional and lupus related risk factors. Curr Cardiol Rev 4: 116–122. - PMC - PubMed
    1. Domeier PP, Schell SL, and Rahman ZS. 2017. Spontaneous germinal centers and autoimmunity. Autoimmunity 50: 4–18. - PMC - PubMed
    1. Shlomchik MJ 2008. Sites and stages of autoreactive B cell activation and regulation. Immunity 28: 18–28. - PubMed

Publication types