. 2021 May 26;12(1):3155.
doi: 10.1038/s41467-021-23329-z.

Generation of mature compact ventricular cardiomyocytes from human pluripotent stem cells

Affiliations

Generation of mature compact ventricular cardiomyocytes from human pluripotent stem cells

Shunsuke Funakoshi et al. Nat Commun. .

Abstract

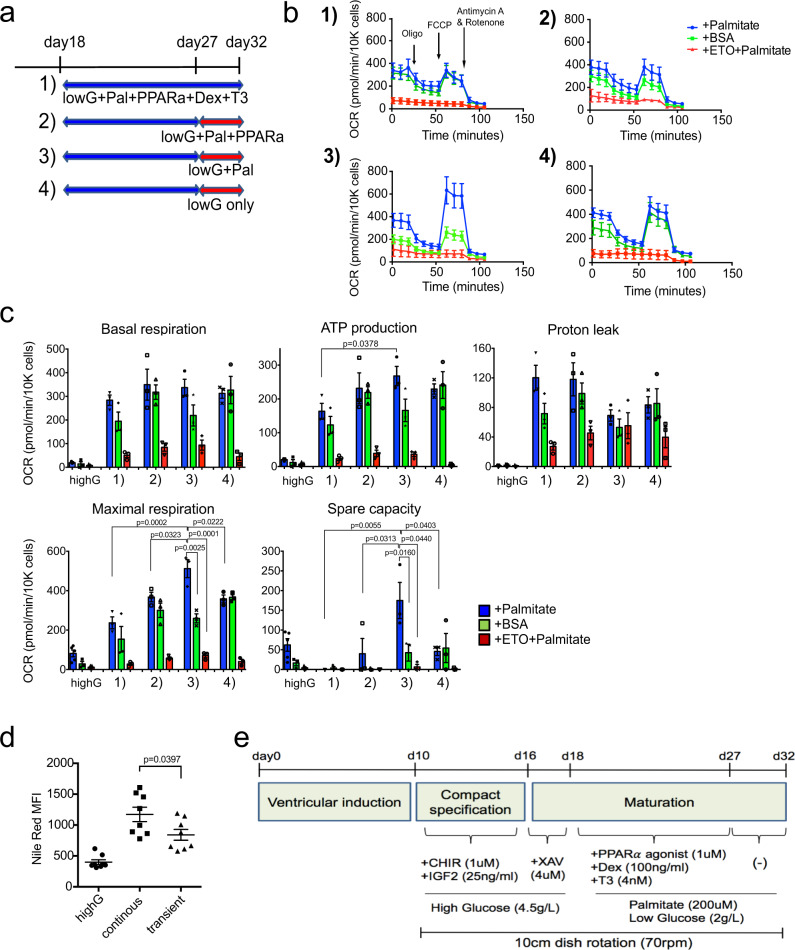
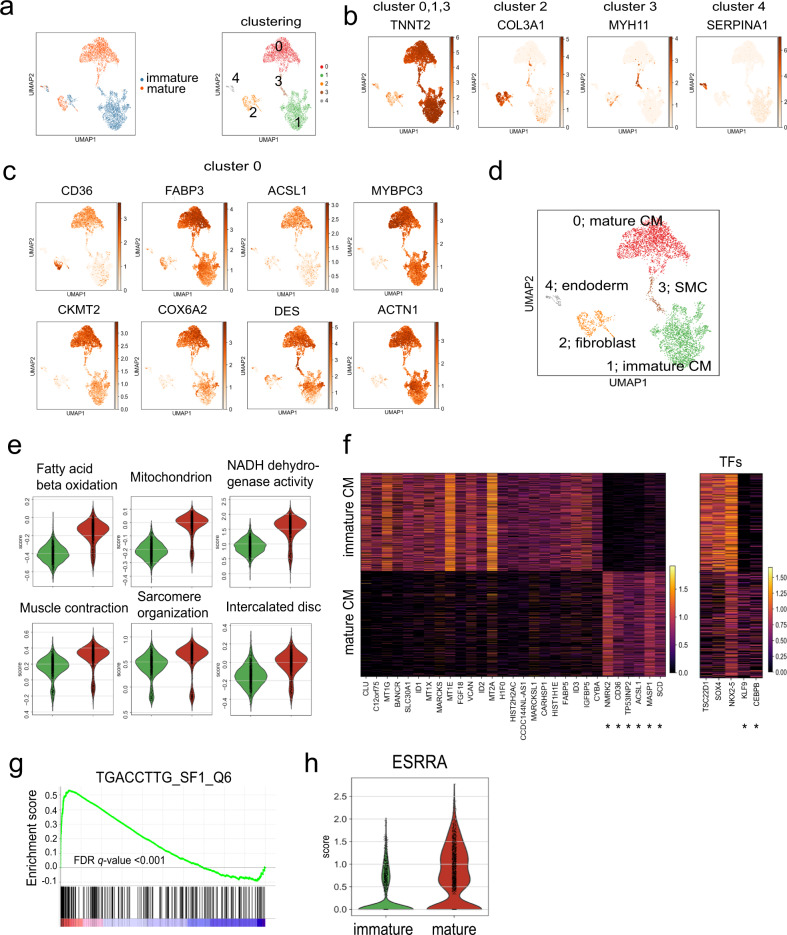
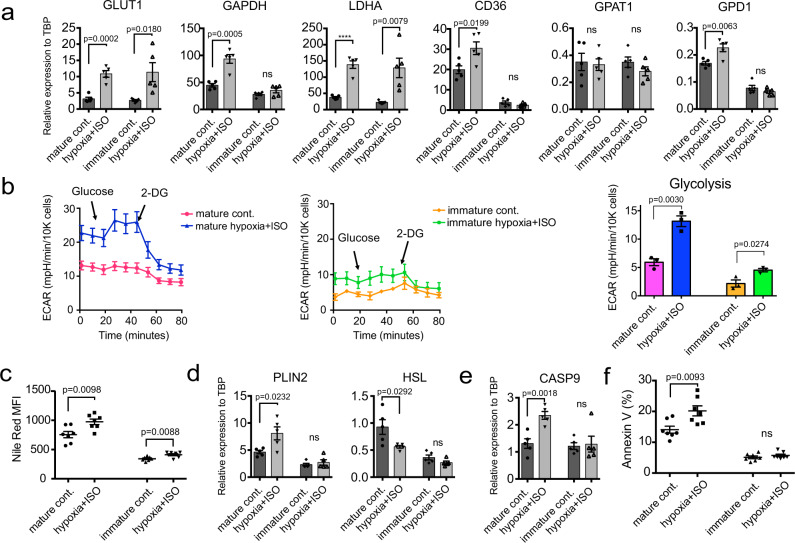
Compact cardiomyocytes that make up the ventricular wall of the adult heart represent an important therapeutic target population for modeling and treating cardiovascular diseases. Here, we established a differentiation strategy that promotes the specification, proliferation and maturation of compact ventricular cardiomyocytes from human pluripotent stem cells (hPSCs). The cardiomyocytes generated under these conditions display the ability to use fatty acids as an energy source, a high mitochondrial mass, well-defined sarcomere structures and enhanced contraction force. These ventricular cells undergo metabolic changes indicative of those associated with heart failure when challenged in vitro with pathological stimuli and were found to generate grafts consisting of more mature cells than those derived from immature cardiomyocytes following transplantation into infarcted rat hearts. hPSC-derived atrial cardiomyocytes also responded to the maturation cues identified in this study, indicating that the approach is broadly applicable to different subtypes of the heart. Collectively, these findings highlight the power of recapitulating key aspects of embryonic and postnatal development for generating therapeutically relevant cell types from hPSCs.


Conflict of interest statement

G.M.K. is a scientific co-founder and paid consultant for BlueRock Therapeutics LP, a paid consultant for VistaGen Therapeutics and a board member of Anagenesis Biotechnologies. M.A.L. is founding investigator and paid consultant for BlueRock Therapeutics. S.P. is a paid consultant for BlueRock Therapeutics. All other authors declare no competing interests.

Figures

Fig. 1
Fig. 1. Generation of compact cardiomyocytes.
a Schema of the protocol for ventricular cardiomyocyte differentiation from hPSCs. b tSNE plot of a day 20 ventricular cardiomyocyte population showing 9 different clusters in the cTNT+ subpopulation and c the expression patterns of cTNT, MYL2, HEY2 and NPPA within them. d Results from pathway analysis showing signaling pathways upregulated in the HEY2high cells compared to the NPPAhigh cells. e Protocol for generation of compact cardiomyocytes in vitro. f Quantification of the changes in the percentage of Ki67+ cardiomyocytes in day 10 and 16 cardiomyocyte populations treated as indicated. CHIR (1 uM), IGF2 (25 ng/ml), XAV (4 uM) (N = 4). day 12: control vs CHIR + IGF2, p = 0.009, day 14: control vs CHIR; p = 0.0212, control vs IGF2; p = 0.0410, control vs CHIR + IGF2; p = 0.0021 by two-sided unpaired t-test (*p < 0.05, **p < 0.01). g Quantification of the relative number of cardiomyocytes in the day 16 populations treated as indicated. DMSO control set as 1 (N = 8 for control, CHIR- IGF2-, and CHIR + IGF2-treated, N = 4 for XAV-treated). h RT-qPCR expression analyses of compact (HEY2 and MYCN) and trabecular (NPPA and BMP10) markers in the indicated populations (N = 4). Fetal LV and RA tissues (gestation week 17) were included as a reference for in vivo expression. i Representative immunostaining of compact (CHIR + IGF2 treated), trabecular (NRG treated), and DMSO treated (control) cardiomyocytes. Scale bar: 100 um. j Quantification of the percentage of ANF+/cTNT+ cardiomyocytes in compact, trabecular, and non-treated ventricular (control) populations (N = 3). Statistical analyses in gj were performed by one-way ANOVA with Tukey’s multiple comparisons (****p < 0.0001). Data are presented as mean values ± SEM. Fetal LV: Fetal left ventricular tissue (N = 4), Fetal RA: Fetal right atrial tissue (N = 2). All values shown for the PCR analyses are relative to the housekeeping gene TBP.
Fig. 2
Fig. 2. Induction of FAO in compact cardiomyocytes.
a Representative flow cytometric analyses of CD36 and SIRPA expression on day 18 and derivative day 32 cardiomyocyte populations cultured in the indicated conditions; GW7647 (PPARa agonist; 1 uM), Palmitate (200 uM), Dexamethasone (Dex) (100 ng/ml), T3 (4 nM). b Quantification of the proportion of CD36+/SIRPA+ cells in day 32 populations cultured from day 18 to 32 in the indicated conditions (N = 11). c RT-qPCR expression analyses of FAO-related genes in day 32 cardiomyocytes cultured in the indicated conditions (N = 10 for control, DT-, and PPDT-treated, N = 9 for Pal-treated for analysis of CD36, FABP3, CPT1B, MLYCD, ACC2, ATP5A1, and COX7A1, N = 6 for all conditions for CKMT2 analyses). Fetal LV and adult LV tissues were included as a reference for in vivo expression. d Representative kinetics of the oxygen consumption rate (OCR) measured with FAO Cell Mito stress test assay in day 16 immature cardiomyocytes (day 16 immature) and day 32 cardiomyocytes cultured in the indicated conditions. (day 16; data are from 2 technical replicates in palmitate, single sample in BSA, single sample in ETO, day 32 control; data from 2 technical replicates in palmitate, single sample in BSA, single sample in ETO, day 32 Pal; data are from 9 technical replicates in palmitate, 10 technical replicates in BSA, 2 technical replicates in ETO, day 32 DT; data are from 10 technical replicates in palmitate, 10 technical replicates in BSA, 2 technical replicates in ETO, day 32 PPDT; data are from 9 technical replicates in palmitate, 10 technical replicates in BSA, 2 technical replicates in ETO). e Comparison of each parameter of the FAO Cell Mito stress assay in the cardiomyocytes cultured under the indicated conditions (day 16; N = 5, day 32 control; N = 5, day 32 Pal; N = 3, day 32 DT; N = 5, day 32 PPDT; N = 4 biologically independent experiments). f Representative transmission electron microscope images of lipid droplets (white arrows) in cardiomyocytes cultured under the indicated conditions. Scale bar; 1 um. g Flow cytometric analyses of Nile Red staining in day 32 cardiomyocytes treated as indicated (N = 8). All statistical analyses were performed by one-way ANOVA with Tukey’s multiple comparisons (****p < 0.0001). Data are presented as mean values ± SEM. Fetal LV: Fetal left ventricular tissue (N = 3−4), Adult LV: Adult left ventricular tissue (N = 3−4).
Fig. 3
Fig. 3. Transient activation of the FAO pathway improves metabolic profiles in mature compact cardiomyocytes.
a Experimental scheme used to determine the effects of manipulating the duration of PPDT treatment. Cardiomyocytes were treated either for the full 14 days with PPDT or for 9 days with PPDT followed by culture for 5 days in the indicated conditions. b Representative kinetics of OCR in the four conditions depicted in a 1); data are from 7 technical replicates in palmitate, 9 technical replicates in BSA, 2 technical replicates in ETO, 2); data are from 7 technical replicates in palmitate, 5 technical replicates in BSA, 2 technical replicates in ETO, 3); data are from 9 technical replicates in palmitate, 8 technical replicates in BSA, 2 technical replicates in ETO, 4); data are from 6 technical replicates in palmitate, 7 technical replicates in BSA, 2 technical replicates in ETO). c Comparison of each of the parameters measured in the FAO Cell Mito stress assay in day 32 cardiomyocytes cultured in the condition shown in a (N = 3 biologically independent experiments). Statistical analyses were performed by one-way ANOVA with Tukey’s multiple comparisons. d Flow cytometric analyses of Nile Red staining in day 32 cardiomyocytes treated either continuously with PPDT (continuous) or for 9 days followed by 5 days of culture in Pal (transient) (N = 8). Statistical analyses were performed by two-sided unpaired t-test. e Protocol for the generation of mature compact cardiomyocytes. Data are presented as mean values ± SEM.
Fig. 4
Fig. 4. Structural characteristics of metabolically mature compact cardiomyocytes.
a Representative immunostaining of cardiomyocytes generated under the indicated conditions. Scale bar: 100 um. b Quantification of the size of the cardiomyocytes (N = 73 cells from control, 67 cells from Pal, 66 cells from DT, and 66 cells from mature conditions examined over 5 independent experiments) and c the proportion of binucleated cardiomyocytes generated under the indicated conditions (N = 5 independent experiments). d Representative transmission electron microscope (TEM) images of sarcomere structures (Scale bar; 1 um) and e Quantification of sarcomere length (based on TEM analyses) in the cardiomyocytes generated under the indicated conditions (N = 72 cells from control, 43 cells from Pal, 67 cells from DT, and 78 cells from mature conditions examined over 3 independent experiments). f Representative TEM images of mitochondria structure (Scale bar; 1 um) and g Quantification of mitochondria size in cardiomyocytes generated under the indicated conditions (N = 76 cells from control, 64 cells from Pal, 90 cells from DT, and 84 cells from mature conditions examined over 3 independent experiments). h Representative Ca2+ transient in day 32 control and mature cardiomyocytes. i Quantification of the parameters associated with Ca2+ transient measurement (N = 10 samples from control, 8 samples from Pal, 11 samples from DT, and 19 samples from mature conditions examined over 3 independent experiments) and j Quantification of contraction force of biowire cardiac tissues generated under the indicated conditions (N = 7 tissues from control, 8 from Pal, 9 from DT, and 7 from mature conditions. All plots were derived from biologically independent experiments). k RT-qPCR expression analyses of mitochondria-related genes (CKMT2, COX7A1, COX6A2), sarcomere genes (MYL2, MYOZ2), and Ca2+ handling gene (ATP2A2) in immature and mature cardiomyocytes and mature cardiomyocytes cultured with etomoxir (40 uM) (mature+ETO) (N = 7). Fetal LV and adult LV tissues were included as a reference for in vivo expression. All statistical analyses were performed by one-way ANOVA with Tukey’s multiple comparisons (****p < 0.0001). Data are presented as mean values ± SEM. Fetal LV: Fetal left ventricular tissue (N = 3−4), Adult LV: Adult left ventricular tissue (N = 4).
Fig. 5
Fig. 5. Single cell RNA sequencing analyses of mature compact cardiomyocytes.
a UMAP plot of the combined data set of day 32 immature and mature cardiomyocytes showing 5 different clusters. UMAP plots of the expression patterns of representative genes in the different clusters (b) and of the expression patterns of representative genes found at higher levels in cluster 0 than the other clusters (c). d UMAP plot indicating the lineage composition of the 5 different populations. e Violin plots of the Gene Ontology (GO) analyses comparing the mature (cluster 0, red) to the immature cardiomyocytes (cluster 1, green). f Heatmap visualization of marker genes (left) and transcription factors (right) using a binary enrichment search. *maturation signature genes. g Enrichment score plot of the TGACCTTG_SF1_Q6 gene set. h Violin plot of ESRRA expression in the immature (cluster 1) and mature (cluster 0) cardiomyocytes.
Fig. 6
Fig. 6. Detailed molecular analyses of the mature cardiomyocyte population.
a UMAP plot of mature cardiomyocytes showing 4 different clusters. b Violin plots of the Gene Ontology (GO) analysis comparing expression patterns in the indicated clusters. c UMAP plot showing expression patterns of CD36 and LDLR. d Representative flow cytometric analyses of CD36 and LDLR expression in the immature and mature cardiomyocytes on the indicated days of differentiation. e RT-qPCR expression analyses of ESRRA in day 32 cardiomyocytes cultured in the indicated conditions (N = 4). f RT-qPCR expression analyses of ESRRA in the immature, mature, and mature ESRRA knock down cardiomyocytes (KD mature) (N = 10). g RT-qPCR expression analyses of FAO (FABP3, ACSL1) and sarcomere (MYL2, TCAP)-related genes in the immature, mature, and KD mature cardiomyocytes (N = 10). h Flow cytometric analyses of Nile Red staining in the indicated cell populations (N = 4). i RT-qPCR expression analyses of HSL in the immature, mature, and KD mature cardiomyocytes (N = 10). All statistical analyses were performed by one-way ANOVA with Tukey’s multiple comparisons (****p < 0.0001). Data are presented as mean values ± SEM. Fetal LV and adult LV tissues were included as a reference for in vivo expression in the RT-qPCR analyses. Fetal LV: Fetal left ventricular tissue (N = 3−4), Adult LV: Adult left ventricular tissue (N = 4).
Fig. 7
Fig. 7. Maturation of atrial cardiomyocytes.
a Representative TEM images of sarcomere structures in the control (immature) and PPDT/PAL treated (mature) atrial cardiomyocytes. Scale bar; 1 um. b Quantification of sarcomere length (based on TEM analyses) in immature and mature atrial cardiomyocytes (N = 49 cells from control atrial and 74 cells from mature atrial examined over 3 independent experiments). c Representative TEM images of mitochondria structure in control and mature atrial cardiomyocytes. Scale bar; 1 um. d Quantification of mitochondria size in control and mature atrial cardiomyocytes (N = 79 cells from control atrial and 105 cells from mature atrial examined over 3 independent experiments). e Representative flow cytometric analyses of CD36 and SIRPA expression in control and mature atrial cardiomyocytes. f Quantification of the proportion of CD36+/SIRPA+ cells in control and mature atrial populations (N = 5). g RT-qPCR expression analyses of FAO-related genes in control and mature atrial cardiomyocytes (N = 7 biologically independent experiments from control atrial and N = 8 from mature atrial). Fetal RA tissues were included as a reference for in vivo expression. h Representative kinetics of the oxygen consumption rate (OCR) measured with the FAO Cell Mito stress test assay in control and mature atrial cardiomyocytes (control-atrial; data from 10 technical replicates in palmitate, 10 technical replicates in BSA, 2 technical replicates in ETO, mature atrial; data from 9 technical replicates in palmitate, 10 technical replicates in BSA, 2 technical replicates in ETO). i Comparison of each parameter of the FAO Cell Mito stress assay in control and mature atrial cardiomyocytes (N = 3 biologically independent experiments). OCR in each parameter measured with palmitate (blue) was compared by two-sided unpaired t-test and maximal respiration in mature atrial cells was compared by one-way ANOVA with Tukey’s multiple comparisons. All other statistical analyses (b, d, f, g) were performed by two-sided unpaired t-test (****p < 0.0001). Data are presented as mean values ± SEM. Fetal RA: Fetal right atrial tissue (N = 2).
Fig. 8
Fig. 8. Modeling pathological adaptation using mature compact cardiomyocytes.
a RT-qPCR expression analyses of glycolysis-related and TAG synthesis-related genes in untreated and hypoxia+ISO-treated immature and mature ventricular cardiomyocytes (N = 5). b Left; Representative kinetics of ECAR measured by the seahorse XF assay in untreated and hypoxia+ISO-treated immature and mature ventricular cardiomyocytes (mature control; data from 3 technical replicates, mature hypoxia+ISO; data from 3 technical replicates, immature control; data from 3 technical replicates, immature hypoxia+ISO; data from 3 technical replicates). Right; Quantification of glycolysis based on ECAR measurement with the seahorse XF assay in the indicated cardiomyocyte populations (N = 3 biologically independent experiments). c Flow cytometric analyses of Nile Red staining in the indicated populations (N = 7). d RT-qPCR expression analyses of PLIN2 and HSL and e CASP9 in the indicated populations (N = 5). f Flow cytometric-based quantification of the proportion of Annexin V+ cells in untreated and hypoxia+ISO-treated immature and mature ventricular cardiomyocyte populations (N = 7). All statistical analyses were performed by two-sided unpaired t-test (****p < 0.0001). Data are presented as mean values ± SEM. ns not significant.
Fig. 9
Fig. 9. Engraftment of mature and immature cardiomyocytes into infarcted rat hearts.
a Representative immunostaining of whole rat hearts 2 and 8 weeks following transplantation of the mature and immature cardiomyocyte populations. b Quantification of graft size generated from the transplanted mature and immature cells (N = 8 recipients of 2-week immature cells, 6 recipients of 2-week mature cells, 8 recipients of 8-week immature cells, and 9 recipients of 8-week mature cells). c Representative immunostaining of human cardiomyocyte grafts 2 and 8 weeks following transplantation of the indicated cardiomyocyte populations. Scale bar: 20 um. d Quantification of sarcomere length in cardiomyocytes in grafts (2 and 8 weeks) generated from immature and mature cells (N = 8 recipients of 2-week immature cells, 5 recipients of 2-week mature cells, 8 recipients of 8-week immature cells, and 8 recipients of 8-week mature cells). e Representative immunostaining showing Ki67+ cells in cardiomyocyte grafts generated from immature and mature cells. Scale bar: 20 um. f Quantification of the percentage of Ki67+ cardiomyocytes in grafts (2 and 8 weeks) derived from immature and mature cells (N = 8 recipients of 2-week immature cells, 5 recipients of 2-week mature cells, 8 recipients of 8-week immature cells, and 8 recipients of 8-week mature cells). g Representative immunostaining showing CX43 expression in grafts derived from immature and mature cells. Scale bar: 20 um. h Quantification of CX43 expression in grafts (2 and 8 weeks) derived from immature and mature cells (N = 8 recipients of 2-week immature cells, 5 recipients of 2-week mature cells, 8 recipients of 8-week immature cells, and 8 recipients of 8-week mature cells). Quantification of the sarcomere length, the proportion of Ki67+ cardiomyocytes, and CX43 expression was evaluated from 5 to 10 randomly selected areas of cTNT+ grafted cardiomyocytes and averaged for each transplanted heart. All statistical analyses were performed by one-way ANOVA with Tukey’s multiple comparisons (****p < 0.0001). Data are presented as mean values ± SEM.

References

    1. Protze SI, Lee JH, Keller GM. Human pluripotent stem cell-derived cardiovascular cells: from developmental biology to therapeutic applications. Cell Stem Cell. 2019;25:311–327. doi: 10.1016/j.stem.2019.07.010. - DOI - PubMed
    1. Lescroart F, et al. Early lineage restriction in temporally distinct populations of Mesp1 progenitors during mammalian heart development. Nat. Cell Biol. 2014;16:829–840. doi: 10.1038/ncb3024. - DOI - PMC - PubMed
    1. Zhang W, Chen H, Qu X, Chang CP, Shou W. Molecular mechanism of ventricular trabeculation/compaction and the pathogenesis of the left ventricular noncompaction cardiomyopathy (LVNC) Am. J. Med Genet C. Semin Med Genet. 2013;163C:144–156. doi: 10.1002/ajmg.c.31369. - DOI - PMC - PubMed
    1. Merki E, et al. Epicardial retinoid X receptor alpha is required for myocardial growth and coronary artery formation. Proc. Natl Acad. Sci. USA. 2005;102:18455–18460. doi: 10.1073/pnas.0504343102. - DOI - PMC - PubMed
    1. Zamora M, Manner J, Ruiz-Lozano P. Epicardium-derived progenitor cells require beta-catenin for coronary artery formation. Proc. Natl Acad. Sci. USA. 2007;104:18109–18114. doi: 10.1073/pnas.0702415104. - DOI - PMC - PubMed

Publication types

MeSH terms

Grants and funding