. 2021 May 26;7(1):60.
doi: 10.1038/s41523-021-00270-4.

Treatment scheduling effects on the evolution of drug resistance in heterogeneous cancer cell populations

Affiliations

Treatment scheduling effects on the evolution of drug resistance in heterogeneous cancer cell populations

Gauri A Patwardhan et al. NPJ Breast Cancer. .

Abstract

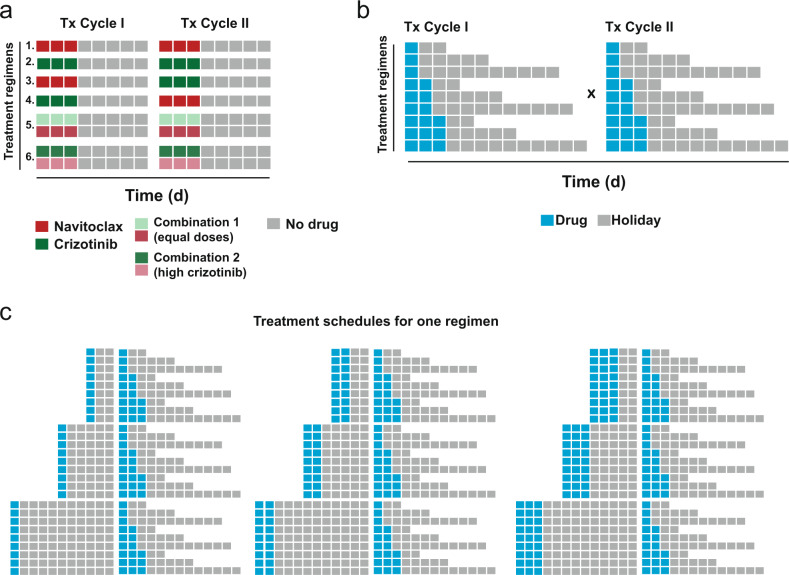
The effect of scheduling of targeted therapy combinations on drug resistance is underexplored in triple-negative breast cancer (TNBC). TNBC constitutes heterogeneous cancer cell populations the composition of which can change dynamically during treatment resulting in the selection of resistant clones with a fitness advantage. We evaluated crizotinib (ALK/MET inhibitor) and navitoclax (ABT-263; Bcl-2/Bcl-xL inhibitor) combinations in a large design consisting of 696 two-cycle sequential and concomitant treatment regimens with varying treatment dose, duration, and drug holiday length over a 26-day period in MDA-MB-231 TNBC cells and found that patterns of resistance depend on the schedule and sequence in which the drugs are given. Further, we tracked the clonal dynamics and mechanisms of resistance using DNA-integrated barcodes and single-cell RNA sequencing. Our study suggests that longer formats of treatment schedules in vitro screening assays are required to understand the effects of resistance and guide more realistically in vivo and clinical studies.


Conflict of interest statement

C.H. is currently a full-time employee of Bristol Myers Squibb. V.B.W. is currently a full-time employee of the Janssen Pharmaceutical Companies of Johnson and Johnson. L.P. has received consulting fees and honoraria from Pfizer, Astra Zeneca, Merck, Novartis, Genentech, Eisai, Pieris, Immunomedics, Seattle Genetics, Almac, Biotheranostics, and Syndax. The remaining authors declare no competing interests.

Figures

Fig. 1
Fig. 1. Schematic of in-vitro experimental design to assess the efficacy of drug combinations.
a Depiction of the six sequential and concurrent treatment regimens tested in this study. A seventh regimen included vehicle treatment. b Treatment regimens included two treatment cycles, each comprising of a treatment phase (incubation with the drug) and a drug-free recovery period. c Set of 81 treatment schedules evaluated for each treatment regimen.
Fig. 2
Fig. 2. Assessment of concurrent combination treatment regimens.
a Cell growth curve for two different combination regimens. The schedules included two cycles, each consisting of a 3-day treatment period followed by a 10-day recovery period. Points on time axis: a-pre-treatment baseline, b-after 2 days treatment, c-after 3 days treatment, d-after 10 days of recovery, e-after 2 days of treatment in cycle 2, f-after 3 days of treatment in cycle 2, g-after 10 days of recovery in cycle 2. b Percentage of apoptotic cells using Annexin V and PI staining at different treatment points in the schedule. c Mammosphere count after the end of the treatment schedule. d Colony formation assay after the end of the treatment schedule. Representative pictures of colony formation are provided in Supplementary Fig. 2b. e Quantification by Western blot of protein levels involved in targeted pathways. In ad, the error bars shown represent the standard deviation of triplicate measurements (biological replicates). P-values are from a two-sided t-test.
Fig. 3
Fig. 3. Sequential regimens result in different patterns of resistance.
a Growth curves associated with sequential treatment regimens and schedules. Cells received a 3-day treatment followed by 2 days (top), 5 days (middle), or 10 days (lower) of recovery in cycle 1, followed by 3-day treatment and 10-day recovery in cycle 2. Left Panel: navitoclax given as cycle 1 treatment. Right panel: crizotinib given as cycle 1 treatment. b Quantification by Western blot of protein levels involved in targeted pathways at different times in the treatment cycle. Letters correspond to the time points on the plots in a. The colors identifying the different samples at each time point corresponding to the color of the curves in a.
Fig. 4
Fig. 4. Effect of treatment schedules on cell response.
a Effect of cycle 1 treatment and duration on MDA-MB-231 cell growth. b Effect of the duration of drug-free recovery after cycle 1. Each group corresponds to a different duration of drug-free recovery and includes all cycle 1 schedules for the corresponding treatment regimen. c Effect of cycle 2 treatment and duration over all the combinations of cycle 1 treatment durations and drug-free recovery periods. d Effect of the duration of recovery after cycle 2, over all the other combinations of prior durations. Combination 1 included equal doses of navitoclax and crizotinib. Combination 2 included a higher dose of crizotinib than navitoclax. Throughout the plots, points have been color-coded based on the duration of cycle 1 treatment (vehicle—black, 1 day—red, 2 days—blue, 3 days—green). Since scales on panels a and b differ, we added a red reference line at 3000 to make the comparison easier. The box plots represent the distribution in the luminescence value, with the lower and upper sides of the box representing the first (Q1) and third (Q3) quartiles, the thick line representing the median, and the length of the upper and lower whiskers being 1.5(Q3-Q1).
Fig. 5
Fig. 5. Navitoclax treatment selects pre-existing resistant clones.
a The number of common unique barcodes between baseline, post-treatment cycle 1, and post-treatment cycle 2 samples. b The number of new and existing clones that increased in abundance as detected at end of each cycle: Cycle 1— Post 1st treatment versus Baseline; Cycle 2— Post 2nd treatment versus Post 1st treatment. c The distribution of barcodes divided into the 5 subgroups defined in panel a, shows a considerable decrease in barcode complexity after treatment. Groups are labeled by a sequence of three numbers representing inclusion (1) or exclusion (0) in the baseline, post-cycle 1, and post-cycle 2 samples. d Clonal evolution of cancer cells estimated by the observed barcode prevalence weighted by the abundance of each barcode.
Fig. 6
Fig. 6. Effects of navitoclax treatment at the single-cell level.
a Expression heatmap of top five markers of 4 important cell groups defined in DNA-barcoding experiment. b UMAP plot presenting cell clustering after alignment of the samples. The name of each cluster represents the dominance of cells from particular samples. c Expression of selected important genes presented on UMAP plot (left side) and summarized on boxplot (right side). Above each boxplot, there is a proportion of expressed cells per sample.

References

    1. Zanardi E, Bregni G, de Braud F, Di Cosimo S. Better together: targeted combination therapies in breast cancer. Semin. Oncol. 2015;42:887–895. doi: 10.1053/j.seminoncol.2015.09.029. - DOI - PubMed
    1. Bozic I, et al. Evolutionary dynamics of cancer in response to targeted combination therapy. Elife. 2013;2:e00747. doi: 10.7554/eLife.00747. - DOI - PMC - PubMed
    1. Groenendijk FH, Bernards R. Drug resistance to targeted therapies: deja vu all over again. Mol. Oncol. 2014;8:1067–1083. doi: 10.1016/j.molonc.2014.05.004. - DOI - PMC - PubMed
    1. Knox JJ, et al. Final overall survival analysis for the phase II RECORD-3 study of first-line everolimus followed by sunitinib versus first-line sunitinib followed by everolimus in metastatic RCC. Ann. Oncol. 2017;28:1339–1345. doi: 10.1093/annonc/mdx075. - DOI - PMC - PubMed
    1. Barbolosi D, Ciccolini J, Lacarelle B, Barlesi F, Andre N. Computational oncology–mathematical modelling of drug regimens for precision medicine. Nat. Rev. Clin. Oncol. 2016;13:242–254. doi: 10.1038/nrclinonc.2015.204. - DOI - PubMed