

Computational design of single-stranded DNA hairpin aptamers immobilized on a biosensor substrate
- PMID: 34040012
- PMCID: PMC8155018
- DOI: 10.1038/s41598-021-88796-2
Computational design of single-stranded DNA hairpin aptamers immobilized on a biosensor substrate
Abstract
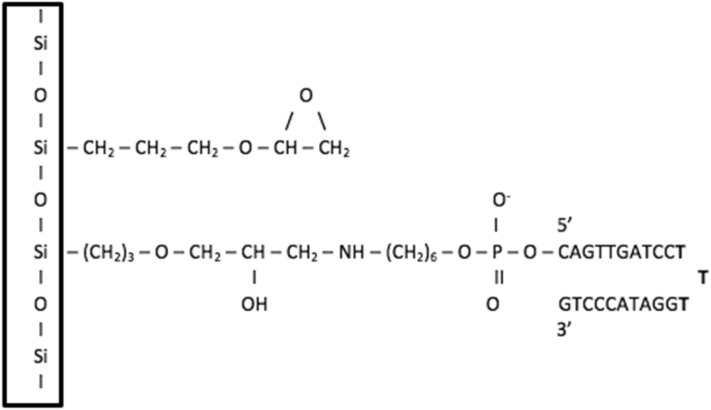
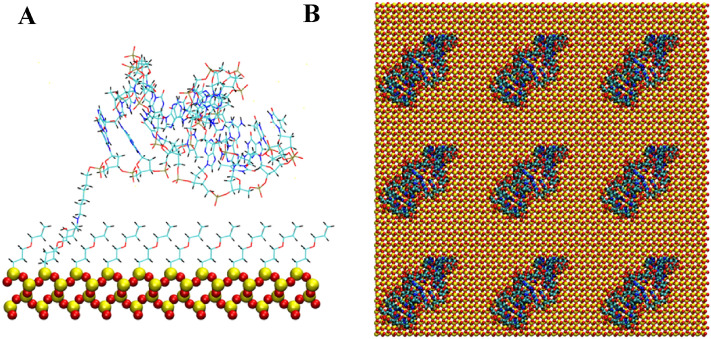
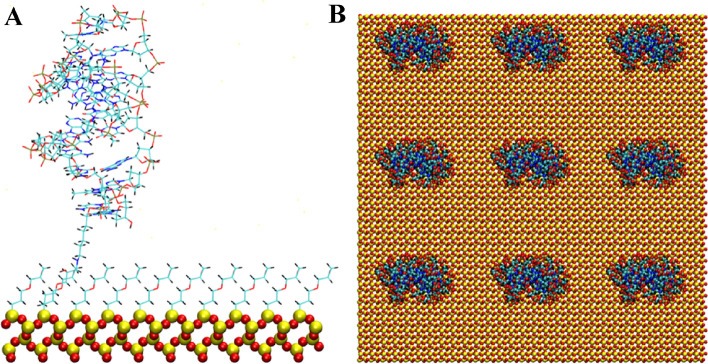
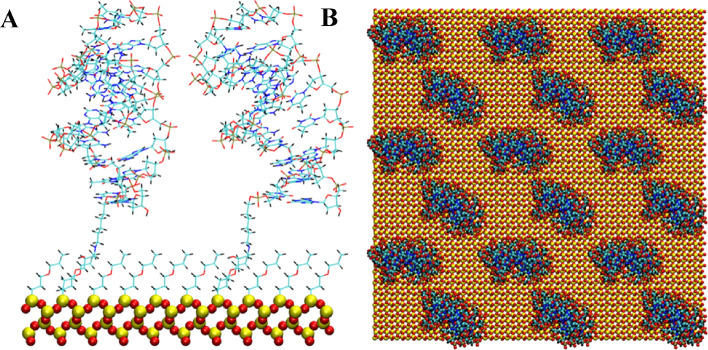
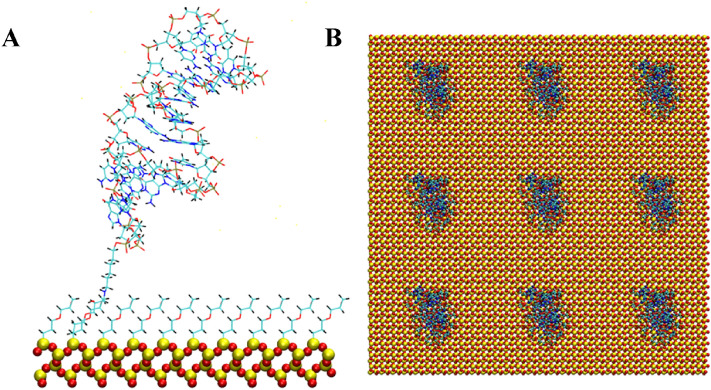
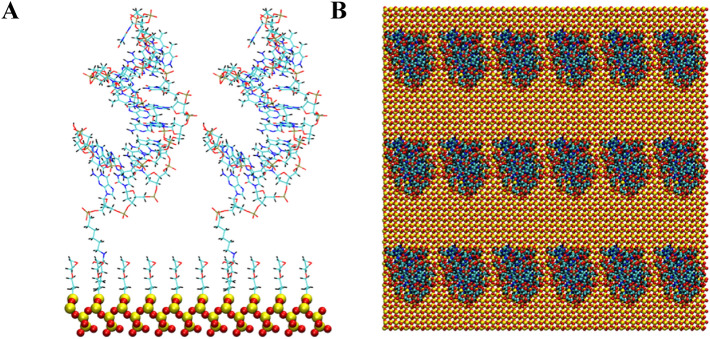
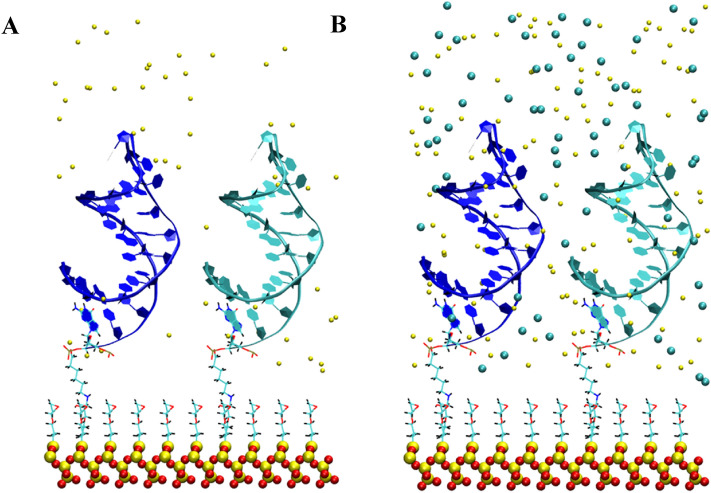
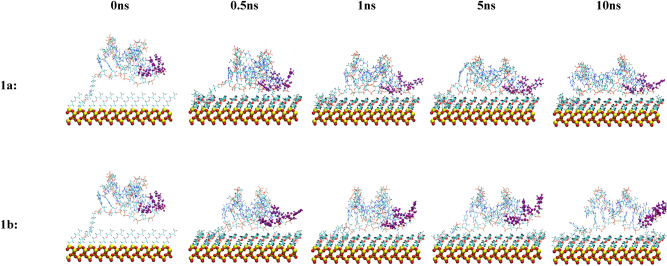
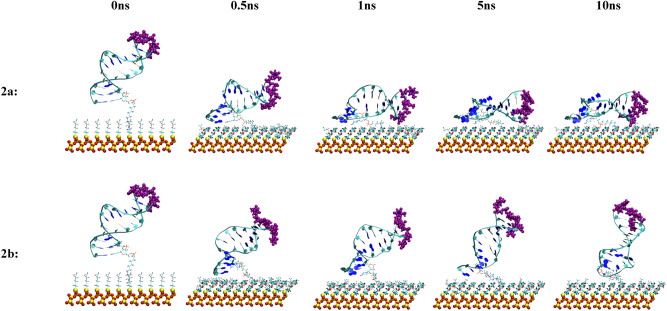
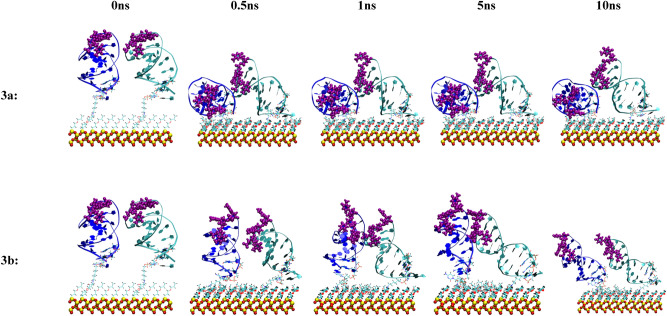
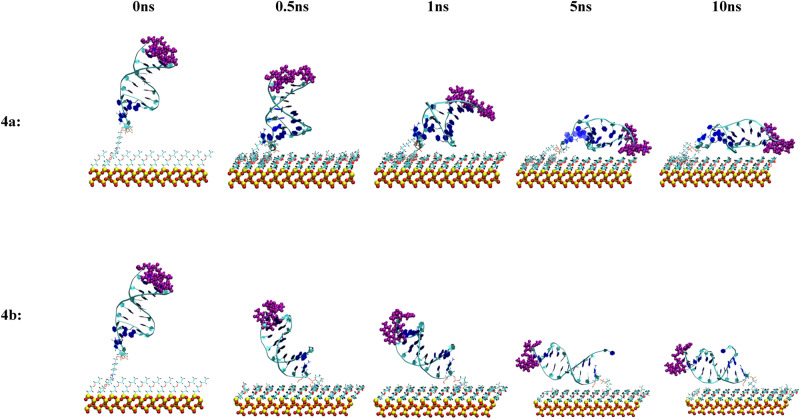
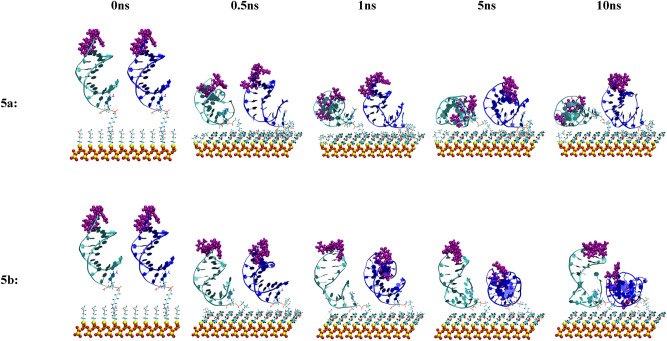
Aptamer interactions with a surface of attachment are central to the design and performance of aptamer-based biosensors. We have developed a computational modeling approach to study different system designs-including different aptamer-attachment ends, aptamer surface densities, aptamer orientations, and solvent solutions-and applied it to an anti MUC1 aptamer tethered to a silica biosensor substrate. Amongst all the system designs explored, we found that attaching the anti MUC1 aptamer through the 5' terminal end, in a high surface density configuration, and solvated in a 0.8 M NaCl solution provided the best exposure of the aptamer MUC1 binding regions and resulted in the least amount of aptamer backbone fluctuations. Many of the other designs led to non-functional systems, with the aptamer collapsing onto the surface. The computational approach we have developed and the resulting analysis techniques can be employed for the rational design of aptamer-based biosensors and provide a valuable tool for improving biosensor performance and repeatability.
Conflict of interest statement
The authors declare no competing interests.
Figures
Similar articles
-
Molecular Dynamics Simulation Analysis of Anti-MUC1 Aptamer and Mucin 1 Peptide Binding.J Phys Chem B. 2015 Jun 4;119(22):6571-83. doi: 10.1021/acs.jpcb.5b02483. Epub 2015 May 21. J Phys Chem B. 2015. PMID: 25963836
-
Aptasensors as a new sensing technology developed for the detection of MUC1 mucin: A review.Biosens Bioelectron. 2019 Apr 1;130:1-19. doi: 10.1016/j.bios.2019.01.015. Epub 2019 Jan 15. Biosens Bioelectron. 2019. PMID: 30716589 Review.
-
An electrochemical method based on CRISPR-Cas12a and enzymatic reaction for the highly sensitive detection of tumor marker MUC1 mucin.Analyst. 2024 Jul 22;149(15):3920-3927. doi: 10.1039/d4an00595c. Analyst. 2024. PMID: 38912896
-
DNA aptamers against the MUC1 tumour marker: design of aptamer-antibody sandwich ELISA for the early diagnosis of epithelial tumours.Anal Bioanal Chem. 2008 Feb;390(4):1039-50. doi: 10.1007/s00216-007-1470-1. Epub 2007 Aug 11. Anal Bioanal Chem. 2008. PMID: 17694298
-
Duplexed aptamers: history, design, theory, and application to biosensing.Chem Soc Rev. 2019 Mar 4;48(5):1390-1419. doi: 10.1039/c8cs00880a. Chem Soc Rev. 2019. PMID: 30707214 Review.
Cited by
-
DNA aptamer-functionalized PDA nanoparticles: from colloidal chemistry to biosensor applications.Front Bioeng Biotechnol. 2024 Jul 9;12:1427229. doi: 10.3389/fbioe.2024.1427229. eCollection 2024. Front Bioeng Biotechnol. 2024. PMID: 39045538 Free PMC article.
-
Transcriptomic analysis of the inhibition mechanisms against Pseudomonas plecoglossicida by antibacterial aptamer B4.Front Vet Sci. 2024 Dec 24;11:1511234. doi: 10.3389/fvets.2024.1511234. eCollection 2024. Front Vet Sci. 2024. PMID: 39776596 Free PMC article.
-
Aptasensors versus immunosensors-Which will prevail?Eng Life Sci. 2022 Jan 13;22(3-4):319-333. doi: 10.1002/elsc.202100148. eCollection 2022 Mar. Eng Life Sci. 2022. PMID: 35382545 Free PMC article. Review.
-
Application of multivalent aptamers in tumor diagnosis, analysis and therapy (Review).Oncol Lett. 2025 May 2;30(1):325. doi: 10.3892/ol.2025.15071. eCollection 2025 Jul. Oncol Lett. 2025. PMID: 40370647 Free PMC article. Review.
References
-
- Sinha SK, Saiz L. Determinants of protein–ligand complex formation in the thyroid hormone receptor α: a Molecular Dynamics simulation study. Comput. Theor. Chem. 2014;1038:57–66. doi: 10.1016/j.comptc.2014.03.034. - DOI
MeSH terms
Substances
LinkOut - more resources
Full Text Sources
Other Literature Sources
Research Materials
Miscellaneous
