

Comprehensive profiling analysis of the N6-methyladenosine-modified circular RNA transcriptome in cultured cells infected with Marek's disease virus
- PMID: 34040106
- PMCID: PMC8155085
- DOI: 10.1038/s41598-021-90548-1
Comprehensive profiling analysis of the N6-methyladenosine-modified circular RNA transcriptome in cultured cells infected with Marek's disease virus
Abstract
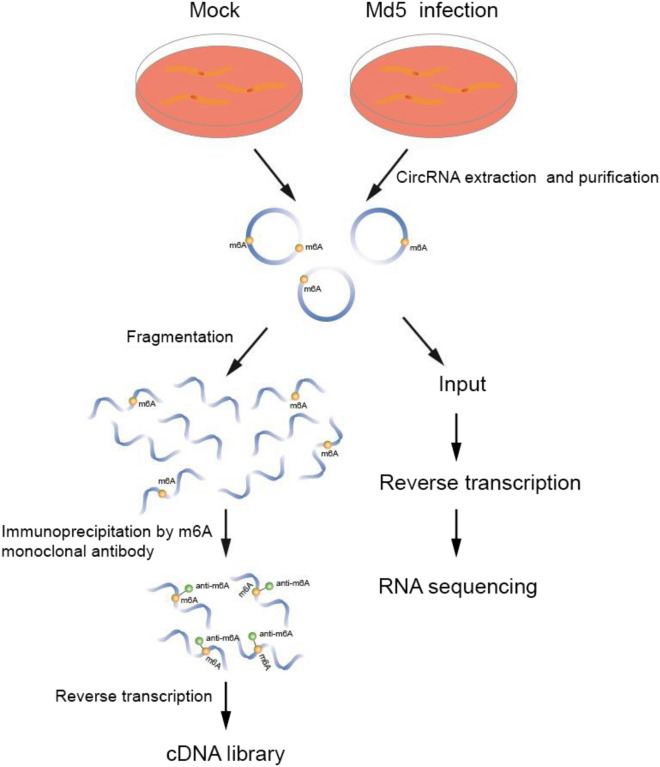
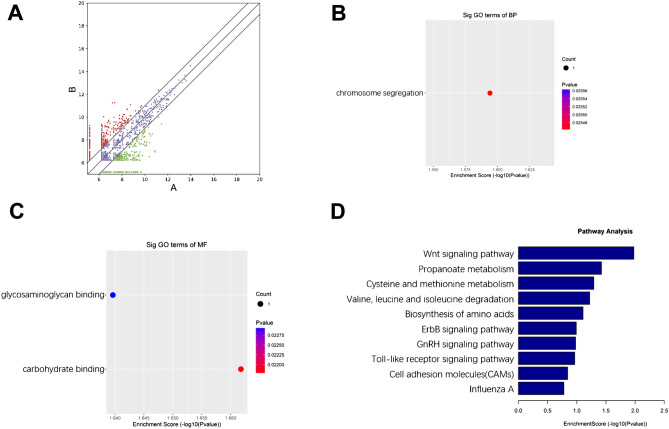
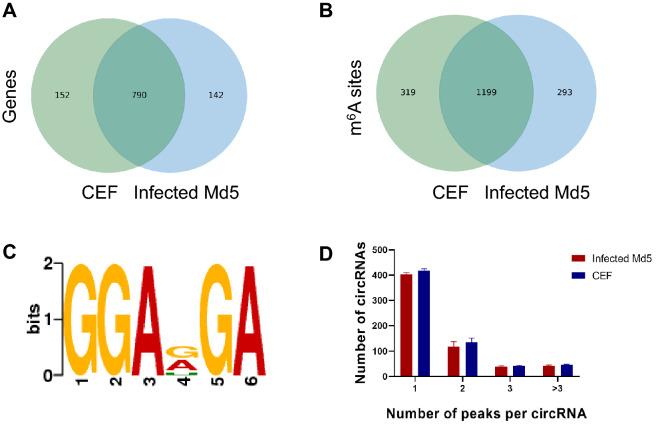
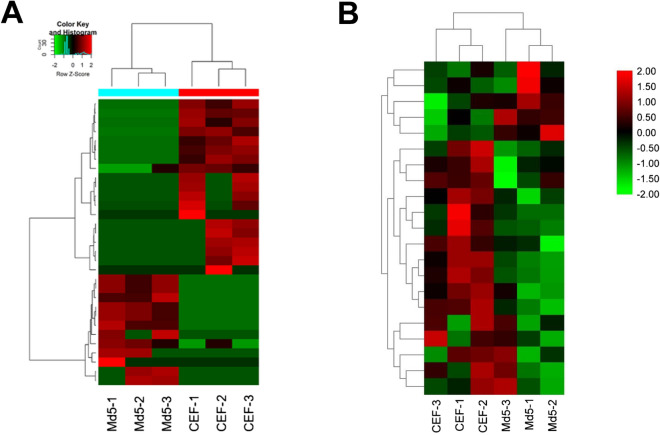
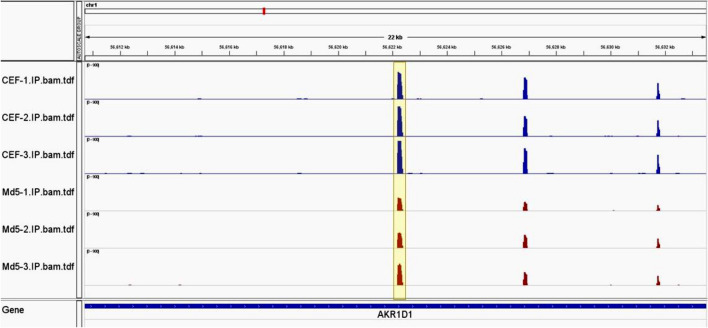
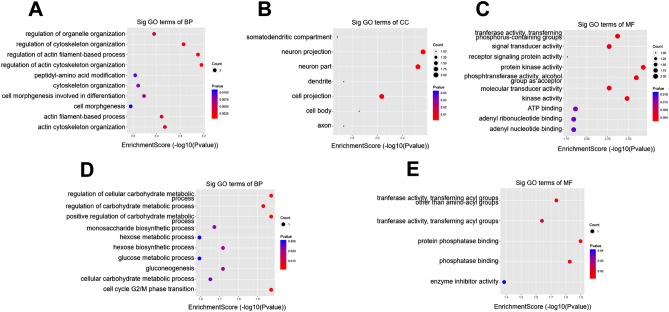
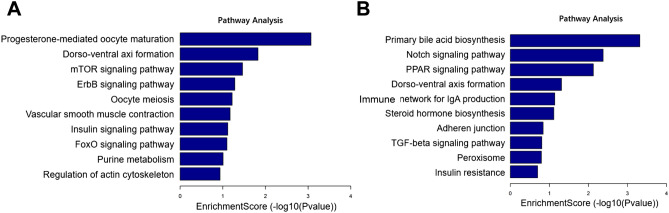
Marek's disease virus (MDV) induces severe immunosuppression and lymphomagenesis in the chicken, its natural host, and results in a condition that investigated the pathogenesis of MDV and have begun to focus on the expression profiling of circular RNAs (circRNAs). However, little is known about how the expression of circRNAs is referred to as Marek's disease. Previous reports have is regulated during MDV replication. Here, we carried out a comprehensive profiling analysis of N6-methyladenosine (m6A) modification on the circRNA transcriptome in infected and uninfected chicken embryonic fibroblast (CEF) cells. Methylated RNA immunoprecipitation sequencing (MeRIP-Seq) revealed that m6A modification was highly conserved in circRNAs. Comparing to the uninfected group, the number of peaks and conserved motifs were not significantly different in cells that were infected with MDV, although reduced abundance of circRNA m6A modifications. However, gene ontology and Kyoto encyclopedia of genes and genomes (KEGG) pathway analyses revealed that the insulin signaling pathway was associated with the regulation of m6A modified circRNAs in MDV infection. This is the first report to describe alterations in the transcriptome-wide profiling of m6A modified circRNAs in MDV-infected CEF cells.
Conflict of interest statement
The authors declare no competing interests.
Figures
Similar articles
-
Transcriptome-wide N6-methyladenosine modification profiling of long non-coding RNAs during replication of Marek's disease virus in vitro.BMC Genomics. 2021 Apr 22;22(1):296. doi: 10.1186/s12864-021-07619-w. BMC Genomics. 2021. PMID: 33888086 Free PMC article.
-
Marek's Disease Virus Virulence Genes Encode Circular RNAs.J Virol. 2022 May 11;96(9):e0032122. doi: 10.1128/jvi.00321-22. Epub 2022 Apr 12. J Virol. 2022. PMID: 35412345 Free PMC article.
-
Genome-wide analysis of circular RNAs involved in Marek's disease tumourigenesis in chickens.RNA Biol. 2020 Apr;17(4):517-527. doi: 10.1080/15476286.2020.1713538. Epub 2020 Jan 17. RNA Biol. 2020. PMID: 31948317 Free PMC article.
-
Marek's disease virus-encoded microRNAs: genomics, expression and function.Sci China Life Sci. 2010 Oct;53(10):1174-80. doi: 10.1007/s11427-010-4073-6. Epub 2010 Oct 17. Sci China Life Sci. 2010. PMID: 20953939 Review.
-
T-cell transformation by Marek's disease virus.Trends Microbiol. 1999 Jan;7(1):22-9. doi: 10.1016/s0966-842x(98)01427-9. Trends Microbiol. 1999. PMID: 10068994 Review.
Cited by
-
Emerging roles of circular RNAs on the regulation of production traits in chicken.Poult Sci. 2025 Jan;104(1):104612. doi: 10.1016/j.psj.2024.104612. Epub 2024 Nov 28. Poult Sci. 2025. PMID: 39647355 Free PMC article. Review.
-
LORF9 of Marek's disease virus is involved in the early cytolytic replication of B lymphocytes and can act as a target for gene deletion vaccine development.J Virol. 2023 Dec 21;97(12):e0157423. doi: 10.1128/jvi.01574-23. Epub 2023 Nov 28. J Virol. 2023. PMID: 38014947 Free PMC article.
-
The hidden RNA code: implications of the RNA epitranscriptome in the context of viral infections.Front Genet. 2023 Aug 1;14:1245683. doi: 10.3389/fgene.2023.1245683. eCollection 2023. Front Genet. 2023. PMID: 37614818 Free PMC article. Review.
-
Rolling-Translated circRUNX2.2 Promotes Lymphoma Cell Proliferation and Cycle Transition in Marek's Disease Model.Int J Mol Sci. 2024 Oct 25;25(21):11486. doi: 10.3390/ijms252111486. Int J Mol Sci. 2024. PMID: 39519039 Free PMC article.
-
M6A transcriptome-wide map of circRNAs identified in the testis of normal and AZ-treated Xenopus laevis.Genes Environ. 2023 Sep 1;45(1):23. doi: 10.1186/s41021-023-00279-0. Genes Environ. 2023. PMID: 37658417 Free PMC article.
References
-
- Schumacher D, Tischer BK, Fuchs W, Osterrieder N. Reconstitution of Marek's disease virus serotype 1 (MDV-1) from DNA cloned as a bacterial artificial chromosome and characterization of a glycoprotein B-negative MDV-1 mutant. J. Virol. 2000;74:11088–11098. doi: 10.1128/jvi.74.23.11088-11098.2000. - DOI - PMC - PubMed
Publication types
MeSH terms
Substances
LinkOut - more resources
Full Text Sources
Other Literature Sources
Molecular Biology Databases
