. 2021 May 26;4(1):630.
doi: 10.1038/s42003-021-02168-0.

The origin of island populations of the African malaria mosquito, Anopheles coluzzii

Affiliations

The origin of island populations of the African malaria mosquito, Anopheles coluzzii

Melina Campos et al. Commun Biol. .

Abstract

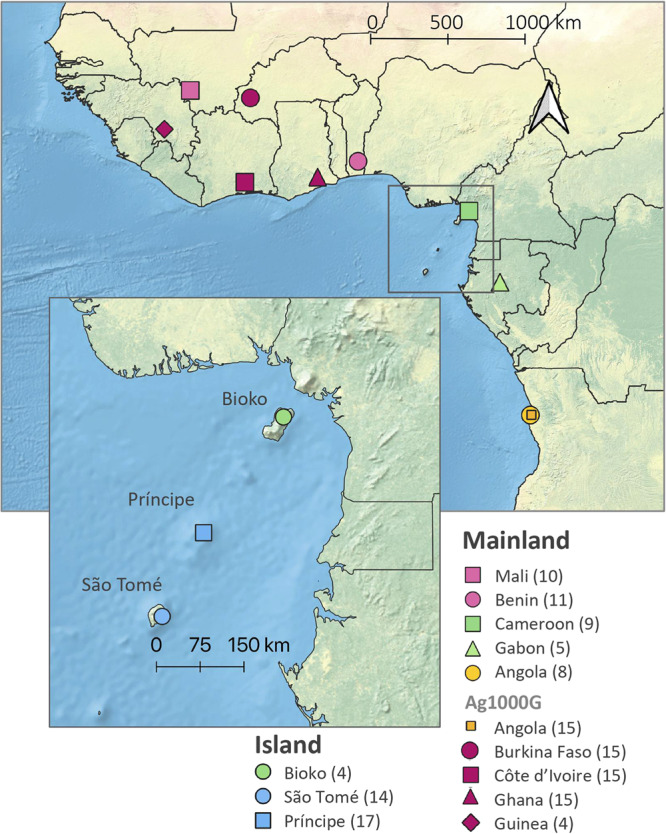
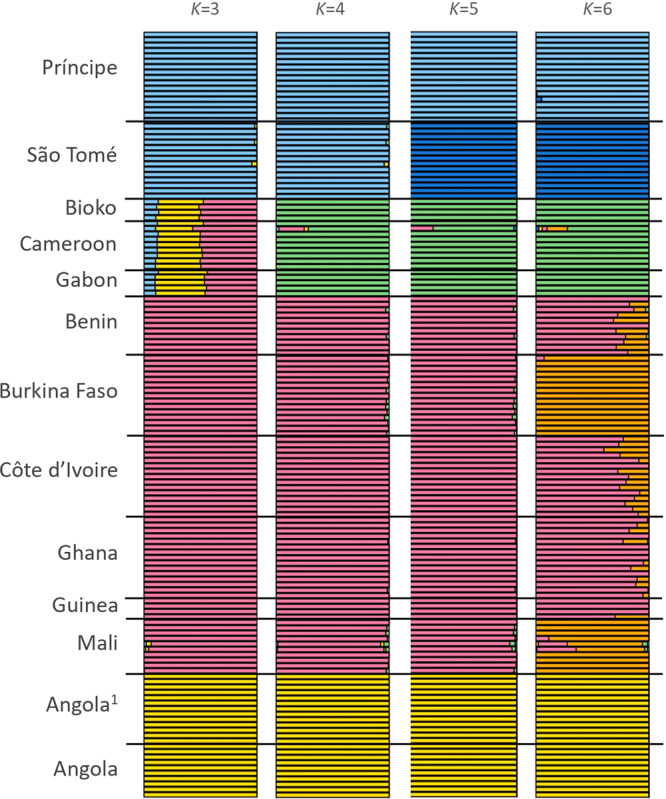
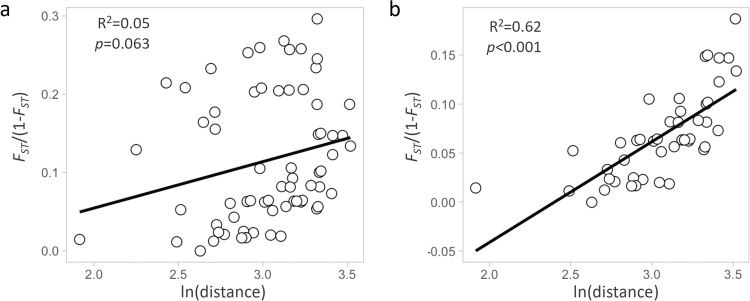
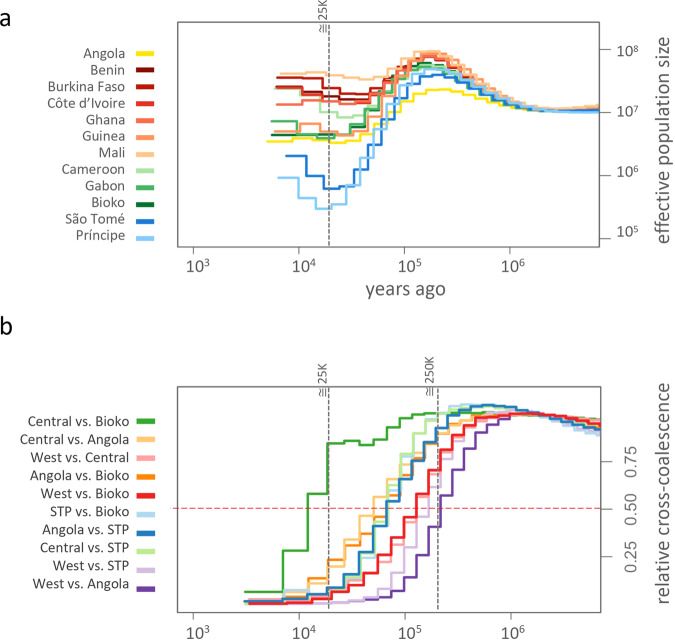
Anopheles coluzzii is a major malaria vector throughout its distribution in west-central Africa. Here we present a whole-genome study of 142 specimens from nine countries in continental Africa and three islands in the Gulf of Guinea. This sample set covers a large part of this species' geographic range. Our population genomic analyses included a description of the structure of mainland populations, island populations, and connectivity between them. Three genetic clusters are identified among mainland populations and genetic distances (FST) fits an isolation-by-distance model. Genomic analyses are applied to estimate the demographic history and ancestry for each island. Taken together with the unique biogeography and history of human occupation for each island, they present a coherent explanation underlying levels of genetic isolation between mainland and island populations. We discuss the relationship of our findings to the suitability of São Tomé and Príncipe islands as candidate sites for potential field trials of genetic-based malaria control strategies.


Conflict of interest statement

The authors declare no competing interests.

Figures

Fig. 1
Fig. 1. Sampling locations.
Samples were collected by us from five countries in continental Africa: Angola (yellow dot), Benin (pink dot), Cameroon (green square), Gabon (green triangle), and Mali (pink square). The insert map of the Gulf of Guinea shows the three islands sampled: Bioko (green dot), São Tomé (blue dot), and Príncipe (blue square). Samples from four additional countries in continental Africa were included from the Ag1000G project (Miles et al., 2017): Burkina Faso (magenta dot), Cote d’Ivoire (magenta square), Ghana (magenta triangle), and Guinea (magenta rhombus); and additional samples from Angola (yellow square). The number of whole genome sequences analysed for each location is displayed in parenthesis. The CleanTOPO2 base map on QGIS was used as background.
Fig. 2
Fig. 2. Principal component analysis.
Plot of first two components of PCA. Analyses were based on 30,000 SNPs on chromosome 3 only. Island and mainland locations in West Africa are as in Fig. 1. Colours highlight the different clusters of mainland populations: Benin and Mali in pink plus Ag1000G populations in dark pink (Burkina Faso, Cote d’Ivoire, Ghana, and Guinea); Cameroon, Gabon, and Bioko in green; and Angola in yellow. São Tomé and Príncipe (STP) are separated from mainland populations by the first PC and between each other by PC2.
Fig. 3
Fig. 3. Bayesian analysis.
Individual ancestry estimation with ADMIXTURE. Analyses were based on three independent replicates of 100,000 SNPs on chromosome 3 only. Samples were grouped by location. The lowest cross-validation error (CV error) value was for K = 3 (see Supplementary Fig. 1). K = 5 reveal similar relationships as those observed in the PCA results.
Fig. 4
Fig. 4. FST analyses.
Pairwise FST between island and mainland locations in West Africa as in Fig. 1. a Heatmap table of pairwise FST, higher values in darker grey. b Boxplot of test of FST median values of all mainland population comparisons (grey) and STP versus mainland populations comparisons (in blue).
Fig. 5
Fig. 5. Isolation-by-distance test.
Regression of genetic distance (FST /(1− FST)) and logarithm of geographic distance. a All population pairwise comparisons. b Except São Tomé and Príncipe populations.
Fig. 6
Fig. 6. Population diversity.
Metrics are grouped by sampling locations. a nucleotide diversity (π; in 20 kb windows) boxplot. b Tajima’s D (in 20 kb windows) boxplot. c Inbreeding statistic F (FIS) boxplot. d Length of runs of homozygosity (FROH) boxplot. For all boxplots, the midline line is the median, with upper and lower limits (75th and 25th percentile, respectively), whiskers show maximum and minimum values and outliers are not shown.
Fig. 7
Fig. 7. Effective population sizes and cross-coalescence estimates.
a Historical effective population sizes for each population. The vertical line at about 25,000 years ago indicates the minimal turning point for the lowest population size. b Relative cross-coalescence (RCC) between island populations and the three genetic clusters found in the mainland: West (Burkina Faso, Benin, Côte d’Ivoire, Ghana, Guinea, and Mali), Central (Cameroon and Gabon), and Angola. The vertical grey line indicates the time point when effective population size was the lowest (top plot) and the first curve of RCC values reached below 0.5 values (red dashed line).

References

    1. Losos JB, Ricklefs RE. Adaptation and diversification on islands. Nature. 2009;457:830–836. doi: 10.1038/nature07893. - DOI - PubMed
    1. MacArthur, R. H. & Wilson, E. O. The Theory of Island Biogeography Princeton University Press (1967).
    1. Frankham, R. Do island populations have less genetic variation than mainland populations? Heredity (Edinb) 78, 311–327 (1997). - PubMed
    1. Scott, T. W., Takken, W., Knols, B. G. & Boëte, C. The ecology of genetically modified mosquitoes. Science298, 117–119 (2002). - PubMed
    1. James, A. A. Gene drive systems in mosquitoes: rules of the road. Trends Parasitol. 21, 64–67(2005). - PubMed

Publication types