. 2021 Jun;594(7864):560-565.
doi: 10.1038/s41586-021-03573-5. Epub 2021 May 26.

MARK4 controls ischaemic heart failure through microtubule detyrosination

Affiliations

MARK4 controls ischaemic heart failure through microtubule detyrosination

Xian Yu et al. Nature. 2021 Jun.

Abstract

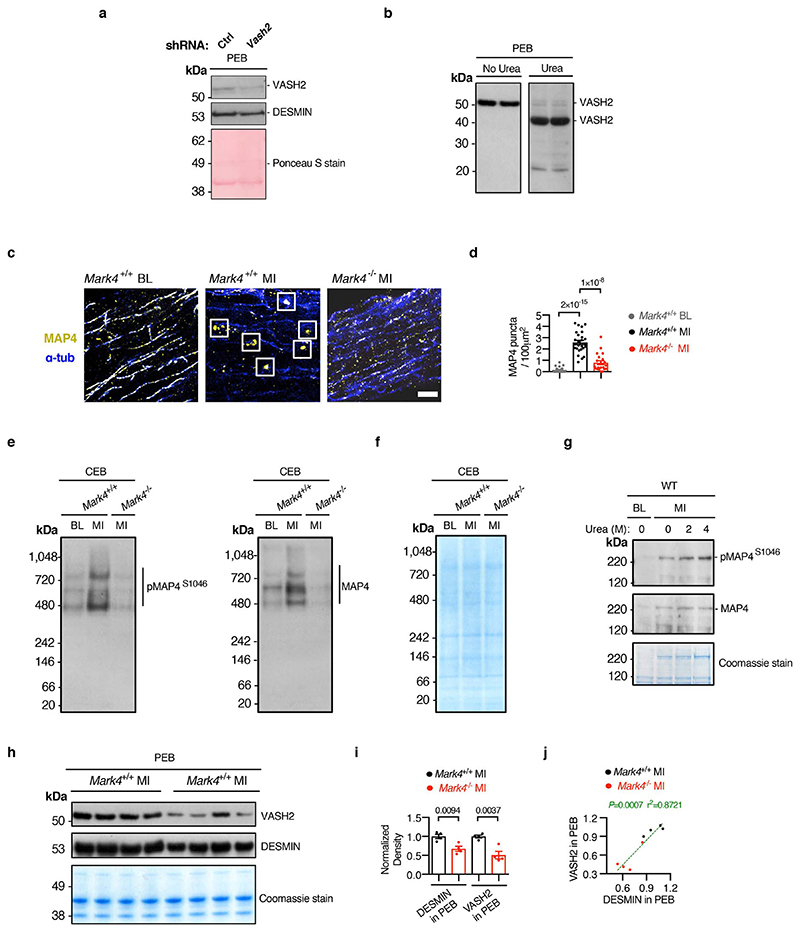
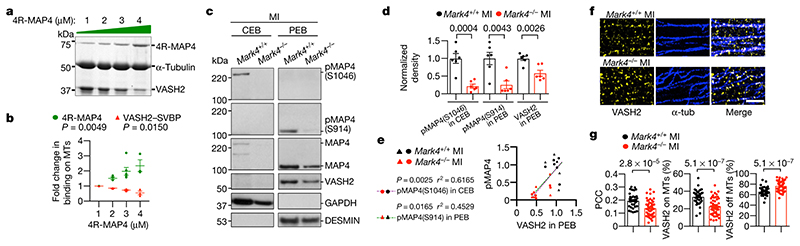
Myocardial infarction is a major cause of premature death in adults. Compromised cardiac function after myocardial infarction leads to chronic heart failure with systemic health complications and a high mortality rate1. Effective therapeutic strategies are needed to improve the recovery of cardiac function after myocardial infarction. More specifically, there is a major unmet need for a new class of drugs that can improve cardiomyocyte contractility, because inotropic therapies that are currently available have been associated with high morbidity and mortality in patients with systolic heart failure2,3 or have shown a very modest reduction of risk of heart failure4. Microtubule detyrosination is emerging as an important mechanism for the regulation of cardiomyocyte contractility5. Here we show that deficiency of microtubule-affinity regulating kinase 4 (MARK4) substantially limits the reduction in the left ventricular ejection fraction after acute myocardial infarction in mice, without affecting infarct size or cardiac remodelling. Mechanistically, we provide evidence that MARK4 regulates cardiomyocyte contractility by promoting phosphorylation of microtubule-associated protein 4 (MAP4), which facilitates the access of vasohibin 2 (VASH2)-a tubulin carboxypeptidase-to microtubules for the detyrosination of α-tubulin. Our results show how the detyrosination of microtubules in cardiomyocytes is finely tuned by MARK4 to regulate cardiac inotropy, and identify MARK4 as a promising therapeutic target for improving cardiac function after myocardial infarction.


Conflict of interest statement

Ethics declarations

Competing interests

The authors declare no competing interests.

Figures

Extended Data Fig. 1
Extended Data Fig. 1. Timeline of experimental design.
a, Timeline of experimental design for Fig. 1d and 1e. Investigation of the effect of total MARK4 deficiency on cardiac function using the model of left anterior descending (LAD) coronary artery ligation model to induce myocardial infarction (MI). Echocardiography (Echo) and histological analysis at the indicated time points. b, Timeline of experimental design for Fig. 2a, 2b, and 2c. Investigation of the effect of total MARK4 deficiency on cardiac function at 24 hours post-MI. Echocardiography, circulating cardiac troponin (cTnI), and histological analyses were performed at the indicated time point. c, Timeline of experimental design for Fig. 2d. Investigation of the effect of MARK4 expression in haematopoietic cells on cardiac function using the LAD ligation model. BM: bone marrow. BMT: bone marrow transplantation. Echocardiography analysis was performed at the indicated time points. d, Timeline of experimental design for Fig. 2e. Investigation of the effect of MARK4 expression in cardiomyocytes on cardiac function using the LAD ligation model. Tm: tamoxifen. Mark4cKO: conditional Mark4 knock-out mice. Echocardiography analysis was performed at the indicated time points.
Extended Data Fig. 2
Extended Data Fig. 2. MARK4 expression, α-tubulin post-translational modifications, and changes in the inflammatory response post-myocardial infarction.
a, Representative confocal images of primary cardiomyocytes (CMs) isolated from Mark4 -/- or control mice at baseline (BL) or at day 3 post-MI (MI), scale bar= 20 μm. b-c, Levels of pro-inflammatory cytokines at day 3 post-MI (n=6 per group) (b). Left ventricular ejection fraction (LVEF) at day 3 post-MI (n=4 per group) (c). d-e, Western blots (WBs) of detyrosinated α-tubulin (dTyr-tub) in cell lysates of CMs isolated from wild-type mice at day 3 post-MI or post-sham surgery (S), with the lysates of the remaining cells from the same hearts used as control. Representative WBs (d). Ratio of dTyr-tubulin over total α-tubulin quantified using western blot data from biologically independent samples (S group: n=4 mice; MI group: n=5 mice) (e). f-g, Western blots of cell lysates from the isolated cardiomyocytes of Mark4 -/- or control mice at day 3 post-MI, to detect detyrosinated α-tubulin (dTyr-tub), polyglutamylated α-tubulin (Polyglu-tub), acetylated α-tubulin (Ace-tub), and a–tubulin (α-tub). Representative images (f). Ratio of dTyr-tub, or polyglu-tub, or ace-tub over total α-tubulin quantified using western blot data from biologically independent samples (n=3 mice per group) (g). The box bounds represent the 25th and 75th percentiles, the middle line shows the median, and the whiskers show the minimum and maximum (b). Mean±s.e.m.; two-tailed unpaired t-test (c, e, g). P values are indicated on the graphs.
Extended Data Fig. 3
Extended Data Fig. 3. Validation of the murine models for MARK4 selective expression in either haematopoietic cells or cardiomyocytes.
a-b, Confirmation of MARK4 deficiency in CD45+ cells of chimeric wild-type mice reconstituted with bone marrow (BM) cells from Mark4 -/- mice(strategy in Extended Data Fig.1c). Representative image with arrows pointing to CD45+ cells in the infarct area, scale bar= 20 μm (a). Quantification of percentage of MARK4 positive cells (green) within CD45+ cells (red) (n=3 mice per group) (b). c, Confirmation of Mark4 deletion in cardiomyocytes (strategy in Extended Data Fig.1d). Real-time PCR of Mark4 level from primary cardiomyocytes isolated from aMHC-mcm+/-;Mark4fl/fl (n=4) and control mice (n=3) at day 7 post the last tamoxifen injection. d-e, Assessment of left ventricular ejection fraction (LVEF) of a different batch (from Fig. 2e) of conditional Mark4 deficiency in cardiomyocytes (Mark4cKO) and control mice (n=6 per group) at day 1 post-myocardial infarction (MI) (d). Infarct size at 24 hours post-myocardial infarction (scale bar=2mm) (e). Mean±s.e.m.; two-tailed unpaired t-test (b, c, d, e). P values are indicated on the graphs.
Extended Data Fig. 4
Extended Data Fig. 4. The effect of MARK4 deficiency on sarcomere length, peak shortening, velocity, and calcium transients in cardiomyocytes before and after myocardial infarction.
a-f, Contractility assay of single primary cardiomyocytes (CMs) isolated at baseline (BL) or at day 3 post-myocardial infarction (MI) from the following groups: Mark4 +/+ BL (n=4 mice / n=45 CMs examined over 4 independent experiments), Mark4 -/- BL (n=3 mice / n=45 CMs examined over 3 independent experiments), Mark4 +/+ MI (n=5 mice / n=54 CMs examined over 5 independent experiments), and Mark4 -/- MI (n=6 independent mice / n=57 CMs examined over 6 independent experiments). Colour denotation of samples (a). Resting sarcomere length (SL) (b). Average sarcomere shortening traces were compared (c-d). Average velocity traces (dSL/dT) (e-f). g-m, Calcium influx assay on single CMs isolated from Mark4 -/- or control mice at baseline or at day 3 post- MI in the following groups: Mark4 +/+ BL group (n=2 mice / n=34 CMs examined over 2 independent experiments), Mark4 -/- BL groups (n=2 mice / n=33 CMs examined over 2 independent experiments), Mark4 +/+ MI group (n=4 mice / n=65 CMs examined over 4 independent experiments), Mark4 -/- MI groups (n=3 mice / n=58 CMs examined over 3 independent experiments). Basal Ca2+ level (g). Amplitude level of Ca2+ transient (h). Ca2+ release speed during contraction (i). Ca2+ reuptake speed during contraction (j). Ca2+ elevation time (k). Ca2+ reuptake time (l). Traces of Ca2+ kinetic curves (m). The box bounds represent the 25th and 75th percentiles, the middle line shows the median, and the whiskers show the minimum and maximum (b, g-l). Mean ± s.e.m.; two-way ANOVA with Bonferroni post-hoc correction for multiple comparisons (b, g-l). P values are indicated on the graphs.
Extended Data Fig. 5
Extended Data Fig. 5. The effect of TTL overexpression, or PTL treatment, on contractility of Mark4 -/- cardiomyocytes after myocardial infarction.
a-i, Adenovirus (Adv)-mediated overexpression (o.e.) of Tubulin Tyrosine Ligase (TTL) in cardiomyocytes isolated from Mark4 -/- or control Mark4 +/+ mice at day 3 post-myocardial infarction (MI), with o.e. of a null as control (Ctrl). Representative western blot (a). Contractility assay of single CMs with o.e. in the following groups: Mark4 +/+ MI Adv-Null (n=3 mice/n=75 CMs examined over 3 independent experiments), Mark4 +/+ MI Adv-TTL (n=3 mice / n=69 CMs examined over 3 independent experiments), Mark4 -/- MI Adv-Null (n=3 mice / n=74 CMs examined over 3 independent experiments), and Mark4 -/- MI Adv-TTL (n=3 mice / n= 73 CMs examined over 3 independent experiments). Colour denotation of samples (b). Resting sarcomere length (SL) (c). Average sarcomere shortening traces (d-f). Average velocity traces (dSL/dT) (g-i). j-s, Contractility assay of single CMs isolated at day 3 post-MI with the following treatments: Mark4 +/+ MI DMSO (n=3 mice / n=46 CMs examined over 3 independent experiments), Mark4 +/+ MI PTL ( n=3 mice / n=67 CMs examined over 3 independent experiments), Mark4 -/- MI DMSO (n=3 mice / n=55 CMs examined over 3 independent experiments), and Mark4 -/- MI PTL (n=3 mice / n=64 CMs examined over 3 independent experiments). Color denotation of samples (j). Resting sarcomere length (k). Sarcomere peak shortening (l). Average sarcomere shortening traces (m-o). Pooled data of contraction velocity and relaxation velocity (p). Average velocity traces (dSL/dT) (q-s). The box bounds represent the 25th and 75th percentiles, the middle line shows the median, and the whiskers show the minimum and maximum (c, k, l, p). Mean±s.e.m.; two-way ANOVA test with Bonferroni post-hoc correction for multiple comparisons (c, k, l, p). P values are indicated on the graphs.
Extended Data Fig. 6
Extended Data Fig. 6. The association of MAP4 or VASH2 with the polymerized microtubules.
a, Protein sequence alignment between human MAP4 (NP002366) and mouse MAP4 (NP001192259). KXGS motifs (highlighted with red frames) within the tubulin binding repeats (highlighted with yellow, brown, dark brown, and purple frame) of MAP4 are MARK4 substrate sites. S941 of human MAP4 (S914 of mouse MAP4) and S1073 of human MAP4 (S1046 of mouse MAP4) are conserved phosphorylation sites within KXGS motifs. b, Schematic illustration of possible association between MAP4 and microtubules pre- or post- MARK4-dependent phosphorylation. Non-phosphorylated MAP4 binds to microtubules. Upon MARK4-dependent phosphorylation of mS914 at the microtubule weak binding site, MAP4 makes allosteric changes. Upon MARK4-dependent phosphorylation of mS1046 at the microtubule anchor site, MAP4 detaches from microtubules. c-d, Representative gel image of 4R-MAP4 (1-4 μM) binding to the polymerized microtubules (MTs) (5 μM) in a microtubule co-sedimentation assay (c). Quantification of the binding (d). n=7 samples examined over 3 independent experiments (1 μM); n=4 samples examined over 3 independent experiments (2 μM); n=6 samples examined over 3 independent experiments (3 μM); n=3 samples examined over 3 independent experiments (4 μM). e-f, Representative gel image of VASH2/SVBP (0.5-2 μM) binding to the polymerized MTs (2.5 μM) in a microtubule co-sedimentation assay (e). Quantification of the binding (f). n=7 samples examined over 5 independent experiments (0.5 μM); n=7 samples examined over 5 independent experiments (1 μM); n=4 samples examined over 3 independent experiments (1.5 μM); n=4 samples examined over 3 independent experiments (2 μM). Mean±s.e.m.; one-way ANOVA test (d, f). P values are indicated on the graphs.
Extended Data Fig. 7
Extended Data Fig. 7. Association of VASH2 with cardiomyocyte microtubules pre- and post-myocardial infarction, and impact of MAP4 knock-down.
a, Subcellular fractionation on primary cardiomyocytes (CMs) isolated from mice at baseline (BL) or post-myocardial infarction (MI). Western blotting (WB) of the fractions from cytosolic extraction buffer (CEB) or pellet extraction buffer (PEB). b, Representative WBs of F1 (free tubulin fraction) and F2 (extraction from the stable pellet fraction) fractions obtained from a conventional fractionation method. c-e, WBs of CEB or PEB fractions of wild-type (WT) CMs at baseline, or post-MI. Representative WBs (derived from the same experiment) (c). Quantification of pMAP4S1046 in CEB, pMAP4S914 in PEB, and VASH2 levels in PEB (n=5 mice at BL, n=6 mice post-MI, blots were processed in parallel) (d). Correlation between VASH2 level in the PEB fraction and phosphorylated MAP4 (pMAP4) levels (e). f-i, WT post-MI CMs transduced with adenovirus (Adv)-mediated shRNA Map4, or control (Ctrl). Representative WBs of CEB fraction or PEB fraction, and Coomassie stained gels loaded with the same amounts of proteins (f). Quantification of VASH2 levels in PEB (n=3 mice examined over 3 experiments per group) (g). (h-i), STED images of VASH2 and α-tubulin (α-tub) in the cardiomyocytes after knocking down MAP4. Representative images, scale bar=2 μm (h). Pearson Correlation Coefficient (PCC) of VASH2 and α-tubulin (α-tub) signals. percentage (%) of VASH2 signals on the polymerized microtubules (MTs), and percentage of VASH2 signals off the polymerized MTs, in the following groups (i): shRNA Ctrl (n=2 mice / n=35 CMs examined over 2 independent experiments), and shRNA Map4 (n=2 mice / n=27 CMs examined over 2 independent experiments ). Mean±s.e.m.; two-tailed unpaired t-test (d, g, i); two-tailed correlation test (e). P values are indicated on the graphs.
Extended Data Fig. 8
Extended Data Fig. 8. The status of VASH2 and MAP4 in cardiomyocytes pre- and post-myocardial infarction.
a, Subcellular fractionation on wild-type (WT) cardiomyocytes (CMs), isolated from mice post-myocardial infarction (MI) and transduced with adenovirus-mediated shRNA Vash2 or control (Ctrl). Representative western blots (WBs) of fraction in pellet extraction buffer (PEB), with the same membrane stained with Ponceau S. b, Representative WB of PEB extractions denatured in the presence of urea (or not), from post-MI CMs. c-d, STED images of MAP4 and α-tubulin (α-tub) in CMs of Mark4 -/- or control mice at baseline (BL) or post-MI. Oligomerized puncta are indicated within the square frames. Representative images, scale bar=2 μm (c). Quantification of the presence of the MAP4 oligomerized puncta in the following groups (d): Mark4 +/+ BL (n= 2 mice / n= 22 CMs examined over 2 independent experiments), Mark4 +/+ MI (n=2 mice / n=26 CMs examined over 2 independent experiments), and Mark4 -/- MI (n=2 mice / n=21 CMs examined over 2 independent experiments). e-g, WB of native gels loaded with samples in cytosolic extraction buffer (CEB) of CMs isolated at baseline (BL) or post-MI. The presence of pMAP4S1046 and total MAP4 is indicated (e). Coomassie stained native gel loaded with the same amounts of proteins as used in e (f). WB of CEB fraction denatured in the presence of urea, with Coomassie stained denaturing gel loaded with the same amounts of protein (g). h-j, WB of fractions in PEB, of CMs isolated from Mark4 -/- or control mice post-MI, with Coomassie stained gel loaded with the same amounts of proteins (h). Quantification of VASH2 and DESMIN levels in PEB fraction (n= 4 mice per group) (i). Correlation between DESMIN and VASH2 levels in PEB (j). Mean±s.e.m.; two-tailed unpaired t-test (d, i); two-tailed correlation test (j). P values are indicated on the graphs.
Extended Data Fig. 9
Extended Data Fig. 9. MARK4 overexpression regulates MAP4 phosphorylation, and presence of MAP4 oligomers in the cytosolic fraction.
a-c, Subcellular fractionation on wild-type cardiomyocytes (CMs) transduced with adenovirus to overexpress (o.e.) Mark4 or a null control (Ctrl). Representative western blots (WBs) of fractions in cytosolic extraction buffer (CEB) or pellet extraction buffer (PEB) (derived from the same experiment) (a). Quantification of pMAP4S1046 in CEB, and VASH2 level in PEB (n=5 mice per group, blots were processed in parallel) (b). Correlation between VASH2 level in the PEB fraction and phosphorylated MAP4 (pMAP4) levels (c). d-e, STED images of MAP4 and α-tubulin (α-tub) in wild-type baseline CMs transduced with adenovirus to overexpress Mark4 or a null control. Representative images, scale bar=2 μm (d). Quantification of MAP4 oligomerized puncta in the following groups (e): o.e. Ctrl (n=2 mice / n=20 CMs examined over 2 independent experiments), and o.e. Mark4 (n= 2 mice / n= 24 CMs examined over 2 independent experiments). Mean ± s.e.m.; two-tailed unpaired t-test (d, e); two-tailed correlation test (c). P values are indicated on the graphs.
Extended Data Fig. 10
Extended Data Fig. 10. VASH2 status in cardiomyocytes pre- and post-myocardial infarction, and the schematic summary of the results.
a-b, STED images of VASH2 and α-tubulin (α-tub) in wild-type (WT) cardiomyocytes (CMs) at baseline (BL) or post-myocardial infarction (MI). Representative images, scale bar=2 μm (a). Pearson Correlation Coefficient (PCC) of VASH2 and α-tub signals, percentage (%) of VASH2 signals on the polymerized microtubules (MTs), and percentage of VASH2 signals off the MTs, in the following groups (b): WT BL (n=4 mice / n=38 CMs examined over 2 independent experiments), and WT MI (n=38 CMs of n=6 mice / n=38 CMs examined over 3 independent experiments). c, Real-time PCR on post-MI CMs, from the following groups: Mark4 +/+ MI (n= 5 mice), and Mark4 -/- MI (n=6 mice). d, Quantification of VASH2 mean fluorescence intensity (MFI) within cell area (region of interest, ROI) using the STED images from the following groups: Mark4 +/+ MI (n=6 mice / n= 38 CMs examined over 3 independent experiments), and Mark4 -/- MI (n= 6 mice/ n= 47 CMs examined over 3 independent experiments). Mean ± s.e.m.; two-tailed unpaired t-test (b, c, d). P values are indicated on the graphs. e, A working model for MARK4-dependent regulation of microtubule detyrosination after MI: Upon ischaemic injury, increased MARK4 phosphorylates MAP4 at its KXGS motifs. Phosphorylated MAP4 either changes its conformation on the polymerized microtubules, or detaches itself from the polymerized microtubules to form oligomerized MAP4 structures in the cytosol. The phosphorylation of MAP4 by MARK4 allows for space access of VASH2 to the polymerized microtubules, thereby promoting α-tubulin detyrosination. As a consequence, the increased level of detyrosinated microtubules causes a reduction in contractile function of the cardiomyocyte.
Fig. 1
Fig. 1. MARK4 deficiency preserves cardiac function after myocardial infarction without altering scar size.
a, Real-time PCR of wild-type (WT) heart samples. Baseline (BL): heart without myocardial infarction (MI). D1, D3, D5, D7: hearts at the relevant days post-MI. n=5 at baseline, n=6 mice per time point at D1, D3 and D5 post-MI, and n=5 mice at D7 post-MI. b, Western blots of wild-type hearts post-MI. MARK4 in the insoluble (Ins.) cytoskeletal fractions (with DESMIN as marker), and GAPDH in corresponding soluble (S.) cytosolic fractions are shown. n=3 mice at each time point. c, Representative immunohistochemical staining of MARK4 in wild-type mice at baseline or post-MI. Isotype IgG was used as control. Scale bar=50μm. d-e, Assessment of left ventricular ejection fraction (LVEF) in Mark4 -/- mice (n=7) and their littermate controls (Mark4 +/+) (n=7) at baseline, and at week 1 (W1), week 2 (W2), and week 4 (W4) post-MI (d). Scar size at week 4 post-MI (scale bar=2mm) (e). Mean ± s.e.m.; one-way ANOVA test with Bonferroni post-hoc correction (a); two-way ANOVA with Bonferroni post-hoc correction for multiple comparisons (d); two-tailed unpaired t-test (e). P values are indicated on the graphs.
Fig. 2
Fig. 2. MARK4 expression in cardiomyocytes regulates cardiac contractile function after myocardial infarction.
a-c, Mark4 -/- mice (n=5) and their littermate controls (Mark4 +/+, n=5) at day 1 post-myocardial infarction (MI). Left ventricular ejection fraction (LVEF) (a). Circulating cardiac troponin I (cTnI) levels (b) and infarct size (scale bar=2mm) (c) at 24 hours (D1) post-MI are shown. cTnI measurements at Baseline (BL) were used as controls. d, Assessment of LVEF in chimeric mice (n=8 wild-type recipients of Mark4 +/+ bone marrow (BM) donors; n=6 wild-type recipients of Mark4 -/- BM donors) at the indicated time points. e, Assessment of LVEF in conditional Mark4 deficiency in aMHC-mcm+/-;Mark4fl/fl mice (n=6), with conditional Mark4 deficiency induced by tamoxifen (Tm), at the indicated time points. Tamoxifen-injected littermate mice, aMHC-mcm +/- and Mark4fl/fl, were used as controls (n=6). f-n, Contractility assay of single primary cardiomyocytes (CMs) isolated at baseline (BL) or at day 3 post-MI in the following groups: Mark4 +/+ BL (n=4 mice / n=45 CMs examined over 4 independent experiments), Mark4 -/- BL (n=3 mice / n=45 CMs examined over 3 independent experiments), Mark4 +/+ MI (n=5 mice / n=54 CMs examined over 5 independent experiments), and Mark4 -/- MI (n=6 mice / n=57 CMs examined over 6 independent experiments). Colour denotation of samples (f). Correlation between LVEF (measured at day 1 post-MI) and sarcomere peak shortening (g). Sarcomere peak shortening (h). Pooled data of contraction velocity (i) and relaxation (j) velocity. Violin plots lines at the median and quartiles (h-j). Mean ± s.e.m.; two-tailed unpaired t-test (a, b, c); two-way ANOVA with Bonferroni post-hoc correction for multiple comparisons (d, e, h, i, j). P values are indicated on the graphs.
Fig. 3
Fig. 3. MARK4 regulates cardiomyocyte contractility by promoting microtubule detyrosination.
a-d, Western blots (WBs) of whole heart extraction from mice at day 3 post-myocardial infarction (MI), in soluble (S.) and insoluble (Ins.) fractions. dTyr-tub: detyrosinated α-tubulin. α-tub: α-tubulin. Representative WBs (a). Ratio of dTyr-tubulin over total α-tubulin in the following groups: Mark4 +/+ MI soluble (n=20), Mark4 -/- MI soluble (n=17), Mark4 +/+ MI insoluble (n=8), and Mark4 -/- MI insoluble (n=8) (b). Ratio of α-tub in the soluble fraction over α-tub in the insoluble fraction (n=8 mice per group) (c). Correlation between left ventricular ejection fraction (LVEF) and ratio of dTyr-tubulin/α-tub, in Mark4 -/- (n=9) and control mice (n=12) (d). e-g, Confocal images of the isolated cardiomyocytes (CMs) at day 3 post-MI. Representative images, scale bar= 20 μm (e). Percentage (%) of dTyr-tub or total α-tub area per cell (f), and ratio of dTyr-tub/total α-tub (n=3 mice / n=15 CMs per group) (g). h-q, Adenovirus (Adv)-mediated overexpression (o.e.) of TTL in primary cardiomyocytes isolated from Mark4 -/- or control mice at day 3 post-MI, with o.e. of a null as controls (Ctrl). Contractility assay of single CMs in the following groups: Mark4 +/+ MI Adv-Null (n=3 mice / n=75 CMs examined over 3 independent experiments), Mark4 +/+ MI Adv-TTL (n=3 mice / n=69 CMs examined over 3 independent experiments), Mark4 -/- MI Adv-Null (n=3 mice / n=74 CMs examined over 3 independent experiments), and Mark4 -/- MI Adv-TTL (n=3 mice / n= 73 CMs examined over 3 independent experiments). Colour denotation of samples (h). Sarcomere peak shortening (i). Pooled data of contraction (j) and relaxation (k) velocity. Violin plots lines at the median and quartiles (i-k). Mean ± s.e.m.; two-tailed unpaired t-test (b, c, f, g); two-tailed correlation test (d); two-way ANOVA with Bonferroni post-hoc correction for multiple comparisons (i, j, k). P values are indicated on the graphs.
Fig. 4
Fig. 4. MARK4 controls microtubule detyrosination through MAP4 phosphorylation to facilitate VASH2 access to microtubules.
a-b, Representative gel image of VASH2/SVBP (3 μM) binding to polymerized microtubules (MTs) (5 μM) in the presence of different amounts of 4R-MAP4 (1-4 μM) in a microtubule co-sedimentation assay (a). Quantification of the binding (b). n=3 independent experiments per group. c-e, Subcellular fractionations on Mark4 -/- or control cardiomyocytes (CMs) isolated post-myocardial infarction (MI). Representative western blots of the fractions from cytosolic extraction buffer (CEB) or pellet extraction buffer (PEB) derived from the same experiment (c). Quantification of pMAP4S1046 in CEB, pMAP4S914 in PEB, and VASH2 level in PEB (n=6 mice per group, blots were processed in parallel) (d). Correlation between VASH2 level in the PEB fraction and phosphorylated MAP4 (pMAP4) levels (e). f-g, STED images of VASH2 and α-tubulin (α-tub) in Mark4 -/- or control CMs isolated from mice post-MI. Representative images, scale bar=2 μm (f). Pearson Correlation Coefficient (PCC) of VASH2 and α-tubulin signals, percentage (%) of VASH2 signals on the polymerized MTs, and percentage of VASH2 signals off the polymerized MTs, in Mark4 +/+ MI group (n=6 mice / n=38 CMs examined over 3 independent experiments), and data of Mark4 -/- MI group (n=6 mice / n=47 CMs examined over 3 independent experiments) (g). Mean ± s.e.m.; one-way ANOVA test (b); two-tailed unpaired t-test (d, g); two-tailed correlation test (e). P values are indicated on the graphs.

References

    1. Murray CJ, Lopez AD. Measuring the global burden of disease. N Engl J Med. 2013;369:448–457. - PubMed
    1. Packer M, et al. Effect of oral milrinone on mortality in severe chronic heart failure. The PROMISE Study Research Group. N Engl J Med. 1991;325:1468–1475. - PubMed
    1. Cohn JN, et al. A dose-dependent increase in mortality with vesnarinone among patients with severe heart failure. Vesnarinone Trial Investigators. N Engl J Med. 1998;339:1810–1816. - PubMed
    1. Teerlink JR, et al. Cardiac Myosin Activation with Omecamtiv Mecarbil in Systolic Heart Failure. N Engl J Med. 2021;384:105–116. - PubMed
    1. Robison P, et al. Detyrosinated microtubules buckle and bear load in contracting cardiomyocytes. Science. 2016;352:aaf0659. - PMC - PubMed

Publication types