. 2021 Jul;595(7869):735-740.
doi: 10.1038/s41586-021-03577-1. Epub 2021 May 26.

Enhancer release and retargeting activates disease-susceptibility genes

Affiliations

Enhancer release and retargeting activates disease-susceptibility genes

Soohwan Oh et al. Nature. 2021 Jul.

Abstract

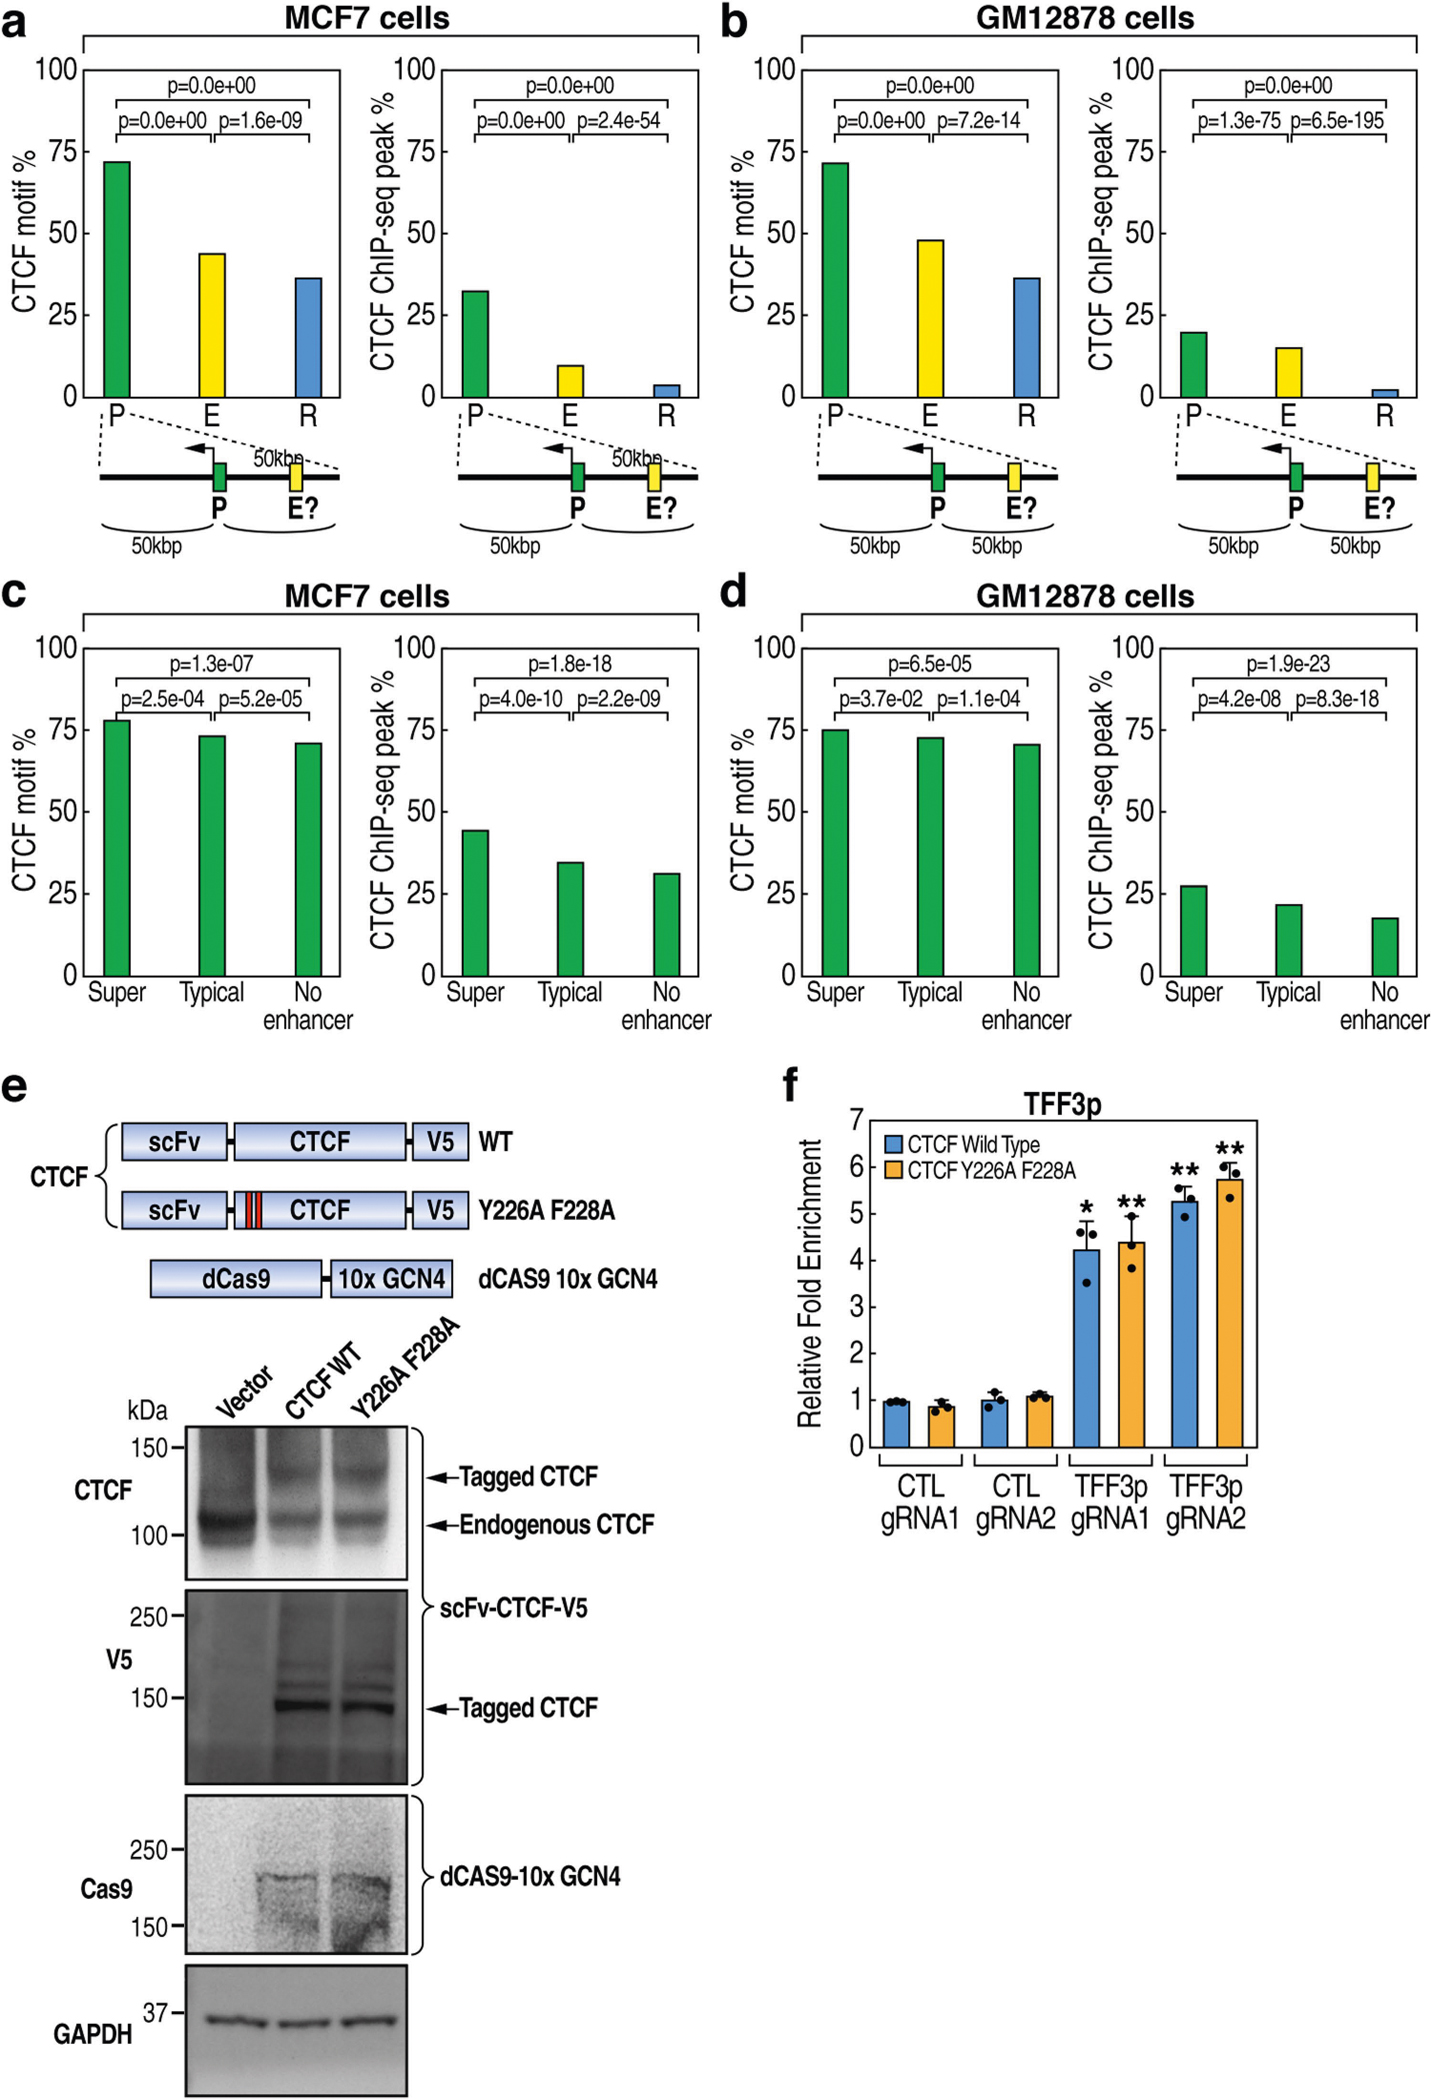
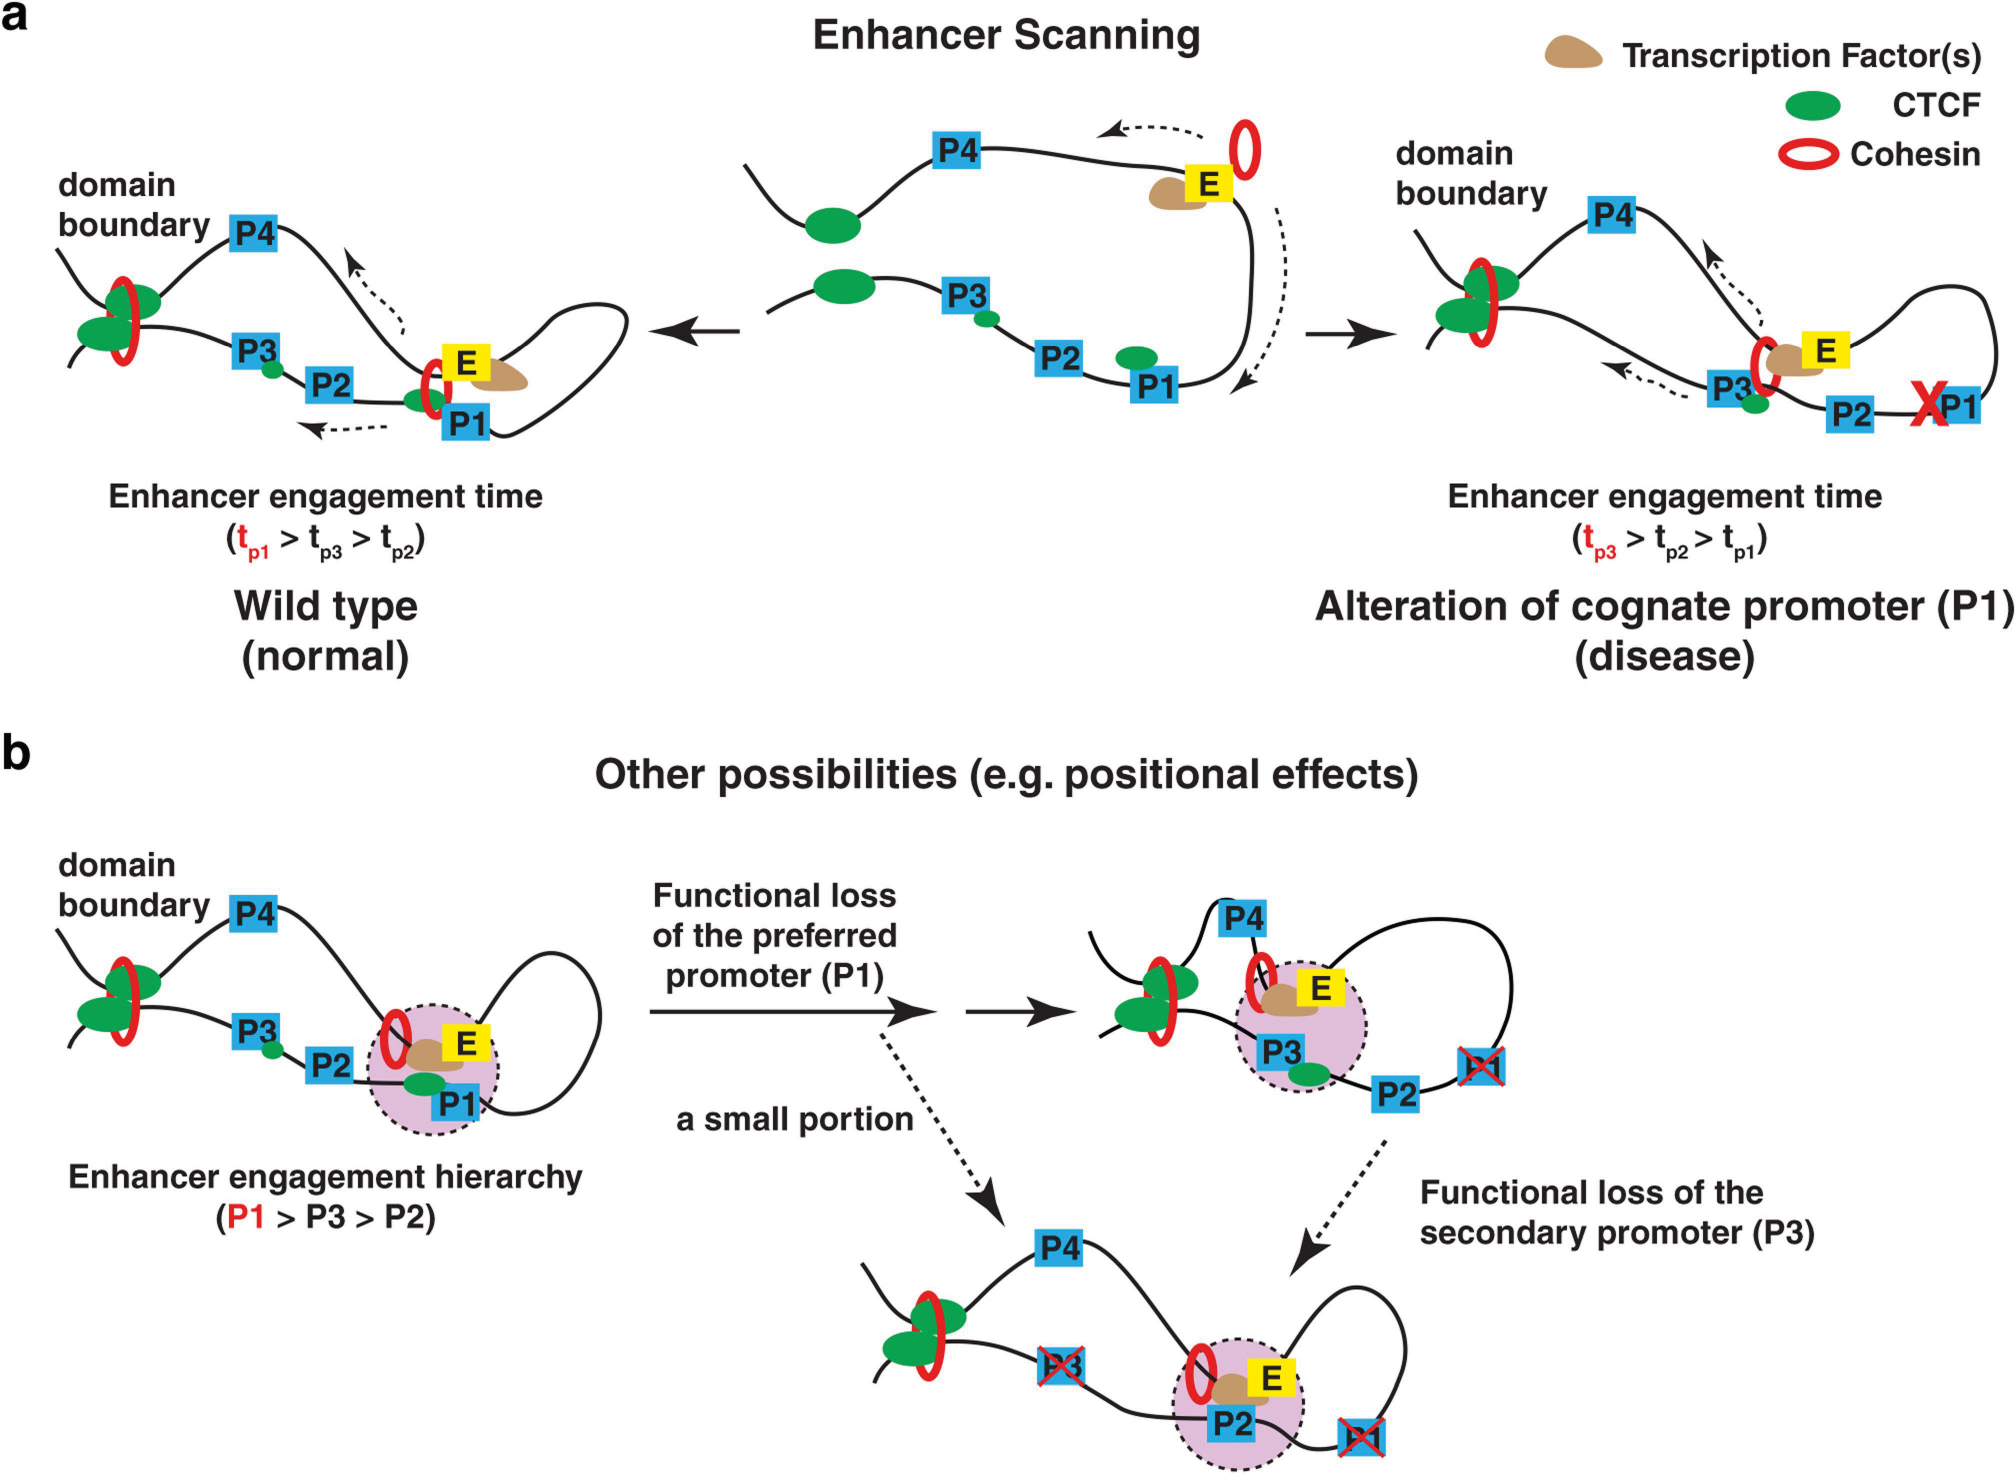
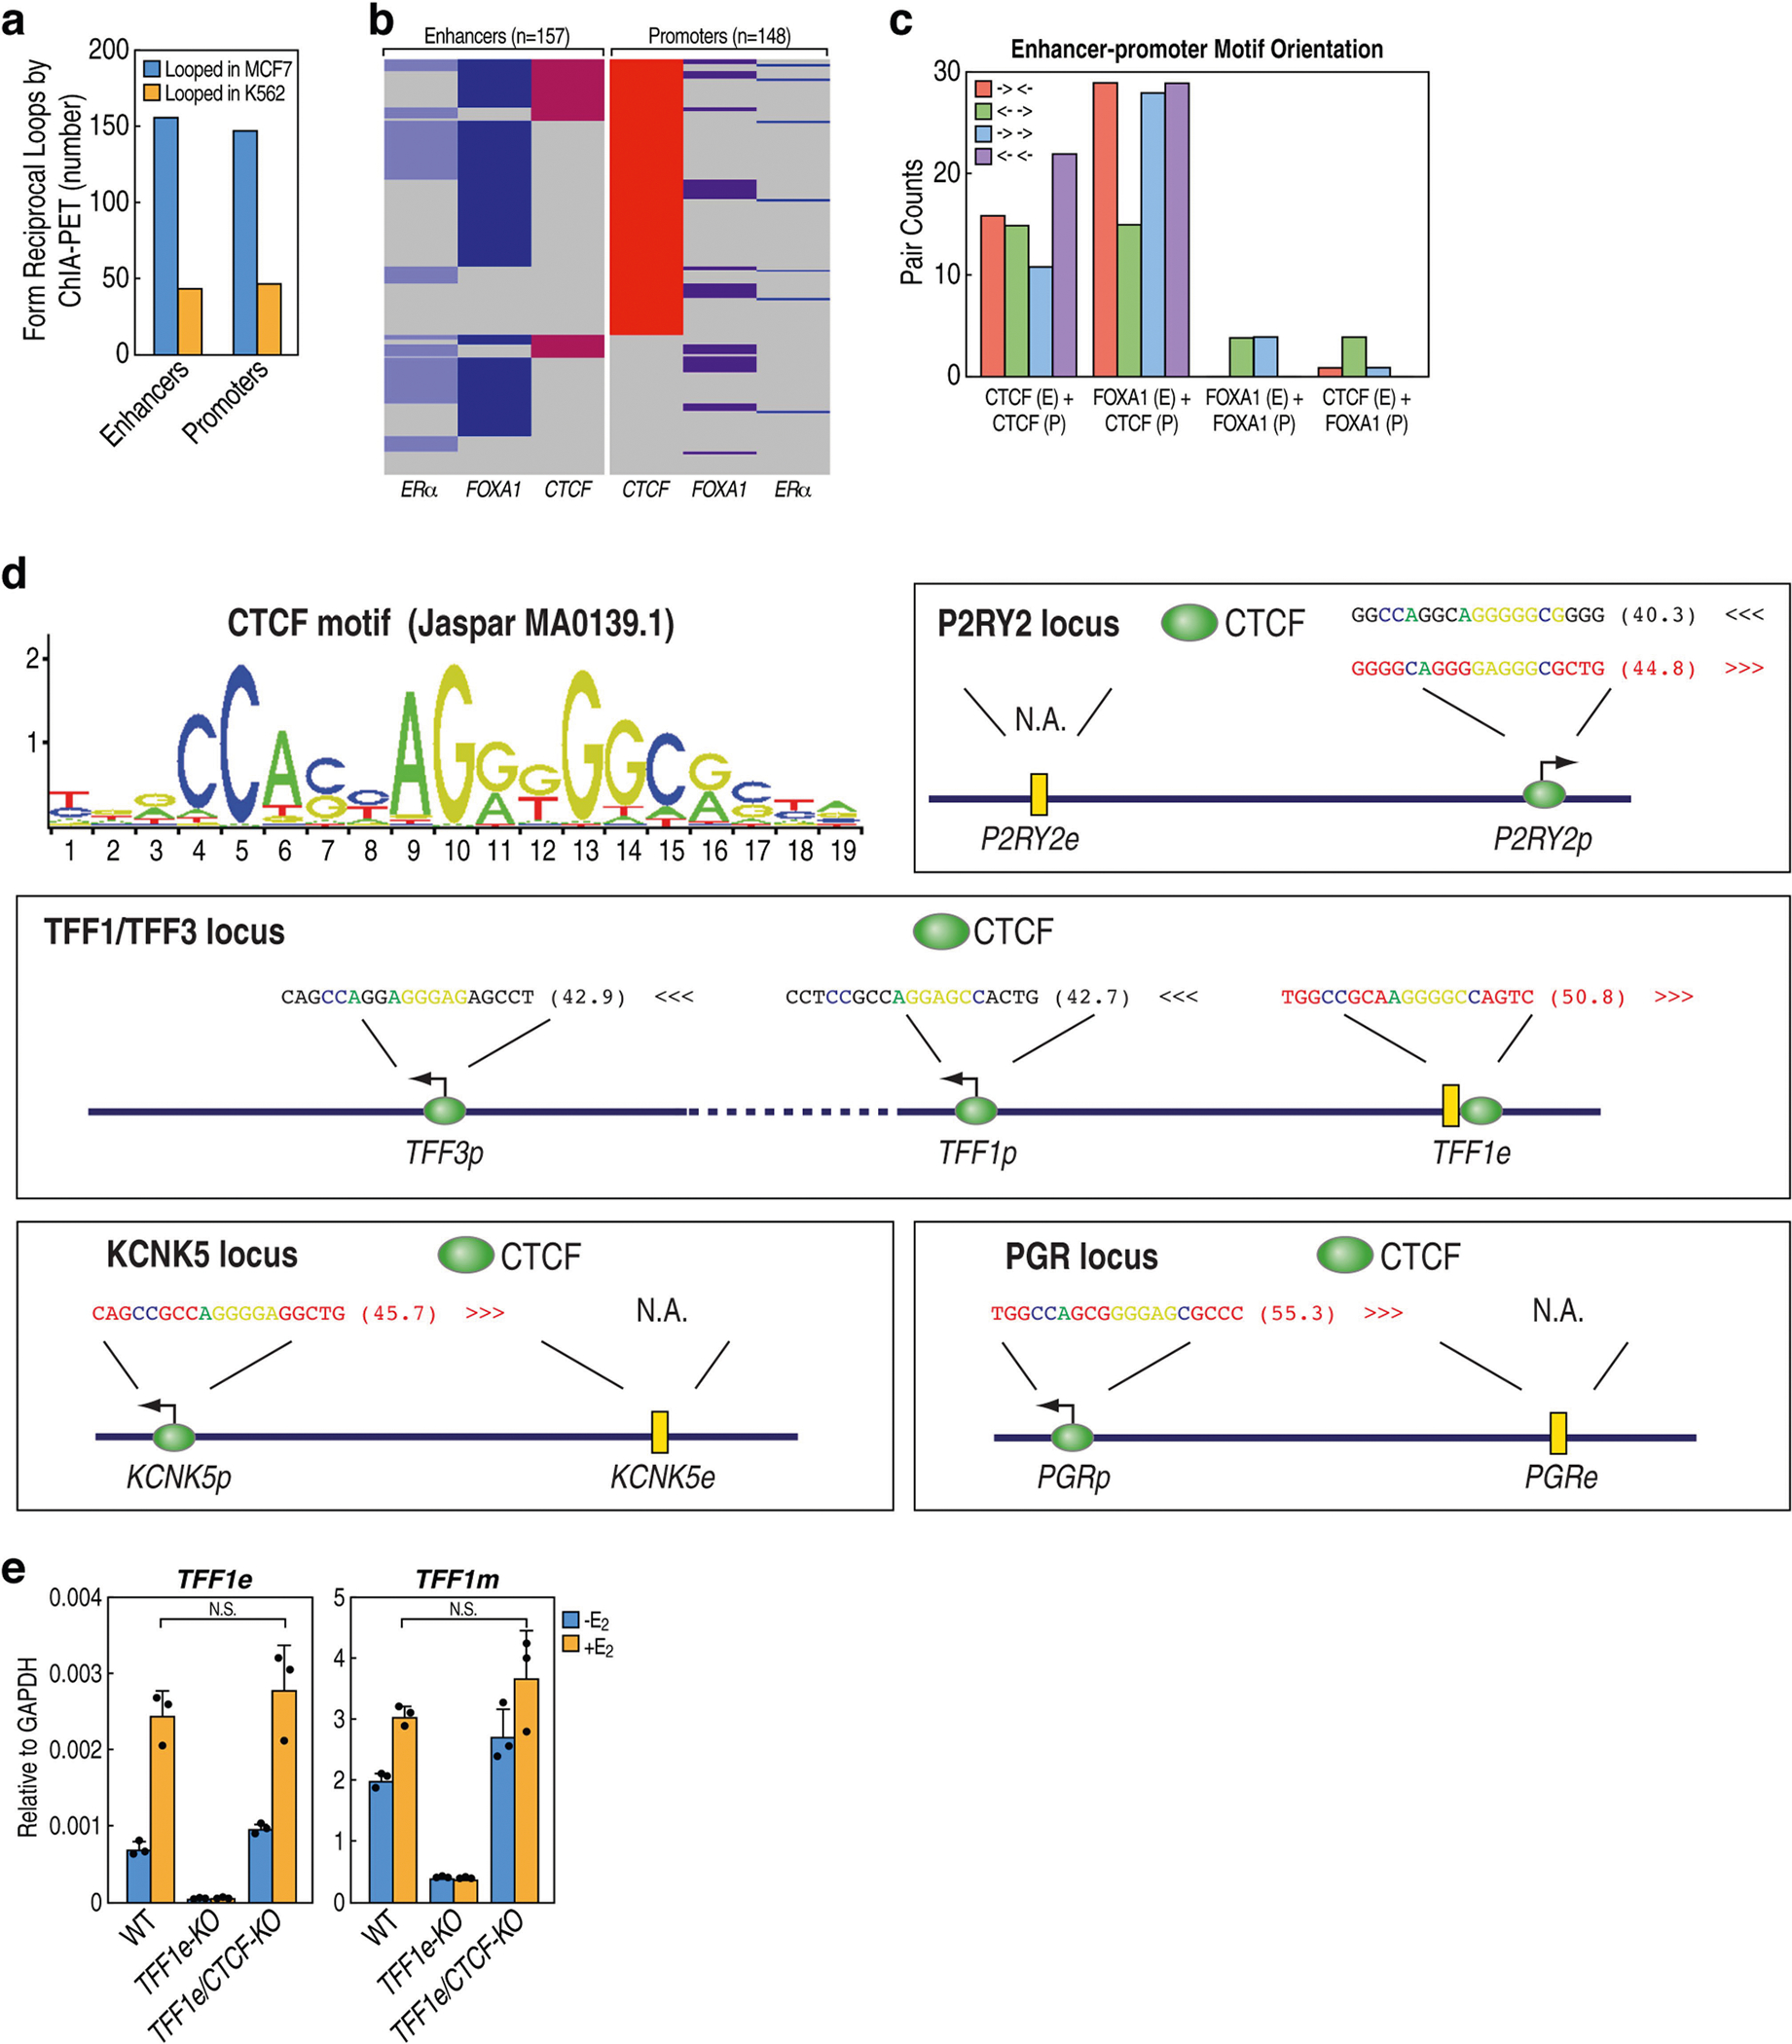
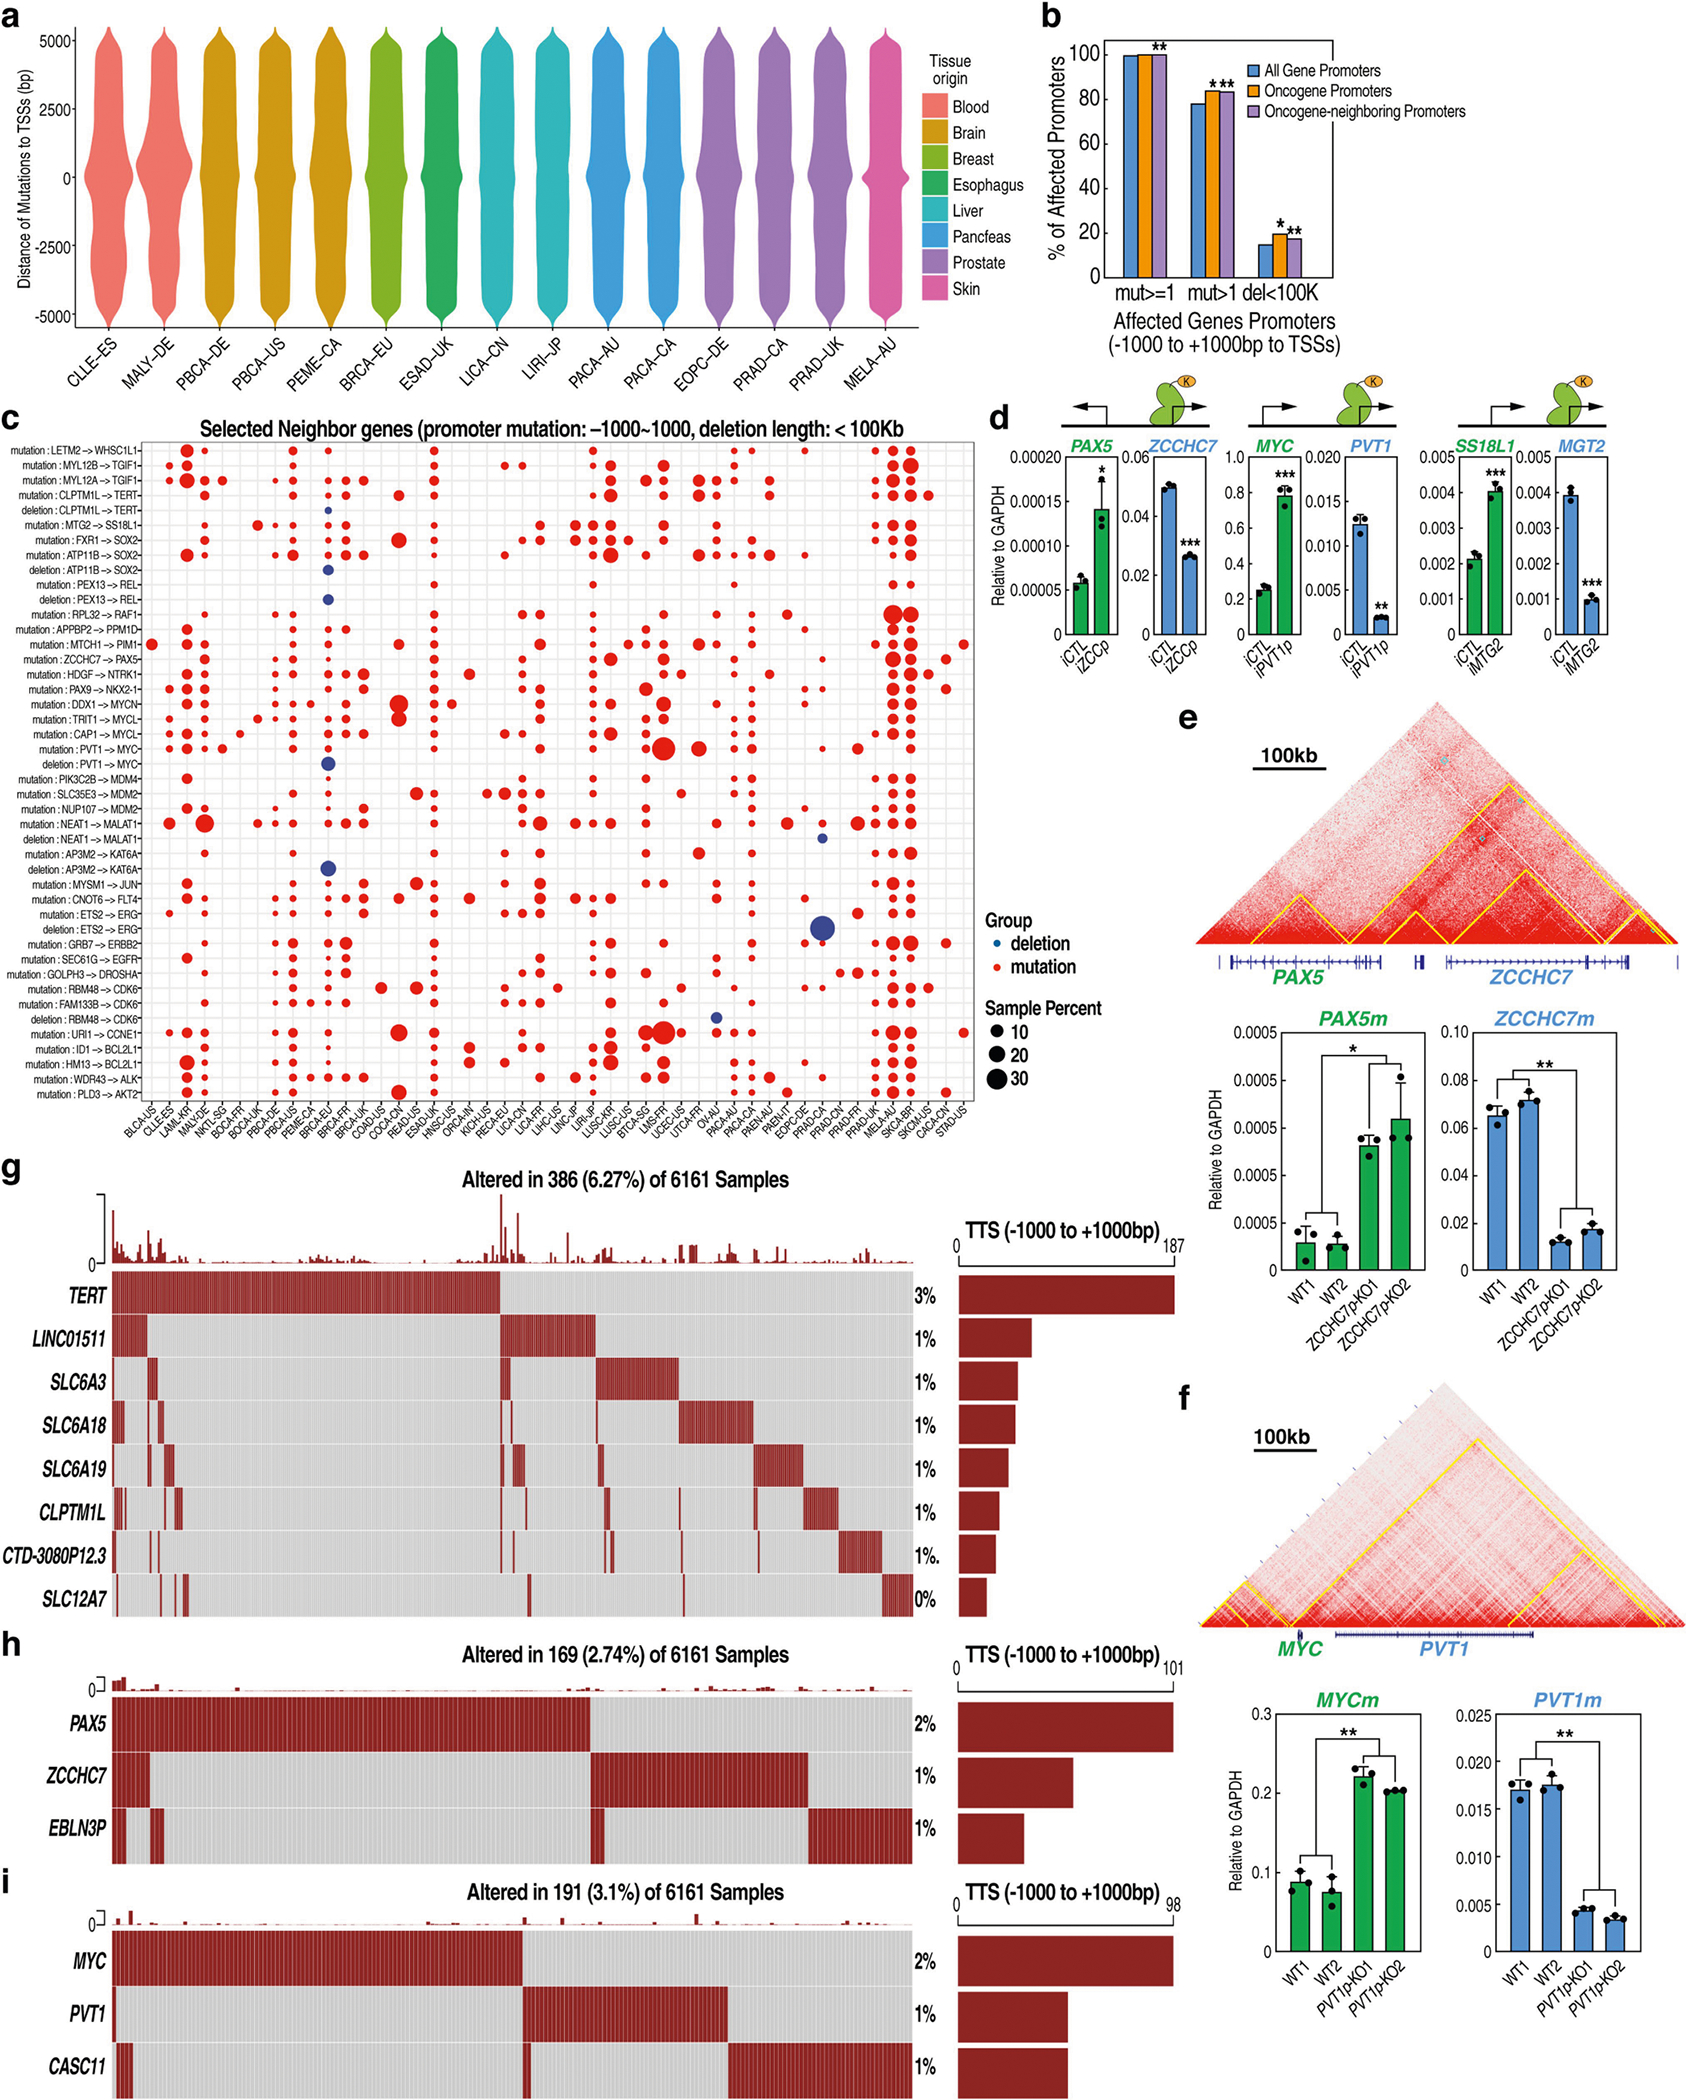
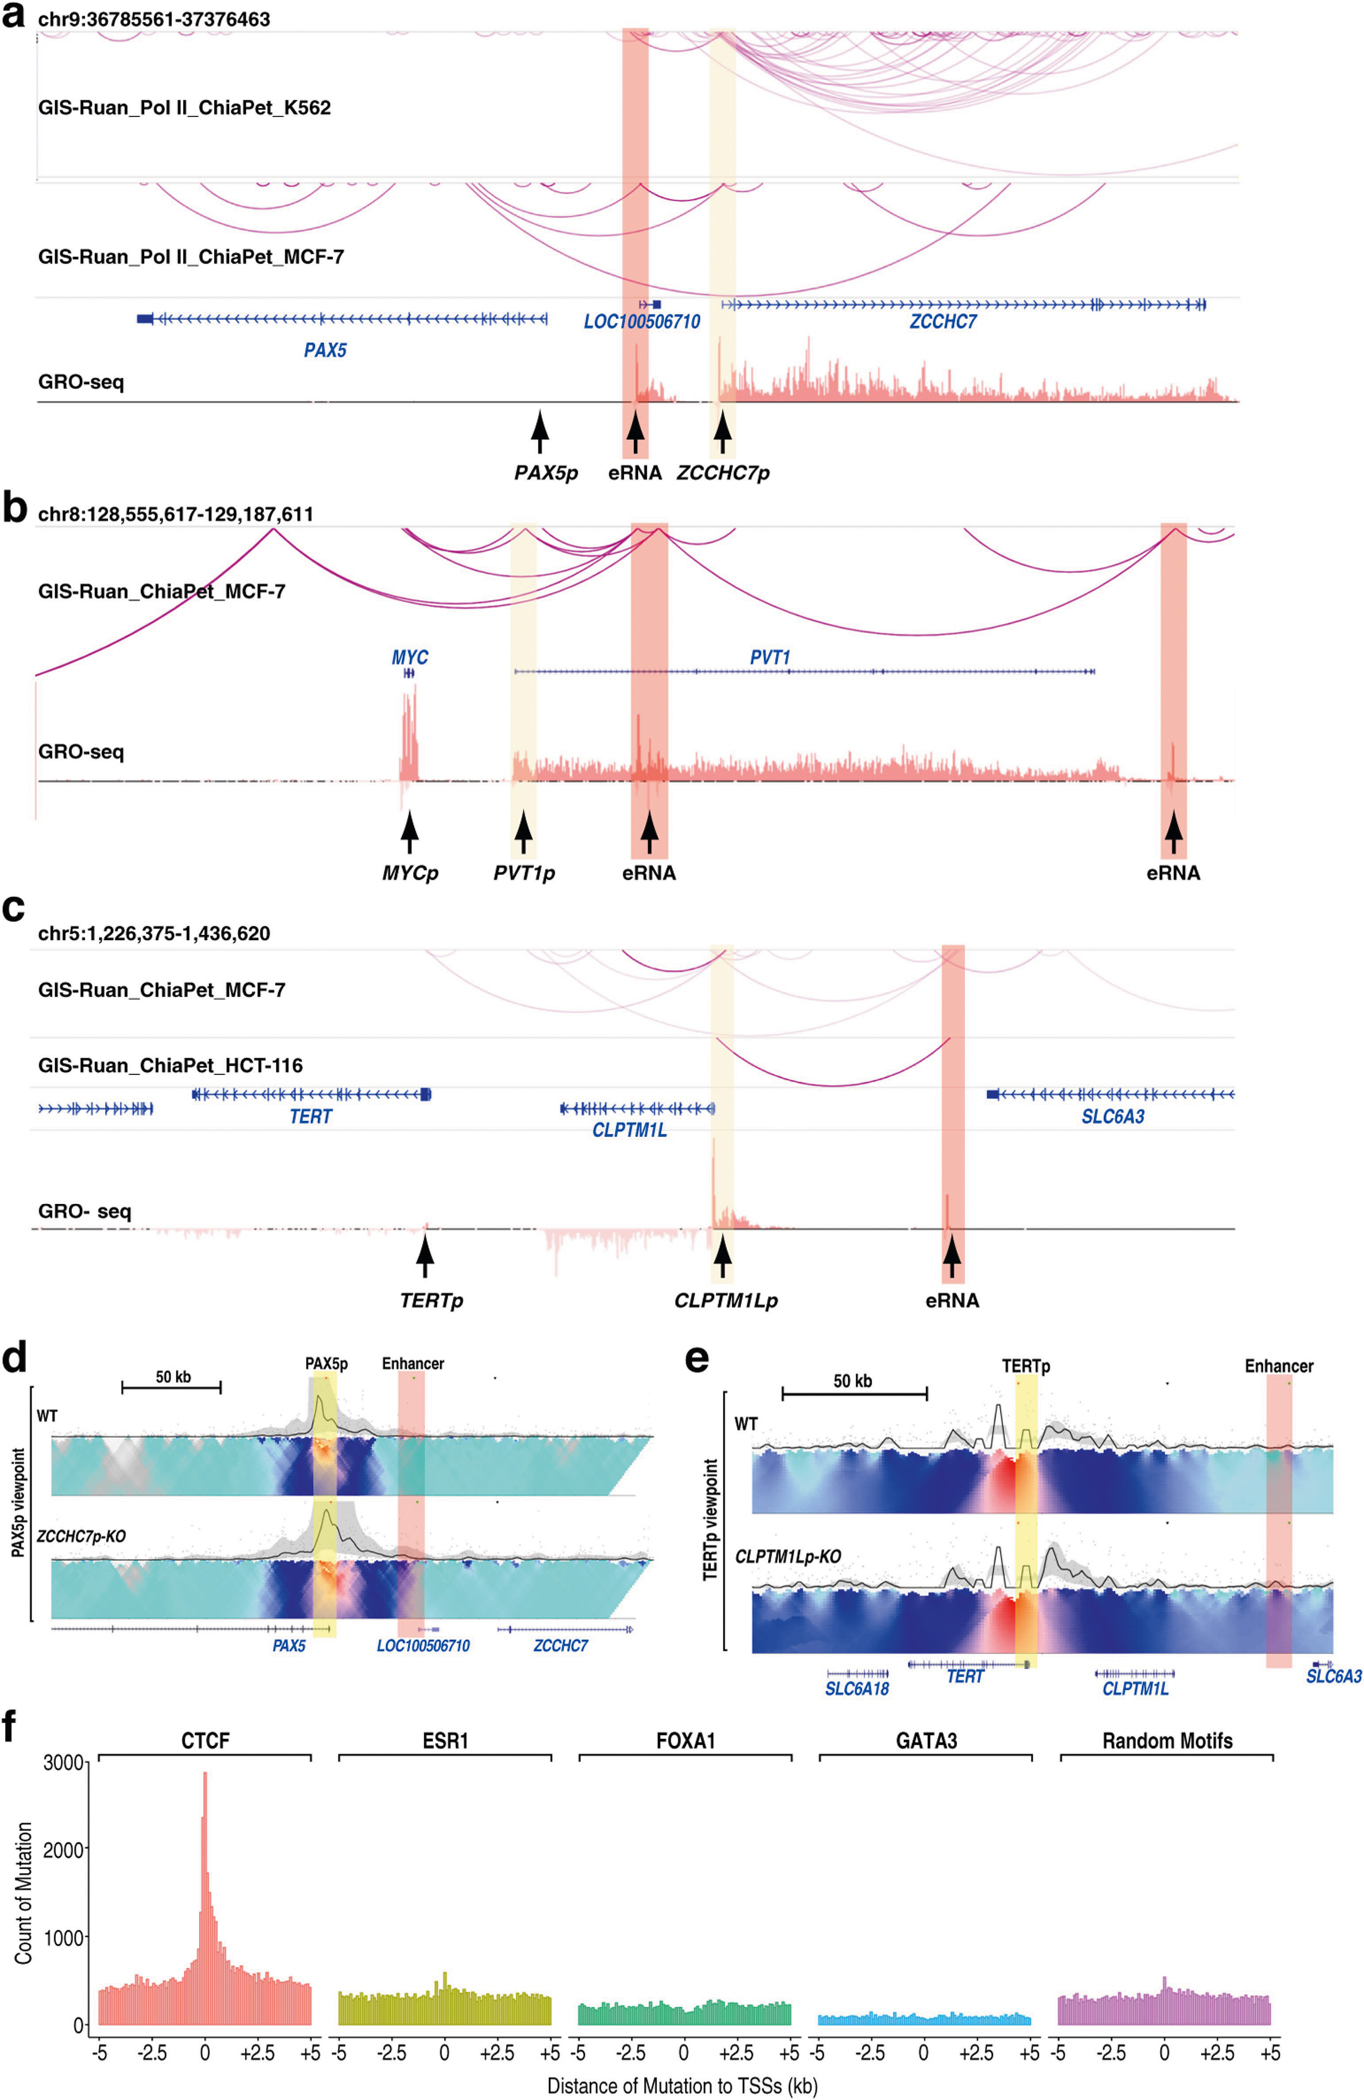
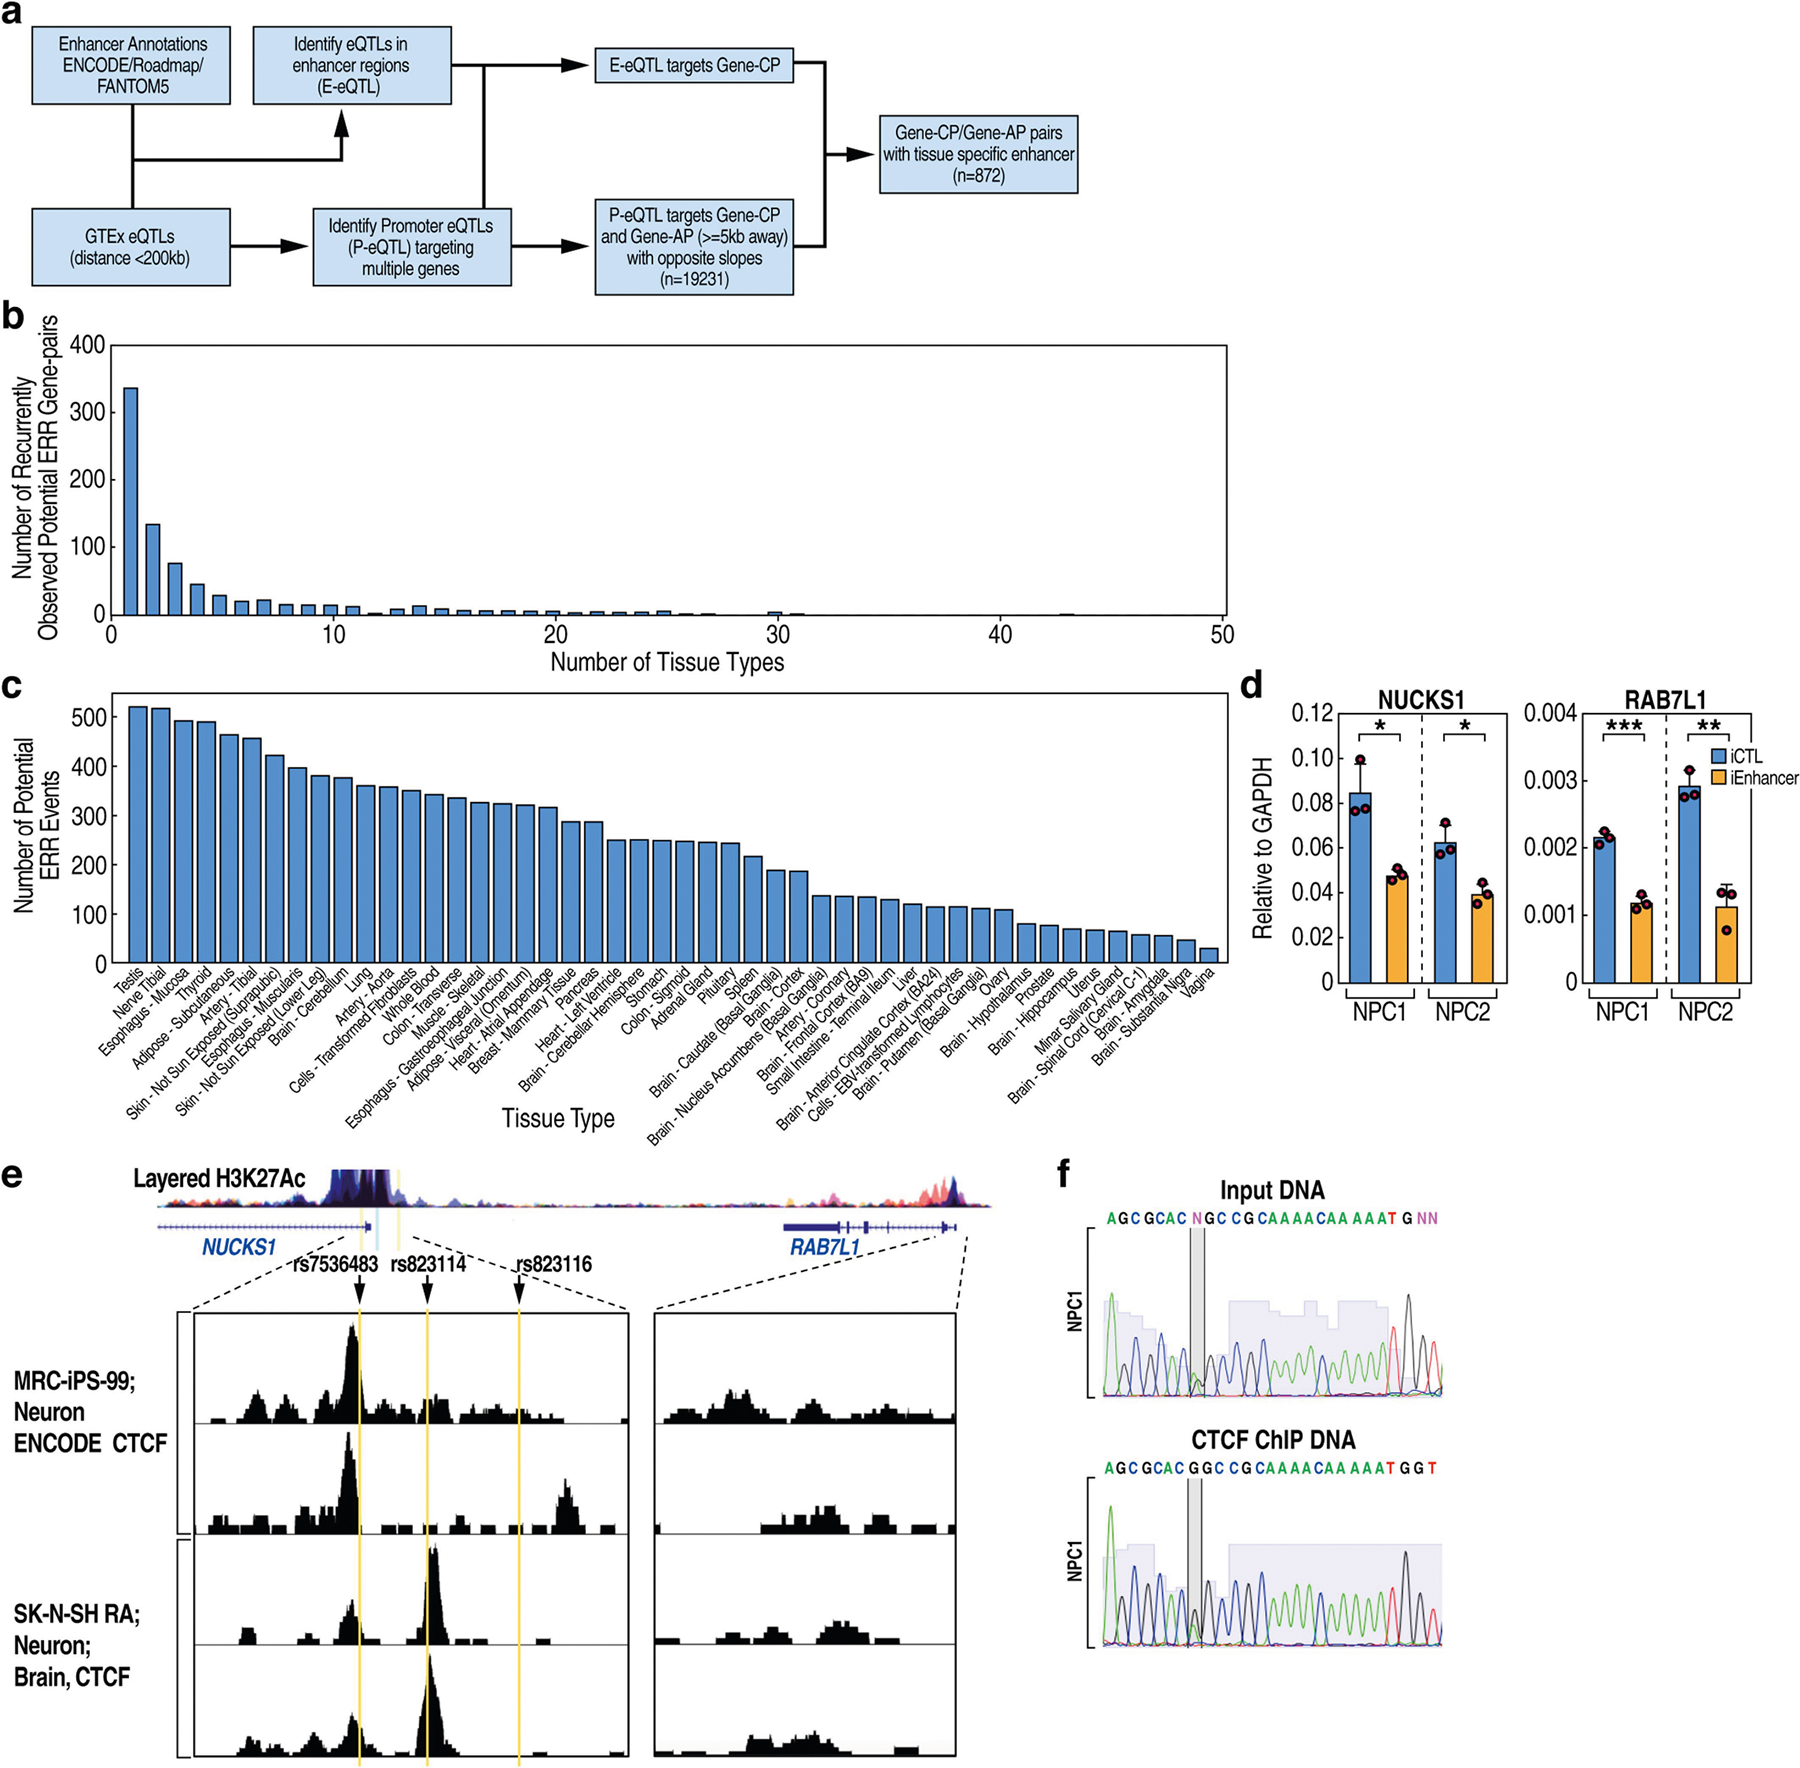
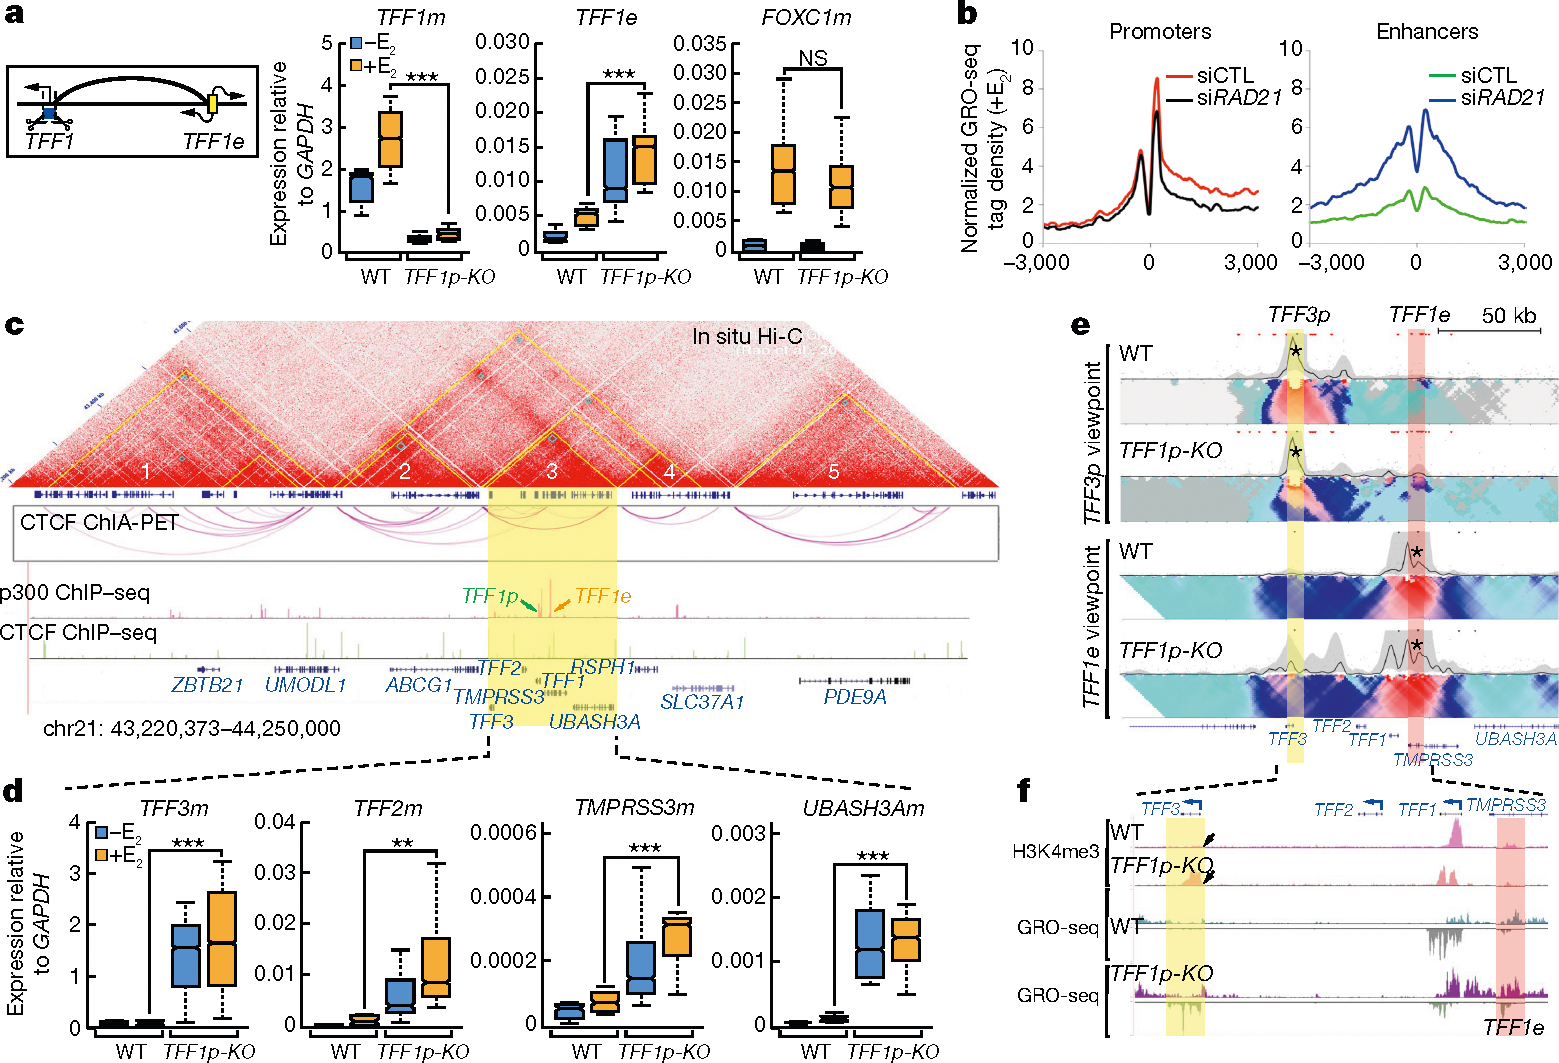
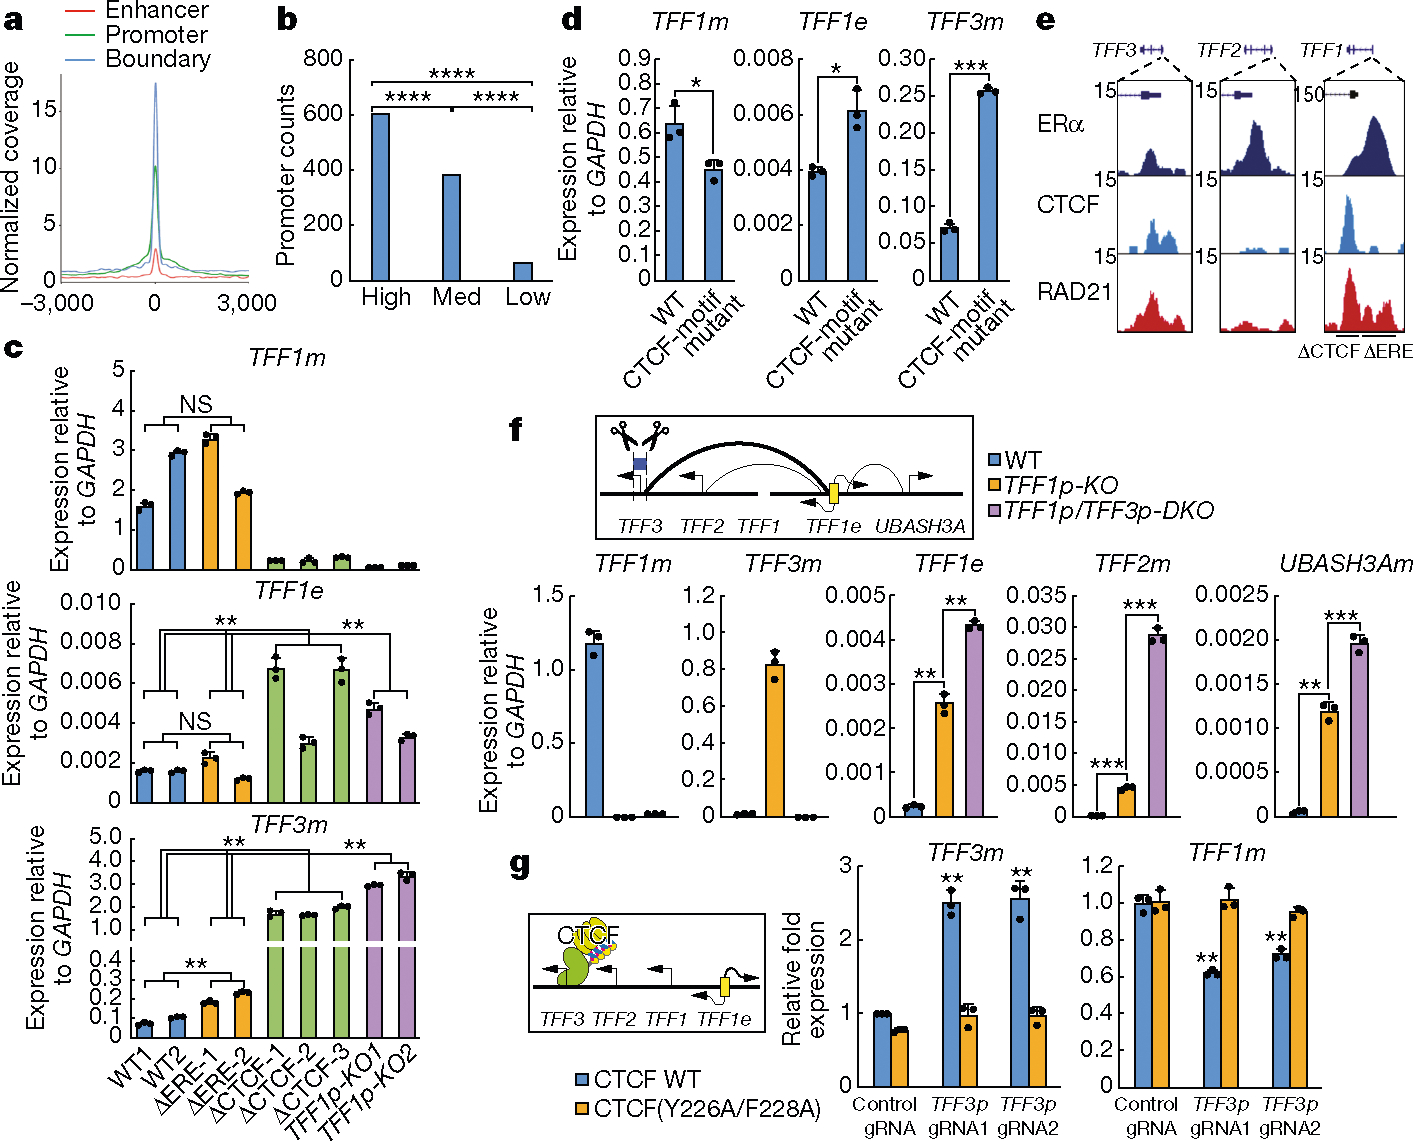
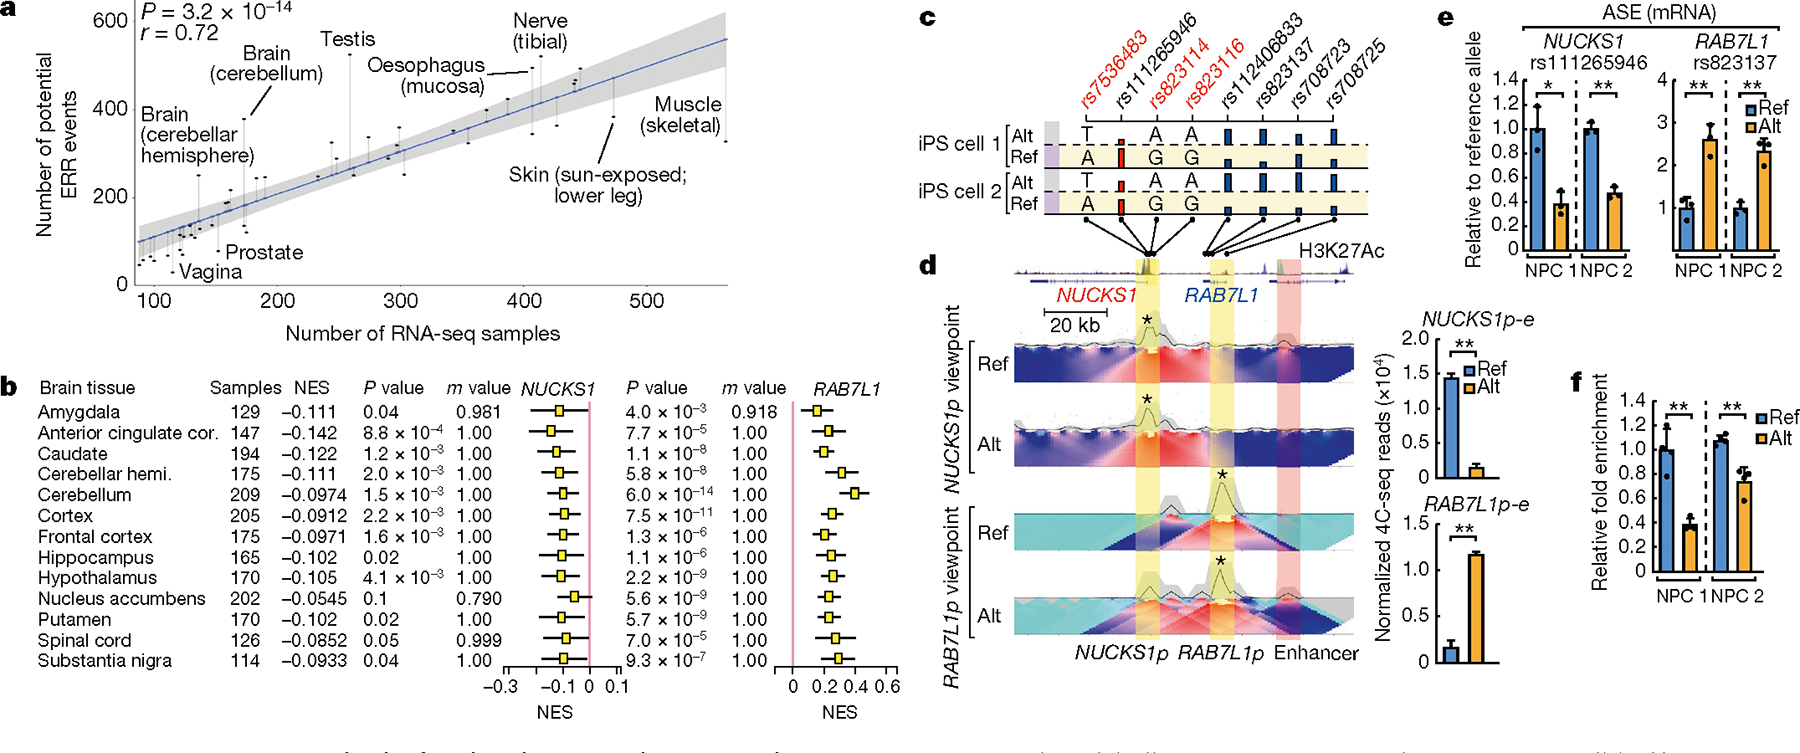
The functional engagement between an enhancer and its target promoter ensures precise gene transcription1. Understanding the basis of promoter choice by enhancers has important implications for health and disease. Here we report that functional loss of a preferred promoter can release its partner enhancer to loop to and activate an alternative promoter (or alternative promoters) in the neighbourhood. We refer to this target-switching process as 'enhancer release and retargeting'. Genetic deletion, motif perturbation or mutation, and dCas9-mediated CTCF tethering reveal that promoter choice by an enhancer can be determined by the binding of CTCF at promoters, in a cohesin-dependent manner-consistent with a model of 'enhancer scanning' inside the contact domain. Promoter-associated CTCF shows a lower affinity than that at chromatin domain boundaries and often lacks a preferred motif orientation or a partnering CTCF at the cognate enhancer, suggesting properties distinct from boundary CTCF. Analyses of cancer mutations, data from the GTEx project and risk loci from genome-wide association studies, together with a focused CRISPR interference screen, reveal that enhancer release and retargeting represents an overlooked mechanism that underlies the activation of disease-susceptibility genes, as exemplified by a risk locus for Parkinson's disease (NUCKS1-RAB7L1) and three loci associated with cancer (CLPTM1L-TERT, ZCCHC7-PAX5 and PVT1-MYC).


Figures

Extended Data Fig. 1 |
Extended Data Fig. 1 |. Disrupted enhancer–promoter looping alters eRNA and mRNA transcription.
a, qRT–PCR results showing the temporal expression kinetics of eRNAs and mRNAs at two loci after treatment with 17-β-oestradiol (E2). mRNAs measured by intronic primers (n = 3; biological replicates). Shaded error band represents mean ± s.d. b, 4C-seq heat maps using TFF1e, P2RY2e or KCNK5e as the viewpoints showing the effects of RAD21 siRNA depletion on the E-P looping events; yellow and pink highlights depict enhancers and promoters, respectively. The quantified chromosome contact frequency between enhancer and promoter from two replicates of 4C-seq is shown in the bar graph (bottom). c, Expression of TFF1 mRNA (TFF1m) and TFF1 enhancer RNA (TFF1e) in wild-type (n = 6) and TFF1p-KO MCF-7 isogenic cell clones (n = 14) was checked by qRT–PCR. The FOXC1 gene that locates on another chromosome was examined as a control. The WT5 and KO6 lines were used for many subsequent experiments (for example, 4C-seq, GRO-seq and ChIP). Each bar represents data from an independent cell clone and was made from n = 3 data points of technical replicates. The data presented here represent three biological replicates. d, qRT–PCR results showing the expression of TFF1 eRNA and mRNA in wild-type MCF-7 cells versus TFF1p-KO cells with two different gRNA pairs (TFF1p-KO_gRNA1/2 and TFF1p-KO_gRNA3/4) (n = 3 data points of technical replicates; representative of three independent experiments). e, ChIP–qPCR data indicating the binding of RNA Pol II and p300 at the TFF1 enhancer or promoter in wild-type compared to TFF1p-KO cells (n = 3 data points of technical replicates; representative of two biological replicates); their binding at an enhancer region near the NRIP1 gene (that is, NRIP1e) is shown as a control. Data are mean ± s.d.; *P < 0.05; **P < 0.01, ***P < 0.001, two-tailed Student’s t-test.
Extended Data Fig. 2 |
Extended Data Fig. 2 |. Promoter deletion affects gene and eRNA transcription in its chromosomal neighbourhood at the P2RY2, KCNK5 and PGR loci.
a, b, qRT–PCR showing the mRNA and eRNA expression of P2RY2 (a) and the expression of neighbouring genes (FCHSD2 and P2RY6) (b) in wild-type (n = 2) versus P2RY2 promoter KO (P2RY2p-KO) (n = 2) independent isogenic clones of MCF-7 cells. Each bar represents an independent cell clone (n = 3 data points of technical replicates; representative of two independent experiments). c, Top, Hi-C contact matrix and ChIP–seq tracks of CTCF and p300 showing the topology of the chromosomal neighbourhood of P2RY2 locus. Bottom, UCSC browser screenshots showing the binding of CTCF, cohesin subunit (that is, RAD21) and ERα at P2RY2 and surrounding gene promoters. d, e, qRT–PCR showing the mRNA and eRNA expression of KCNK5 (d) and the expression of neighbouring genes (KCNK17 and SAYSD1) (e) in wild-type (n = 2) versus KCNK5 promoter KO (KCNK5p-KO) (n = 2) independent isogenic cell clones of MCF-7 cells. Each bar represents an independent cell clone (n = 3 data points of technical replicates; representative of two independent experiments). f, Top, Hi-C contact matrix and ChIP–seq tracks of CTCF and p300 showing the topology of the chromosomal neighbourhood of the KCNK5 locus. Bottom, UCSC browser screenshots showing the binding of CTCF, cohesin subunit (that is, RAD21) and ERα at KCNK5 and surrounding gene promoters. g, h, qRT–PCR showing the mRNA and eRNA expression of PGR (g) and the expression of neighbouring genes (ARHGAP42 and TRPC6) (n = 3) (h), in wild-type (n = 2) versus PGR promoter KO (PGRp-KO) (n = 2) independent isogenic cell clones of MCF-7 cells. Each bar represents an independent cell clone (n = 3 data points of technical replicates; representative of two independent experiments). i, Top, Hi-C contact matrix and ChIP–seq tracks of CTCF and p300 showing the topology of the chromosomal neighbourhood of the PGR locus. Bottom, UCSC browser screenshots showing CTCF, cohesin and ERα binding at PGR and surrounding gene promoters. Data are mean ± s.d.; *P < 0.05; **P < 0.01, ***P < 0.001, two-tailed Student’s t-test.
Extended Data Fig. 3 |
Extended Data Fig. 3 |. Cohesin knockdown affects gene and eRNA transcription through coordinating looping, without changing histone methylation.
a, qRT–PCR results showing efficient knockdown of RAD21 by siRNA, which does not affect the mRNA level of ESR1 (encoding ERα) (n = 3 data points of technical replicates; representative of two independent experiments). b, c, qRT–PCR results showing that siRAD21 decreases the 17-β-oestradiol-induced activation of coding genes (b), but upregulates the eRNAs next to these genes (c) (n = 3 data points of technical replicates; representative of two independent experiments). d, MA plots showing the differential expression of RefSeq genes (left) or eRNAs (right) in cells with depletion of RAD21 versus cells transfected with control siRNA (that is, siCTL). Red dots represent significantly changed genes or eRNAs (fold change > 1.5; FDR < 0.05). The purple bars indicate twofold change. e, UCSC genome browser screen shoots of GRO-seq results in siRAD21- versus siCTL-transfected MCF-7 cells at KCNK5 (left) and P2RY2 (right) loci; p300 ChIP–seq serves to indicate active enhancers. Yellow highlights denote gene regions; pink highlights denote enhancer regions. f, Diagram showing an oppositely regulated transcription of many eRNAs and mRNAs caused by disruption of E-P looping (that is, siRAD21). g, The tag density plots showed no significant difference of histone marks for promoters (H3K4me3 ChIP–seq) or enhancers (H3K4me1 ChIP–seq). qPCR data represent mean ± s.d.; **P < 0.01, ***P < 0.001, two-tailed Student’s t-test.
Extended Data Fig. 4 |
Extended Data Fig. 4 |. Deletion of the TFF1 promoter alters the transcription of the cognate TFF1 enhancer and neighbouring genes.
a, Hi-C contact matrix in GM12878 cells (by Juicebox), CTCF-mediated chromatin loops (by ChIA-PET) and ChIP–seq tracks of CTCF and p300 in MCF-7 cells showing the topology (multiple contact domains) of the chromosomal neighbourhood of the TFF1 locus. Yellow triangles in the Hi-C map denote contact domains; domains are numbered for simplicity. The contact domains containing genes analysed in b are highlighted in yellow. b, Box plots of gene expression outside of the hosting contact domain of TFF1 generated by qRT–PCR in wild-type (n = 6) and TFF1p-KO (n = 14) isogenic clones of MCF-7 cells. The box plot centre lines represent medians; box limits indicate the 25th and 75th percentiles as determined by R software; and whiskers extend 1.5 × IQR from the 25th and 75th percentiles. c, qRT–PCR results showing the expression of TFF3 and RSPH1 mRNA in wild-type MCF-7 cells as compared to TFF1p-KO cells with two different gRNA pairs (TFF1p-KO_gRNA1/2 and TFF1p-KO_gRNA3/4) (n = 3 data points of technical replicates; representative of three independent experiments). d, ChIP–qPCR data indicating the binding of RNA Pol II and p300 at TFF3p in wild-type cells as compared to TFF1p-KO cells (n = 3 data points of technical replicates; representative of two independent experiments). e, qRT–PCR results showing the expression of TFF1e and TFF3m after knockdown of RAD21 by siRNA in wild-type MCF-7 cells versus TFF1p-KO cells (n = 3 data points of technical replicates; representative of two independent experiments). f, qRT–PCR results showing the expression TFF1e, TFF1m and TFF3m in wild-type MCF-7 cells versus cells with deletion of the TFF1 enhancer (TFF1e-KO), TFF1 promoter (TFF1p-KO) or both (TFF1e/p-DKO) (n = 3 data points of technical replicates; representative of three independent experiments). The diagram shows the TFF1e deletion in TFF1p-KO cells. Data are mean ± s.d.; *P < 0.05; **P < 0.01, ***P < 0.001, two-tailed Student’s t-test.
Extended Data Fig. 5 |
Extended Data Fig. 5 |. Epigenomic features of the enhancers and promoters that are putative looping pairs, as revealed by their opposite regulation after siRAD21 treatment.
a, ChIP–seq profile plots were generated using published data in MCF-7 cells (Supplementary Table 6), showing the differential enrichment of chromatin-looping-related structural factors, including CTCF, cohesin subunit (that is, RAD21), cohesin loading factor (that is, NIPBL) and Mediator subunit (that is, MED1) on the promoters that are downregulated by siRAD21 treatment, as well as on enhancers for which eRNAs are increased by siRAD21. Also refer to Extended Data Fig. 3. b, ChIP–seq profile plots showing the differential enrichment of factors that are relevant to enhancer function in MCF-7 cells, including those of p300, ERα, FOXA1 and GATA3. c, Diagram showing the non-stoichiometric distribution of chromatin structural factors and other transcription-related factors on functional E-P pairs. These E-P pairs denote RAD21-regulated enhancers (super-activated by siRAD21) and RAD21-dependent promoters (downregulated by siRAD21).
Extended Data Fig. 6 |
Extended Data Fig. 6 |. Promoters exhibit a higher frequency and affinity of CTCF binding than enhancers.
a, Percentages of promoters (P), enhancers (E) or random genomic regions (R) that contain a CTCF motif (left) or undergo CTCF binding (right) in MCF-7 cells (based on ENCODE data). The cartoons at the bottom indicate that promoters were further analysed for their features in c, on the basis of their distance to an adjacent enhancer. b, Similar to a but using GM12878 data. c, Percentage of MCF-7 promoters that contain a CTCF motif (left) or undergo CTCF binding (right) for three categories of promoters: promoters that have a super-enhancer, a typical enhancer or no enhancer in their 50-kb genomic proximity (cartoon at bottom of a). d, Similar to c but using GM12878 data. All P values in ae were generated by two-sided Fisher’s exact test. e, Top, diagram showing the design of constructs. The binding between GCN4 and ScFV will bring CTCF to the sites at which dCas9/gRNA binds. Bottom, western blots showing the expression of scFv-CTCF-V5 (wild type or Y226A/F228A mutant) and dCas9–10xGCN4 after lentiviral transduction (uncropped images in Supplementary Fig. 1; representative of two independent experiments). f, ChIP–qPCR using a V5 antibody indicating comparable binding of V5-tagged wild-type CTCF or CTCF(Y226A/F228A) on TFF3p (n = 3 data points of technical replicates; representative of two independent experiments). Control gRNAs did not bring the V5-tagged CTCF to TFF3p. ChIP was performed with MCF-7 cells expressing dCas9–10xGCN4 and scFV-CTCF (wild type or Y226A/F228A mutant) as indicated. qPCR data in f represent mean ± s.d.; *P < 0.05; **P < 0.01, two-tailed Student’s t-test. The P values were based on comparisons between the same-coloured bar (either wild-type or mutant CTCF) in TFF3p-gRNA1/gRNA2 versus CTL-gRNA1/gRNA2 conditions.
Extended Data Fig. 7 |
Extended Data Fig. 7 |. Enhancer scanning and alternative models to interpret ERR and enhancer–promoter functional engagement.
a, Model describing the process through which an activated enhancer scans its chromosomal neighbourhood inside a contact domain to functionally engage with its cognate promoter target. This enhancer scanning process involves promoter-bound CTCF (green ovals) and is compatible with cohesin-mediated extrusion (dashed lines) in wild-type cells, but it continues to operate in the absence of the cognate promoter (that is, P1) owing to deletion or disease mutation. A hypothetical ‘enhancer engagement’ time is depicted that reflects the relative amount of time in which the active enhancer engages with the neighbouring promoters, correlating with their expression levels. b, There are alternative, non-exclusive models that could be largely consistent with our results. For example, one of the other possibilities is a ‘positional effect’ model. In this model, an active enhancer may engage with its preferred promoter, and the two are retained in a transcription-associated E-P loop, quite probably in a nuclear environment such as an interchromatin granule, transcription factory or other perhaps phase-separated structure (pink coloured area). Upon functional loss (deletion, mutation or CTCF loss) of the original promoter, this ‘positional’ effect will follow the enhancer but it will engage with the secondary choices (P3 in the model; for example, TFF3 as compared to TFF1, or PAX5 as compared to ZCCHC7, or TERT as compared to CLPTM1L). But at a lower frequency or in a small percentage of single cells among a population, the enhancer does engage with other target promoters (such as P2, dotted black line). When the secondary choice is also lost, the entire enhancer will now select the third choice—for example, P2 in the model—to activate the promoter as its newest hierarchical choice. Overall, a few specific results from our study are in better support of the enhancer scanning model. First, it is consistent with the observation that for all single-cell colonies investigated (that is, 14 independent cell clones of TFF1p-KO in Extended Data Fig. 1), they consistently exhibited the highest expression of TFF3 as the new hierarchical promoter choice, precluding models suggesting stochastic promoter choice. A positional effect model may predict that the enhancer and the target promoter are engaged so that the inhibition of one will reduce the other. This is true in that deletion of TFF1e inhibited TFF1p (Extended Data Fig. 4f). However, CRISPRi of TFF1p resulted in higher activity of TFF1e and higher expression of TFF3 (Fig. 3b). This data better support an enhancer scanning model—a dynamic enhancer–promoter interaction process inside the contact domain, in which TFF1p inhibition makes the ‘TFF1e-in-action’ preferentially interact with the next target in the hierarchy. Second, TFF1e exhibited quite broad chromatin interaction throughout the contact domain (for example, Fig. 1e, by 4C-seq), which is in accord with its ‘scanning’ behaviour. Furthermore, high-resolution Micro-C, data showed that many ‘stripe loops’ formed in between enhancer and promoter at a finer scale (<50 kb or sometimes <10 kb), consistent with the suggestion that at least a subset of enhancers and promoters are actively scanning or extruding. The positional effect model is fundamentally compatible with the enhancer scanning model. The enhancer scanning model reflects a dynamic process in which the enhancer initiates target searching and it finds a major target as well as many additional minor targets. Were we to snapshot this dynamic process, then at every time point that an enhancer engages with one of its potential targets (for example, TFF3p or TFF1p), the target promoter would be repositioned closer to the enhancer. Our data suggest that the scanning process of the enhancer requires the cohesin complex, as its depletion by RNA interference reproduced many of the phenomena that are seen in promoter-knockout cells (for example, Fig. 1b, Extended Data Figs. 3, 4e). This is consistent with a proposed loop-extrusion model, rather analogous to the mechanism by which cohesin facilitates the formation of the larger TAD structures,,, requiring opposing CTCF motif orientation and high-affinity CTCF binding. However, it cannot be excluded that other chromatin remodellers, or Pol II itself, are the critical driver of enhancer scanning and E-P engagement. In support of this, inhibition of Pol II elongation partially reduced the promoter-centred stripe loops in mouse embryonic stem cells in a Micro-C study. Finally, it is noteworthy that the scanning concept that enhancers (either the DNA–protein complex as an entirety or specific transcription apparatus such as Pol II) travel along chromatin to reach target genes has been extensively discussed as one of the classic models to interpret enhancer activity,.
Extended Data Fig. 8 |
Extended Data Fig. 8 |. CTCF binding on promoters, but not on enhancers. dictates enhancer–promoter choice.
a, Bar graph showing the numbers of RAD21-regulated enhancers and promoters (same set used in Fig. 1b, Extended Data Fig. 5) that engage in chromatin loops in MCF-7 cells as discovered by analysing MCF-7 ChIA-PET data from ENCODE, as compared to their low incidence of looping in K562 ChIA-PET data. b, Coloured map showing that, among the functionally looped E-P pairs discovered in a, only certain percentages are bound by ERα, FOXA1 or CTCF by ChIP–seq. c, The numbers of looped E-P pairs that display various motif directionality of CTCF and FOXA1. The four categories below the plot describe the existence of CTCF or FOXA1 motifs on enhancers (E) or promoters (P); the colours indicate the combinations of motif directionality. For example, ‘CTCF (E) + CTCF (P)’ denotes the coincidence of CTCF motifs on both promoters and enhancers. There was no obvious orientation preference of binding motifs for CTCF. FOXA1 binds to functionally looped enhancers more frequently than CTCF (Extended Data Figs. 5b, 8b), but it also exhibits no preferred motif orientation. d, Diagrams showing the position and directionality of CTCF-binding peaks and motifs in the four E-P pairs that we have extensively studied in this work. The colour motif sequence indicates directionality (black for left-pointing motifs, red for right-pointing motifs); the letters in each motif sequence are coloured to match the core CTCF motif nucleotides shown in the canonical CTCF motif by Jaspar (upper left logo); the motif scores after each motif sequence were calculated by the FIMO motif toolset. e, qRT–PCR results showing the expression of TFF1 eRNA and mRNA in wild-type MCF-7 cells versus cells with deletion of the TFF1 enhancer (TFF1e-KO), and MCF-7 cells with deletion of a CTCF peak inside the TFF1 enhancer (TFF1e/CTCF-KO; Supplementary Table 1, Supplementary Fig. 3) (n = 3 data points of technical replicates; representative of two independent experiments). Data are mean ± s.d.; *P < 0.05; **P < 0.01, ***P < 0.001, two-tailed Student’s t-test.
Extended Data Fig. 9 |
Extended Data Fig. 9 |. Cancer mutations in gene promoter regions, and their link to oncogene activation through ERR.
a, Plots showing the distribution of ICGC cancer whole-genome sequencing (WGS) mutations in the ±5 kb regions near gene TSSs. The two numbers in each plot indicate the mutations in the ±5kb of TSSs, as well as the total numbers of mutations in that cancer type, respectively. Cancer type abbreviations can be found in the ICGC web portal (http://icgc.org/), and in the Methods. b, The percentage of genes containing ICGC annotated promoter mutations or deletions among all RefSeq genes (all gene promoters; total 27,502), oncogene promoters (OPs, from cosmic database; total 315) and neighbouring gene promoters within ±200 kb of cosmic oncogenes (oncogene neighbouring promoters (ONPs); total 1,693). Hypergeometric tests were performed to compare the statistical significance of the enrichment of bearing a mutation or deletion for OPs or ONPs as compared to all RefSeq gene promoters (upon different frequency or size of mutations as indicated in the x axis). For each test, for example, comparing OPs to all RefGene promoters, p[X > k] was calculated, which denotes a one-sided probability that a higher percentage of oncogene promoters bears mutations or deletions than the percentage of RefSeq promoters. The random variable X follows a hypergeometric distribution with parameters N (number of total RefSeq genes), K (number of total RefSeq genes bearing promoter mutations or deletions), n (number of total oncogenes or oncogene neighbours), k (number of total oncogenes or oncogene neighbours that bear promoter mutations or deletions). The five significant P values shown in the plot (from left to right) are 9.2 × 10⁻⁴, 3.3 × 10⁻³, 5.2 × 10⁻⁵, 5.3 × 10⁻³ and 5.6 × 10⁻⁴, respectively. mut> = 1: any mutations being identified in ICGC; mut > 1: recurrent promoter mutations identified in more than 1 donors in ICGC release 28; del < 100 kb: genetic deletions with length smaller than 100 kb. c, Occurrence of somatic mutations and deletions at a selected list of ONPs that were included in our CRISPRi screening (see Fig. 3c). In this plot, the cancer cohorts (x axis) were ranked by the names of original cancer sites, and the y axis shows the ONP–OP gene pairs. Gene names before ‘−>‘ are those of ONPs, whereas those after ‘−>‘ are oncogenes. For example, ‘mutation: CLPTM1L −> TERT’ (the fourth row) indicates that TERT is an oncogene listed in COSMIC, and the gene promoter of CLPTM1L was identified as an ONP, which contains somatic mutations in several cancer types. The dot size was scaled by the percentage of affected donors in each of that cancer type or cohort (SamplePerc), and dots of red colour show those samples with mutations, whereas blue dots show those samples with deletion (<100 kb) covering an ONP. The cancer type abbreviations can be found in the ICGC web portal (http://icgc.org/) and in the Methods. d, qRT–PCR results showing the expression of gene pairs, PAX5ZCCHC7, MYCPVT1 and SS18L1MTG2. Each pair consisted of an oncogene (PAX5, MYC and SS18L1) and its adjacent ONP genes (ZCCHC7, PVT1 and MTG2). The ONP promoters were inhibited with specific sgRNAs in MCF-7 cells together with dCas9-KRAB (see the diagrams at the top) (n = 3 data points of technical replicates; representative of two independent experiments). e, f, Similar to Fig. 3d, these are results for two other ONP–OP loci after ONP deletion. The Hi-C contact matrix at the top shows the relative location of PAX5ZCCHC7 and MYCPVT1 gene pairs in a shared contact domain. qRT–PCR results below show the expression of ONP and OP gene mRNAs (two independent clones each) (n = 3 biological replicates). gi, Oncoplots showing the landscapes of ICGC mutations located in three pairs of OPs as well as their ONPs at the TERTCLPTM1L locus (g), the PAX5ZCCHC7 locus (h) and the MYCPVT1 locus (i). The percentages of mutations between 0.5–1% are denoted as 1%, and these between 0–0.5% are denoted as 0%. Each column in the oncoplot represents a cancer sample. The bar graphs with numbers (for example, 187, 101, 98) in the right side indicate the numbers of donor samples that contain mutations for that specific gene promoter. The labels on top of each panel indicate the total numbers of donors that contain mutations in any of the promoters in that specific locus, for example, 386 (6.27%) is the sum number of donors that contain mutations for any of the promoters shown in g. It is noteworthy that it remains a challenge to directly compare oncogene expression changes in tumour samples that carry rare noncoding mutations, because the rarity of matched RNA-seq and genotype (WGS) precludes a robust statistical analysis. qPCR data in df represent mean ± s.d.; *P < 0.05; **P < 0.01, ***P < 0.001, two-tailed Student’s t-test.
Extended Data Fig. 10 |
Extended Data Fig. 10 |. Chromosomal interaction in three pairs of oncogene and oncogene-neighbourhood genes exhibiting an ERR-like phenotype.
ac, UCSC and WashU genome browser screenshots of ChIA-PET and GRO-seq results at the PAX5ZCCHC7 locus (a), MYCPVT1 locus (b) and TERTCLPTM1L locus (c). The putative enhancers and promoters are highlighted in pink and in yellow, respectively. These cells show strong interactions between the eRNA (enhancer) and the original promoters (that is, ZCCHC7p in a, PVT1p in b and CLPTM1Lp in c). d, 4C-seq contact matrix and heat map plots showing the chromatin contacts with the PAX5 promoter as viewpoint, and its change in 293T cells with ZCCHC7 promoter knockout. The viewpoint PAX5 promoter is highlighted in yellow, and the neighbouring enhancer in pink. e, 4C-seq contact matrix and heat map plots showing the chromatin contacts with the TERT promoter as viewpoint, and its change in 293T cells with CLPTM1L promoter knockout. The viewpoint TERT promoter is highlighted in yellow, and the neighbouring enhancer in pink. f, The numbers of ICGC cancer mutations that reside in the motifs of CTCF, ERα, FOXA1 and GATA3, and random genomic regions near gene TSSs.
Extended Data Fig. 11 |
Extended Data Fig. 11 |. GTEx data analysis identifies potential ERR gene pairs acting in human populations.
a, Schematic overview of GTEx data-processing workflow to identify potential ERR events. Also see Supplementary Figs. 8–10 and associated notes. b, Histogram showing the number of potential ERR gene pairs that appear in one tissue or more than one. c, Histogram showing the number of potential ERR events distributed in each tissue. d, qRT–PCR results of CRISPRi showing the expression of NUCKS1 and RAB7L1 mRNAs with sgRNA-control (iCTL) or sgRNA specific for the putative enhancer (iEnhancer) in two clones of NPCs expressing dCas9-KRAB (see enhancer location in Fig. 4c, d) (n = 3 data points of technical replicates; representative of two independent experiments). e, Published CTCF ChIP–seq screen shots in human-iPS-cell-derived neurons or neuronal cell lines (SK-N-SH) in the NUCKS1 and RAB7L1 promoters. The ChIP–seq data tracks were generated by the Cistrome data browser (http://cistrome.org/). The location of the three SNPs is shown. f, Sanger sequencing results of the NUCKS1 promoter DNA, showing the allele bias of CTCF binding (comparison between the input DNA and ChIP DNA). Data are mean ± s.d.; *P < 0.05; **P < 0.01, ***P < 0.001, two-tailed Student’s t-test.
Fig. 1 |
Fig. 1 |. Promoter deletion causes ERR.
a, Box plots from qRT–PCR in wild-type (WT) (n = 6) and TFF1p-KO (n = 14) independent cell clones, showing the expression of TFF1 mRNA (TFF1m), TFF1 enhancer RNA (TFF1e) and FOXC1m relative to GAPDH. The left diagram shows the TFF1p deletion. b, Metagene plots showing GRO-seq signals from downregulated promoters or super-activated eRNAs after small interfering RNA (siRNA)-mediated knockdown of RAD21 (siRAD21). E2, 17-β-oestradiol. c, Hi-C map from GM12878 cells (top, by Juicebox); CTCF ChIA-PET in MCF-7 (from Gene Expression Omnibus (GEO) accession GSM970215) (middle); and indicated ChIP–seq tracks showing the chromosomal topology around the TFF1 locus (bottom). Yellow triangles in the Hi-C map denote contact domains, which are numbered for simplicity. The domain containing TFF1 is highlighted in yellow. d, Box plots from qRT–PCR in wild-type (n = 6) versus TFF1p-KO (n = 14) cell clones, showing the expression of all mRNAs (relative to GAPDH) in the domain hosting the TFF1 E-P pair. e, 4C-seq in wild-type versus TFF1p-KO cells, based on ‘viewpoints’ (asterisks) centred on TFF3p (yellow) or TFF1e (pink). f, Browser tracks showing GRO-seq and H3K4me3 ChIP–seq in the TFF1TFF3 region in wild-type versus TFF1p-KO cells; arrowheads point to gained H3K4me3 on TFF3p. The box plot centre lines represent medians; box limits indicate the 25th and 75th percentiles; and whiskers extend 1.5 times the interquartile range (IQR) from the 25th and 75th percentiles. **P < 0.01, ***P < 0.001, NS, not significant, two-tailed Student’s t-test.
Fig. 2 |
Fig. 2 |. CTCF binding at promoters is important for their functional engagement with enhancers.
a, A normalized coverage plot showing differential CTCF binding at enhancers, promoters, and domain boundaries in MCF-7 cells. b, Bar graphs showing the numbers of promoters bearing CTCF ChIP–seq peaks for 1,000 promoters with high, medium or low levels of transcription (by GRO-seq) in MCF-7 cells. ****P < 0.0001, two-sided Fisher’s exact test. c, qRT–PCR showing expression levels of the indicated targets in wild-type cells, TFF1p-KO cells or cells with deletion of the CTCF peak (ΔCTCF) or the ERα-binding site (ΔERE). Each bar represents an independent cell clone (n = 3 biological replicates). d, qRT–PCR results showing altered TFF1e, TFF1m and TFF3m levels in cells in which the TFF1p CTCF motif was disrupted (n = 3 biological replicates). e, Browser screenshots showing hierarchical CTCF and cohesin (RAD21) binding at several gene promoters. CTCF peak (ΔCTCF) or ERα-binding site (ΔERE) deletions are indicated. f, Diagram (top) and qRT–PCR results (bottom) showing the expression levels of TFF1e and several mRNAs in WT, TFF1p-KO and TFF1p/TFF3p-DKO cells (n = 3 biological replicates). g, Diagram (left) and qRT–PCR results (right) showing the relative expression levels of TFF3m and TFF1m, illustrating the strategy and effects of CTCF tethering (n = 3 biological replicates). Cells expressing dCas9–10xGCN4 and scFV-CTCF (wild type or Y226A/F228A mutant) were used. Data in c, d, f, g show mean ± s.d.; *P < 0.05, **P < 0.01, ***P < 0.001, two-tailed Student’s t-test.
Fig. 3 |
Fig. 3 |. ERR is a potentially common paradigm underlying oncogene activation.
a, A model of ERR, proposing that noncoding mutations or variations of non-disease-causing promoters can deregulate the expression of disease-associated genes in the neighbourhood. b, qRT–PCR results showing altered levels of TFF1e, TFF1m and TFF3m after CRISPRi-mediated inhibition of TFF1p (iTFF1p) compared to a control (iCTL) (n = 3 biological replicates). The top diagram shows the CRISPRi strategy. c, Heat map denoting the log2-transformed fold change in expression of OPs and ONPs measured after CRISPRi against ONPs (qRT–PCR changes; see Methods). d, Top, Hi-C map showing TERT and CLPTM1L genes in a shared contact domain. Bottom, qRT–PCR results showing the expression of TERT and CLPTM1L in wild-type and CLPTM1Lp-KO 293T cells (n = 3 biological replicates). e, Cancer mutations in CLPTM1Lp (each dot represents a mutation ID, with green-coloured mutations predicted to disrupt CTCF motifs (loss), and blue not to disrupt (no loss)). The CTCF motif containing the three mutations is shown at the top. The y axis shows the number of donors for each mutation. Donor IDs, cancer types (abbreviations shown in the Methods) and genomic coordinates are indicated (green). f, 293T cells were knocked-in (KI) with these mutations (KI-CLPTM1Lp). qRT–PCR results show the RNA expression levels of CLPTM1L and TERT in wild-type versus KI-CLPTM1Lp cells (n = 3 biological replicates). g, ChIP–qPCR results showing CTCF binding at CLPTM1Lp in wild-type versus KI-CLPTM1Lp cells (n = 4 biological replicates). Data are mean ± s.d.; *P < 0.05; **P < 0.01, ***P < 0.001, two-tailed Student’s t-test.
Fig. 4 |
Fig. 4 |. ERR represents an overlooked molecular event that can explain disease susceptibility.
a, Scatter plot and linear regression showing the numbers of ERR-like events relative to the number of RNA sequencing (RNA-seq) samples in each tissue. The P value is estimated from the t-statistic of the fit. The error band represents the standard error of the regression model. b, Box plots showing GTEx normalized effect size (NES) of NUCKS1 or RAB7L1 genes in the alternative allele (Alt) relative to the reference allele (Ref), as segregated by the rs823114 SNP. For details of sample numbers, NES, P and m values, see Methods. Cor, cortex; hemi., hemisphere. c, SNPs and allele-specific RNA expression (ASE) in NUCKS1RAB7L1 loci in two lines of iPS cells. Three SNPs at the NUCKS1 promoter that are associated with Parkinson’s disease risk are labelled in red. ASE was analysed using SNPs (black) and indicated by bar heights. Indicated at the bottom are the SNP locations relative to genes, gene coordinates and ENCODE H3K27ac ChIP–seq signals. d, Heat maps of allelic 4C-seq from iPS-cell-derived NPCs using NUCKS1 and RAB7L1 promoters (NUCKS1p and RAB7L1p) as viewpoints (asterisks). Promoters are highlighted in yellow and the enhancer in red. Quantified E-P contacts from two biological replicates of 4C-seq are shown on the right. e, qRT–PCR results showing the ASE of NUCKS1 and RAB7L1 mRNAs in two lines of NPCs (n = 3 biological replicates). f, Allelic CTCF binding at NUCKS1p, based on ChIP–qPCR using rs823114 SNP (n = 4 biological replicates). Data in df are mean ± s.d.; *P < 0.05, **P < 0.01, two-tailed Student’s t-test.

Similar articles

Cited by

References

    1. Schoenfelder S & Fraser P Long-range enhancer–promoter contacts in gene expression control. Nat. Rev. Genet. 20, 437–455 (2019). - PubMed
    1. Hsieh TS et al. Resolving the 3D landscape of transcription-linked mammalian chromatin folding. Mol. Cell 78, 539–553 (2020). - PMC - PubMed
    1. Gasperini M et al. A genome-wide framework for mapping gene regulation via cellular genetic screens. Cell 176, 377–390 (2019). - PMC - PubMed
    1. van Arensbergen J, van Steensel B & Bussemaker HJ In search of the determinants of enhancer-promoter interaction specificity. Trends Cell Biol. 24, 695–702 (2014). - PMC - PubMed
    1. Li W et al. Functional roles of enhancer RNAs for oestrogen-dependent transcriptional activation. Nature 498, 516–520 (2013). - PMC - PubMed

Publication types