. 2021 Jun;594(7862):277-282.
doi: 10.1038/s41586-021-03580-6. Epub 2021 May 26.

NF1 mutation drives neuronal activity-dependent initiation of optic glioma

Affiliations

NF1 mutation drives neuronal activity-dependent initiation of optic glioma

Yuan Pan et al. Nature. 2021 Jun.

Abstract

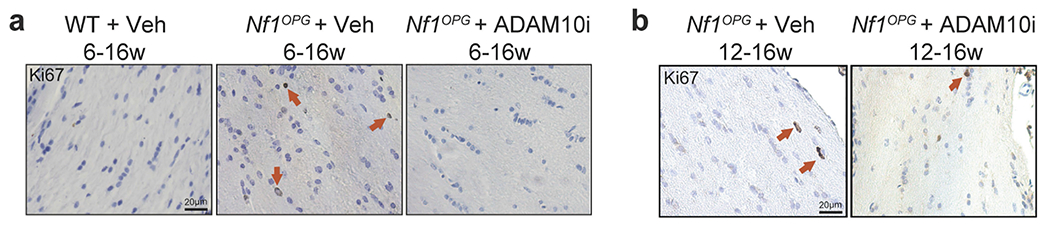
Neurons have recently emerged as essential cellular constituents of the tumour microenvironment, and their activity has been shown to increase the growth of a diverse number of solid tumours1. Although the role of neurons in tumour progression has previously been demonstrated2, the importance of neuronal activity to tumour initiation is less clear-particularly in the setting of cancer predisposition syndromes. Fifteen per cent of individuals with the neurofibromatosis 1 (NF1) cancer predisposition syndrome (in which tumours arise in close association with nerves) develop low-grade neoplasms of the optic pathway (known as optic pathway gliomas (OPGs)) during early childhood3,4, raising the possibility that postnatal light-induced activity of the optic nerve drives tumour initiation. Here we use an authenticated mouse model of OPG driven by mutations in the neurofibromatosis 1 tumour suppressor gene (Nf1)5 to demonstrate that stimulation of optic nerve activity increases optic glioma growth, and that decreasing visual experience via light deprivation prevents tumour formation and maintenance. We show that the initiation of Nf1-driven OPGs (Nf1-OPGs) depends on visual experience during a developmental period in which Nf1-mutant mice are susceptible to tumorigenesis. Germline Nf1 mutation in retinal neurons results in aberrantly increased shedding of neuroligin 3 (NLGN3) within the optic nerve in response to retinal neuronal activity. Moreover, genetic Nlgn3 loss or pharmacological inhibition of NLGN3 shedding blocks the formation and progression of Nf1-OPGs. Collectively, our studies establish an obligate role for neuronal activity in the development of some types of brain tumours, elucidate a therapeutic strategy to reduce OPG incidence or mitigate tumour progression, and underscore the role of Nf1mutation-mediated dysregulation of neuronal signalling pathways in mouse models of the NF1 cancer predisposition syndrome.


Conflict of interest statement

Competing interests M.M. is an SAB member for Cygnal Therapeutics. M.M. is listed as an inventor on a patent (US10377818B2) coordinated through Stanford University related to targeting neuron–glioma interactions for therapy.

Figures

Extended Data Fig. 1 |
Extended Data Fig. 1 |. Increased activity of the optic nerve drives growth of Nf1-OPG.
a, Representative fluorescence microscopy images reveal YFP expression within the optic nerve and retina freshly isolated from Thy1::ChR2-YFP, but not wild-type, mice. n = 3 mice from each group were examined with similar results. Scale bar, 30 μm. b, Immunohistochemistry using green fluorescent protein (GFP)- and yellow fluorescent protein (YFP)-specific antibodies reveals YFP expression (green) specifically in the retinal ganglion cells (BRN3A+) (red) of Thy1::ChR2-YFP, but not wild-type, mice. n = 3 mice from each group were examined with similar results. Scale bar, 15 μm. Arrow, cells shown in the inset. GCL, ganglion cell layer, IPL, inner plexiform layer, INL, inner nuclear layer, OPL, outer plexiform layer, ONL, outer nuclear layer. c, Representative Ki67 immunohistochemistry images (arrows indicate Ki67+ cells) and quantification of unstimulated (unstim) (n = 6) and stimulated (stim) (n = 6) Nf1OPG;Thy1::ChR2-YFP mice. Scale bar, 20 μm. Unpaired t-test with Welch’s correction. d, Plotting optic nerve volume against proliferation shows separation between unstimulated and stimulated groups. e, Immunofluorescence images of S100β (red), IBA1 (green) and DAPI (blue) reveal increased per cent of S100β+(P = 0.005), but not IBA1+ (P = 0.6739), cells in the stimulated group (n = 6 mice), relative to the unstimulated group (n = 5 mice). Unpaired t-test with Welch’s correction. f, PERG performed on Nf1OPG mice raised in regular light cycles (12:12) (n = 6 eyes) or reared in dark (n = 6 eyes) from 6–12 weeks of age. Mann–Whitney test. g, Dark-rearing experimental paradigm. n = 5 (wild type 12:12), 7 (Nf1OPG 12:12), 6 (Nf1OPG dark 6–16 weeks old) and 12 (Nf1OPG dark 6–12 weeks old). Data are mean ± s.e.m. NS, not significant (P > 0.05). Each data point is one mouse in ce. All tests were two-sided. Illustrations created with BioRender.com (f, g).
Extended Data Fig. 2 |
Extended Data Fig. 2 |. Retinal activity during a susceptible period is required for initiation of Nf1-OPG.
a, Representative Ki67 immunohistochemistry (arrows, Ki67+ cells), S100β immunofluorescence (green) and haematoxylin and eosin (H&E) (arrows indicate abnormal nuclei) images. Scale bar, 20 μm. b, Quantification of the per cent of S100β+ cells in Nf1OPG mice reared in regular light cycles (12:12) or dark-reared (24-h darkness) from 6 to 16 or 6 to 12 weeks of age. n = 4 (wild type 12:12), 5 (Nf1OPG 12:12), 5 (Nf1OPG dark 6–16 weeks old) and 5 (Nf1OPG dark 6–12 weeks old) mice. c, Representative immunohistochemistry images (white, BRN3A; blue, DAPI) in the ganglion cell layer, and quantification of per cent BRN3A+ cells in wild-type mice reared in regular light cycles (12:12, n = 5 mice), or dark (24-h darkness, n = 6 mice). P = 0.9307. Scale bar, 10 μm. d, Dark-rearing experimental paradigm with observation until 24 weeks after return to regular light cycles at 12 weeks. Half-yellow and half-grey lightbulbs and yellow bars indicate 12-h light/12-h dark cycles (12:12). Grey lightbulbs and black bars indicate dark-rearing periods (24-h darkness). Arrow, tumour initiation. e, Optic nerve volume (left) and proliferation (per cent Ki67+ cells) (right) of Nf1OPG mice reared in regular light cycles (12:12) or dark-reared (24-h darkness) from 6 to 12 weeks of age and observed until 24 weeks. n = 7 (wild type 12:12), 6 (Nf1OPG 12:12) and 6 (Nf1OPG dark 6–12 weeks old) mice. f, Plotting optic nerve volume against proliferation shows no OPG (tumour) in the dark-reared Nf1OPG mice. Tumour is gated against the maximum volumes and proliferation of 24-week-old wild-type mice. g, IBA1 (green) immunofluorescence images and quantification. Scale bars, 20 μm. n = 4 mice in each group. h, i, Quantification of CD8+ (n = 6 and 4 mice in 12:12 and dark groups, respectively) and PDGFRα+ cell density (n = 5 and 6 mice in 12:12 and dark groups, respectively). Data are mean ± s.e.m. Mann–Whitney test (c). Brown–Forsythe and Welch ANOVA tests with Dunnett’s T3 correction for multiple comparison (b, F = 11.18, P = 0.0071; e, volume, F = 11.19, P = 0.0011). Kruskal-Wallis test with Dunn’s correction for multiple comparisons (e, proliferation, P = 0.0008). Unpaired t-test with Welch’s correction (gi). NS, not significant (P > 0.05). Each data point is one mouse in b, ei. Each data point is one eye in c. All tests were two-sided. Illustrations created with BioRender.com (d).
Extended Data Fig. 3 |
Extended Data Fig. 3 |. The intrinsic circadian clock associated with constant darkness does not contribute to Nf1-OPG initiation.
a, Entrained dark-rearing paradigm. Half-yellow and half-grey lightbulbs and yellow bars indicate 12-h light/12-h dark cycles (12:12). Grey lightbulbs and dashed black bars indicate entrained dark-rearing periods (24-h darkness with 15 min of light at 07.00 and 19.00). Arrow, tumour initiation. b, Optic nerve volume (left) and proliferation (per cent Ki67+ cells) (right) of Nf1+/− mice (no tumour control, n = 3) and Nf1OPG mice reared in regular light cycles (12:12, n = 5), or dark-reared (entrained) from 6 to 16 weeks of age (n = 7). Kruskal–Wallis test (volume, P = 0.0014; proliferation, P = 0.0005). c, Plotting optic nerve volume against proliferation shows few OPGs (tumours) in entrained dark-reared Nf1OPG mice. Tumour is gated against volume and proliferation of 16-week-old wild-type mice (22 mice raised in regular light cycles; grey regions mark the range of values). d, Representative Ki67 immunohistochemistry images of Nf1+/− mice (no tumour control, n = 3) and Nf1OPG mice reared in regular light cycles (12:12, n = 5), or dark-reared (entrained) from 6 to 16 weeks of age (n = 7). Arrows, Ki67+ cells. Scale bar, 20 μm. NS, not significant (P > 0.05). Each data point is one mouse in b, c. All tests were two-sided. Illustrations created with BioRender.com (a).
Extended Data Fig. 4 |
Extended Data Fig. 4 |. Targeting BDNF or TrkB signalling does not prevent formation of Nf1-OPGs.
a, Left, generation of retina + optic nerve explants for collecting secreted proteins in the conditioned medium. Right, retina + optic nerve explant preparations from Nf1+/−;Thy1::ChR2-YFP mice were stimulated by blue light (stim) or unstimulated (unstim) (complete darkness + 1 nM TTX), followed by conditioned medium collection and mass spectrometry measurement of BDNF and NLGN3. Fold changes of BDNF and NLGN3 in the conditioned medium between stimulated and unstimulated conditions are indicated. b, Representative EdU immunofluorescence images of Fig. 2a, showing increased Nf1 optic glioma cell proliferation (EdU incorporation) to increasing concentrations of NLGN3. Scale bar, 25 μm. n = 4 (vehicle (veh)), 3 (10 nM), 3 (30 nM) and 3 (70 nM) wells. c, Increased Nf1 optic glioma cell proliferation (EdU incorporation) to 70 nM NLGN1 (n = 3 wells), NLGN2 (n = 4 wells), NLGN3 (n = 7 wells) and BDNF (n = 3 wells), relative to vehicle (n = 8 wells for NLGN1, NLGN2 and NLGN3 and 3 wells for BDNF). d, Entrectinib (ent) treatment paradigm. Blue bar, time intervals when entrectinib was administered. Arrow, tumour initiation. e, Optic nerve volume (left) (P = 0.8690) and proliferation (per cent Ki67+ cells) (right) (P = 0.4536) of Nf1OPG + vehicle (n = 3), and Nf1OPG + entrectinib (n = 6) groups. f, Plotting optic nerve volume against proliferation shows OPG (tumour) in all Nf1OPG + entrectinib mice. Tumour is gated against volume and proliferation of 16-week-old wild-type mice (22 mice raised in regular light cycles; grey regions mark the range of values). Unpaired t-test with Welch’s correction (c, BDNF; e, proliferation). Brown-Forsythe and Welch ANOVA tests with Dunnett’s T3 correction for multiple comparison (c, NLGN1, NLGN2 and NLGN3, F=44.85, P < 0.0001). Mann–Whitney test (e, volume). Data are mean ± s.e.m. NS, not significant (P > 0.05). Each data point is one well in c. Each data point is one mouse in e, f. All tests were two-sided. Illustrations created with BioRender.com (a).
Extended Data Fig. 5 |
Extended Data Fig. 5 |. NLGN3 expression analyses in human pilocytic astrocytomas.
a, qRT–PCR using Washington University School of Medicine (WUSM) samples reveals increased NLGN3 levels in NF1-associated pilocytic astrocytoma (NF1-PA) (n = 9); NLGN3 levels were not significantly increased in sporadic pilocytic astrocytoma (S-PA) in this dataset (n = 14), relative to non-neoplastic brain controls (NB) (n = 9); the same non-neoplastic brain cases are shown in each comparison). These results should be considered in the context of the larger dataset presented in b and the cases presented in Fig. 2e. b, NLGN3 expression of a previously published microarray dataset (GSE44971) reveals increased NLGN3 levels in pilocytic astrocytoma (n = 49), relative to non-neoplastic brain controls (n = 9). Red dots, NF1-associated pilocytic astrocytomas. c, No association between NLGN3 expression and sex, location or age was observed in the pilocytic astrocytoma RNA-seq dataset. From left to right, n = 6, 3, 6, 4, 4, 5, 6, 4, 4, 5, 6 and 4 samples. d, NLGN3 expression of the previously published microarray dataset reveals increased NLGN3 levels in all methylation groups, pilocytic astrocytomas located in cerebellum and diencephalon, relative to non-neoplastic brains. From left to right, n = 9, 12, 28, 9, 9, 35, 5, 6 and 3 samples. e, GO terms and differentially expressed genes in NLGN3-high and NLGN3-low groups from the pilocytic astrocytoma RNA-seq database. f, Gene set enrichment analysis reveals neuronal and immune signatures in NLGN3-high and NLGN3-low pilocytic astrocytomas, respectively. Mann–Whitney test (a, NB versus NF1-PA). Unpaired t-test with Welch’s correction (a, NB versus S-PA; b). Brown–Forsythe and Welch ANOVA tests with Dunnett’s T3 correction for multiple comparison (c, all comparisons are not statistically significant; d, methylation, F = 11.71, P = 0.0001; d, location, F = 23.48, P < 0.0001). Data are mean ± s.e.m. Each data point is one human sample in ad. All tests were two-sided.
Extended Data Fig. 6 |
Extended Data Fig. 6 |. Optogenetic stimulation of retina + optic nerve explants.
a, Immunoblotting of retina + optic nerve tissues reveals no change in cleaved caspase-3 (CC3) levels (normalized to the amount of total caspase-3 (Cas-3)) between the unstimulated (unstim) and stimulated (stim) groups. n = 3 mice. P = 0.8938. b, Immunoblotting reveals the same levels of shed NLGN3 (s-NLGN3) in the conditioned medium of unstimulated Nf1+/+;Thy1::ChR2 (n = 6 mice) and Nf1+/−;Thy1::ChR2 (n = 6 mice) retina + optic nerve explants. c, Immunoblotting of optic nerve lysate reveals same levels of shed NLGN3 in dark-reared wild-type (n = 3) and Nf1+/− (n = 5) mice. d, ADAM10-mediated NLGN3 shedding. e, Immunoblotting reveals reduced shed NLGN3 levels in optic nerves of Nf1+/− mice after treatment with the ADAM10 inhibitor (ADAM10i) (GI254023X) (n = 4 mice), relative to vehicle (n = 3 mice) treatment. f, Immunoblotting of conditioned medium reveals increased ADAM10 in light-stimulated Nf1+/−;Thy1::ChR2 (left) (n = 7 mice), but not Nf1+/+;Thy1::ChR2 (right) (n = 3 mice), retina + optic nerve explants relative to their unstimulated (dark + TTX) counterparts. ns, not significant. Data are mean ± s.e.m. Wilcoxon test (a, f). Unpaired t-test with Welch’s correction (b, c, e). Each data point is one mouse in ac, e, f. All tests were two-sided. Illustrations created with BioRender.com (d).
Extended Data Fig. 7 |
Extended Data Fig. 7 |. Targeting NLGN3 shedding prevents Nf1-OPG proliferation.
a, Representative Ki67 immunohistochemistry images of wild-type + vehicle (n = 3), Nf1OPG + vehicle 6–16 weeks old (n = 7) and Nf1OPG + ADAM10i 6–16 weeks old (n = 9) groups. b, Representative Ki67 immunohistochemistry images of Nf1OPG + vehicle (n = 9) and Nf1OPG + ADAM10i 12–16 weeks old (n = 8) groups. Arrows, Ki67+ cells. Scale bar, 20 μm.
Fig. 1 |
Fig. 1 |. The initiation and maintenance of Nf1-OPGs requires retinal activity.
a, Schematic depicting the optic nerve (RGC (orange) axons) with optic glioma cells (green) and the position of the fibre optic. b, Optogenetic stimulation paradigm. Yellow bars, 12-h light/12-h dark cycles. Hatched pattern, optogenetic stimulation period. Arrow, tumour initiation. w, weeks of age. c, Optic nerves from unstimulated (n = 6) and stimulated (n = 6) Nf1OPG;Thy1::ChR2-YFP mice. Asterisks, region of volume measurement. Scale bar, 1 mm. d, Dark-rearing paradigm. Half yellow and grey lightbulbs + yellow bars, regular 12-h light/12-h dark cycles (12:12). Grey lightbulbs + black bars, dark-rearing (24-h dark) periods. Arrow, tumour initiation. n = 5 (wild type (WT) 12:12), 11 (Nf1OPG 12:12), 7 (Nf1OPG dark, 9–16 weeks old), and 9 (Nf1OPG dark, 12–16 weeks old) mice. e, Optic nerve volume (left) and proliferation (per cent Ki67+ cells) (right) of mice indicated in d. f, Optic nerve proliferation and volume plots for wild-type (orange) and Nf1OPG mice reared in regular light cycles (yellow) or dark-reared from 9–16 weeks (cyan) or 12–16 weeks (dark blue) of age. Tumour is gated against volume and proliferation of 16-week-old wild-type mice (22 mice raised in regular light cycles; grey regions mark the range of values). g, Representative immunofluorescence images showing RGCs (white, BRN3A+; blue, DAPI) in the RGC layer, and quantification of per cent BRN3A+ cells. n = 5 (wild type 12:12), 13 (Nf1OPG 12:12), and 7 (Nf1OPG dark, 6–16 weeks old). Scale bar, 10 μm. h, i, As in e, f, with dark-rearing from 6 to 16 weeks (cyan) or 6–12 weeks (dark blue) of age. n = 5 (wild type 12:12), 7 (Nf1OPG 12:12), 6 (Nf1OPG dark, 6–16 weeks old), and 12 (Nf1OPG dark, 6–12 weeks old). Data are mean ± s.e.m. NS, not significant (P > 0.05). Each data point is one mouse in c, ei. Unpaired t-test with Welch’s correction (c). Brown–Forsythe and Welch analysis of variance (ANOVA) tests with Dunnett’s T3 correction for multiple comparison (e, volume, F = 13.67, P < 0.0001; g, F = 9.054, P = 0.0048; h, volume, F = 29.51, P < 0.0001). Kruskal–Wallis test with Dunn’s correction for multiple comparisons (e, h, proliferation, P < 0.0001). All tests were two-sided. Illustrations created with BioRender.com (a, d).
Fig. 2 |
Fig. 2 |. NLGN3 promotes Nf1 optic gliomagenesis.
a, Nf1-OPG cell proliferation (EdU incorporation) in response to recombinant NLGN3. n = 4,3,3 and 3 wells (vehicle, 10 nM, 30 nM and 70 nM, respectively). OPG proliferation index, per cent EdU+ cells relative to vehicle group. b, Nlgn3 qRT–PCR of Nf1-OPG cells incubated with vehicle or 30 nM NLGN3. n = 3 wells per group. Nlgn3 index, Nlgn3 mRNA levels relative to vehicle group. c, RNA-seq of optic nerves from four different Nf1-OPG genetically engineered mouse models (GEMMs) (OPG-1 to OPG-4) and wild-type mice demonstrates increased Nlgn3 levels in OPGs relative to wild-type optic nerves at 12 weeks of age. Padj, adjusted P value. d, NLGN3 levels in optic nerves from Nf1OPG (OPG-1) (n = 7) relative to wild-type (n = 6) mice at 12 weeks of age, normalized to β-actin (NLGN3 index). e, NLGN3 mRNA levels in NF1-associated human pilocytic astrocytoma (NF1-PA) (n = 9), sporadic pilocytic astrocytoma (S-PA) (n = 10) and non-neoplastic brain (NB) (n = 5) samples. f, Nf1OPGNlgn3KO mouse generation. Created with BioRender.com. g, Representative Ki67 immunohistochemistry images from wild-type, Nlgn3KO, Nf1OPG and Nf1OPGNlgn3KO mice (n = 3, 4, 7 and 8, respectively). Arrows, Ki67+ cells. Scale bar, 20 μm. h, Optic nerve volume (left) and proliferation (per cent Ki67+ cells) (right) of wild-type (n = 3), Nlgn3KO (n = 4), Nf1OPG (n = 7) and Nf1OPGNlgn3KO (n = 8) mice reared in regular light cycles. i, Optic nerve volume and proliferation plots (as in Fig. 1) shows no OPG (tumour) in 6 out of 8 Nf1OPGNlgn3KO mice. NS, not significant (P > 0.05). Data are mean ± s.e.m. Each data point is one mouse in d, h, i. Brown–Forsythe and Welch ANOVA tests with Dunnett’s T3 correction for multiple comparison (a, F = 27.46, P = 0.0001; e, F = 7.16, P = 0.011; h, volume, F = 10.25, P = 0.0004). Unpaired t-test with Welch’s correction (b, d). Kruskal–Wallis test with Dunn’s correction for multiple comparisons (h, proliferation, P = 0.0016). All tests were two-sided.
Fig. 3 |
Fig. 3 |. Nf1 mutation increases activity-regulated NLGN3 shedding and inhibition of NLGN3 shedding decreases optic glioma initiation and growth.
a, intravitreal tetrodotoxin (TTX) injection. b, Immunoblot of NLGN3 shed from the optic nerves of mice treated with TTX (n = 4 mice), relative to Nf1+/− mice treated with vehicle (n = 3 mice) (shed NLGN3 index). c, Immunoblot of shed NLGN3 in conditioned medium from retina and optic nerve preparations of light-stimulated Nf1+/−;Thy1::ChR2 (right) (n = 7) and Nf1+/+;Thy1::ChR2 (left) (n = 6) mice, relative to their unstimulated (dark + TTX) counterparts (shed NLGN3 index). d, Rearing in dark (grey lightbulb + black bar) or regular 12:12 light cycles (half yellow and grey lightbulbs + yellow bar) of Nf1+/− and wild-type mice from 6 to 9 weeks of age. e, Immunoblot of NLGN3 shed from the optic nerves, from Nf1+/+ (left) (n = 9 dark-reared, and 8 regular-light-reared mice) and Nf1+/− (right) (n = 5 dark-reared, and 4 regular-light-reared mice). The shed NLGN3 index indicates levels of shed NLGN3 relative to the dark group and normalized to β-actin. f, Paradigm for the treatment with ADAM10 inhibitor (ADAM10i). Blue bar indicates administration ofADAM10i (GI254023X). Arrow, tumour initiation. g, Optic nerve volume (left) and proliferation (per cent Ki67+ cells) (right) of wild-type + vehicle (n = 3), Nf1OPG + vehicle (n = 7) and Nf1OPG + ADAM10i 6–16-week-old (n = 9) groups. h, Optic nerve volume and proliferation plots. Tumours are gated as in Fig. 1. i, As in f, with ADAM10i administration from 12 to 16 weeks of age. j, Optic nerve volume (left) and proliferation (per cent Ki67+ cells) (right) of Nf1OPG + vehicle (n = 9) and Nf1OPG + ADAM10i 12–16-week-old (n = 8) groups. k, As in h, with ADAM10i administered from 12 to 16 weeks of age. Data are mean ± s.e.m. NS, not significant (P > 0.05). Each data point is one mouse in b, e, g, h, j, k. Each data point is one eye in c. Unpaired t-test with Welch’s correction (b, e,j). Wilcoxon test (c). Brown–Forsythe and Welch ANOVA tests with Dunnett’s T3 correction for multiple comparison (g, volume, F = 9.292, P = 0.0038); g, proliferation, F = 8.564, P = 0.0109). All tests were two-sided. Illustrations created with BioRender.com (a, d).

Comment in

References

    1. Monje M et al. Roadmap for the emerging field of cancer neuroscience. Cell 181, 219–222 (2020). - PMC - PubMed
    1. Zahalka AH & Frenette PS Nerves in cancer. Nat. Rev. Cancer 20, 143–157 (2020). - PMC - PubMed
    1. Listernick R, Louis DN, Packer RJ & Gutmann DH Optic pathway gliomas in children with neurofibromatosis 1: consensus statement from the NF1 Optic Pathway Glioma Task Force. Ann. Neurol 41, 143–149 (1997). - PubMed
    1. Listernick R, Charrow J, Greenwald M & Mets M Natural history of optic pathway tumors in children with neurofibromatosis type 1: a longitudinal study. J. Pediatr 125, 63–66 (1994). - PubMed
    1. Bajenaru ML et al. Optic nerve glioma in mice requires astrocyte Nf1 gene inactivation and Nf1 brain heterozygosity. Cancer Res. 63, 8573–8577 (2003). - PubMed

Publication types

MeSH terms