. 2021 Jun;594(7862):265-270.
doi: 10.1038/s41586-021-03583-3. Epub 2021 May 26.

Swarm Learning for decentralized and confidential clinical machine learning

Stefanie Warnat-Herresthal #  1   2 Hartmut Schultze #  3 Krishnaprasad Lingadahalli Shastry #  3 Sathyanarayanan Manamohan #  3 Saikat Mukherjee #  3 Vishesh Garg #  3   4 Ravi Sarveswara #  3 Kristian Händler #  1   5 Peter Pickkers #  6 N Ahmad Aziz #  7   8 Sofia Ktena #  9 Florian Tran  10   11 Michael Bitzer  12 Stephan Ossowski  13   14 Nicolas Casadei  13   14 Christian Herr  15 Daniel Petersheim  16 Uta Behrends  17 Fabian Kern  18 Tobias Fehlmann  18 Philipp Schommers  19 Clara Lehmann  19   20   21 Max Augustin  19   20   21 Jan Rybniker  19   20   21 Janine Altmüller  22 Neha Mishra  11 Joana P Bernardes  11 Benjamin Krämer  23 Lorenzo Bonaguro  1   2 Jonas Schulte-Schrepping  1   2 Elena De Domenico  1   5 Christian Siever  3 Michael Kraut  1   5 Milind Desai  3 Bruno Monnet  3 Maria Saridaki  9 Charles Martin Siegel  3 Anna Drews  1   5 Melanie Nuesch-Germano  1   2 Heidi Theis  1   5 Jan Heyckendorf  23 Stefan Schreiber  10 Sarah Kim-Hellmuth  16 COVID-19 Aachen Study (COVAS)Jacob Nattermann  24   25 Dirk Skowasch  26 Ingo Kurth  27 Andreas Keller  18   28 Robert Bals  15 Peter Nürnberg  22 Olaf Rieß  13   14 Philip Rosenstiel  11 Mihai G Netea  29   30 Fabian Theis  31 Sach Mukherjee  32 Michael Backes  33 Anna C Aschenbrenner  1   2   5   29 Thomas Ulas  1   2 Deutsche COVID-19 Omics Initiative (DeCOI)Monique M B Breteler #  7   34 Evangelos J Giamarellos-Bourboulis #  9 Matthijs Kox #  6 Matthias Becker #  1   5 Sorin Cheran #  3 Michael S Woodacre #  3 Eng Lim Goh #  3 Joachim L Schultze #  35   36   37
Collaborators, Affiliations

Swarm Learning for decentralized and confidential clinical machine learning

Stefanie Warnat-Herresthal et al. Nature. 2021 Jun.

Abstract

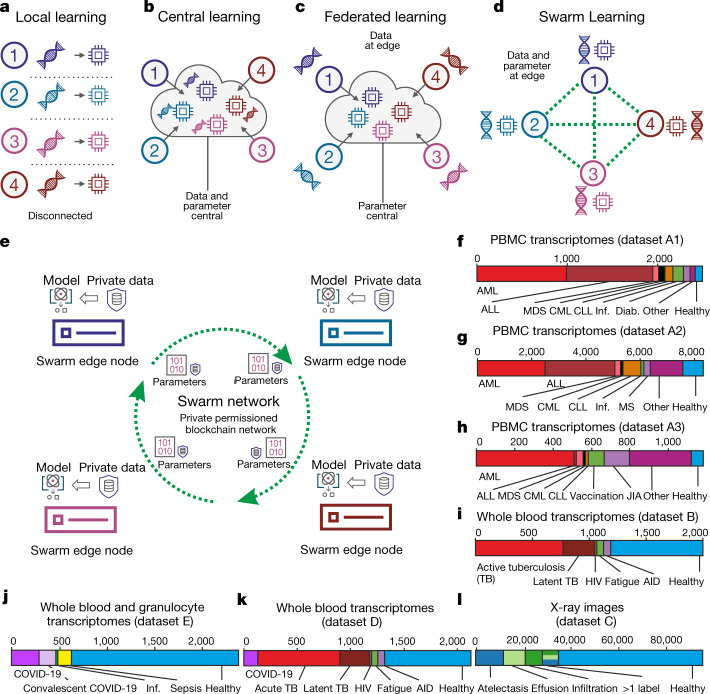
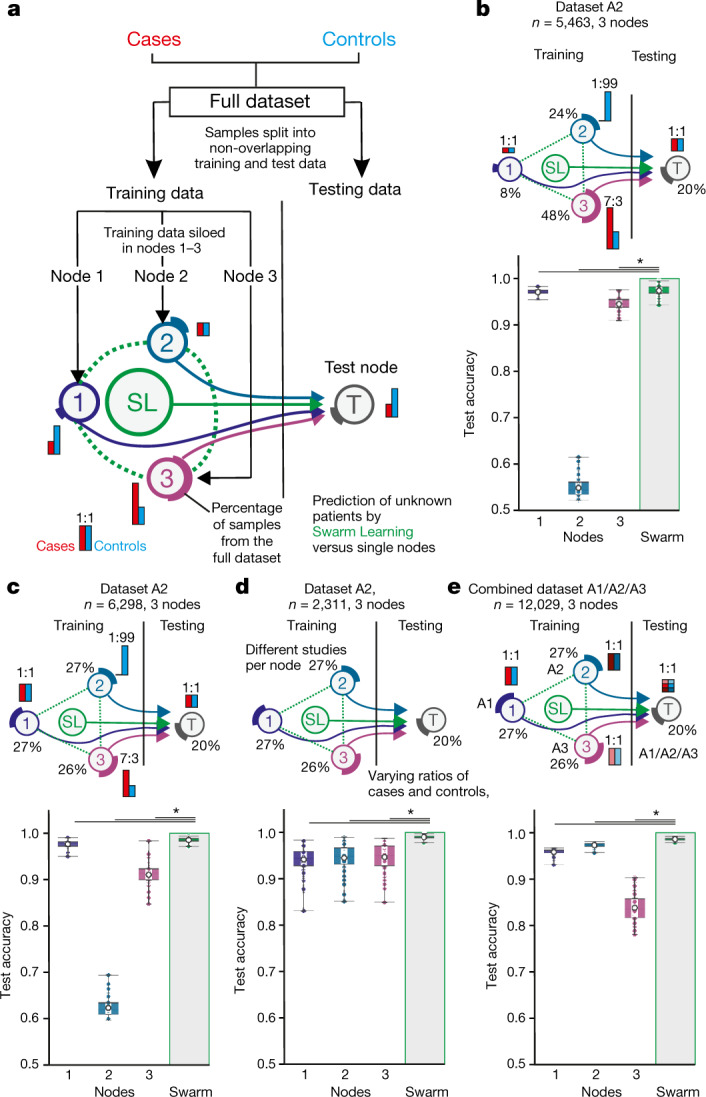
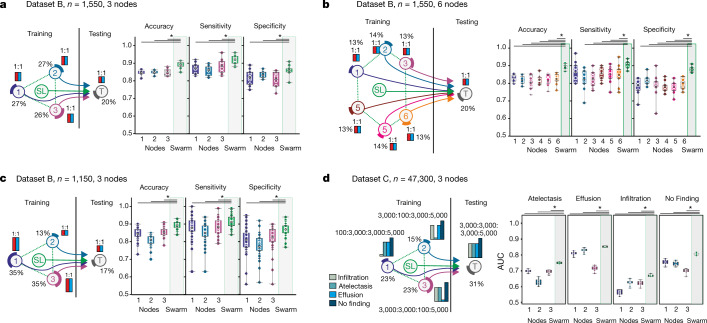
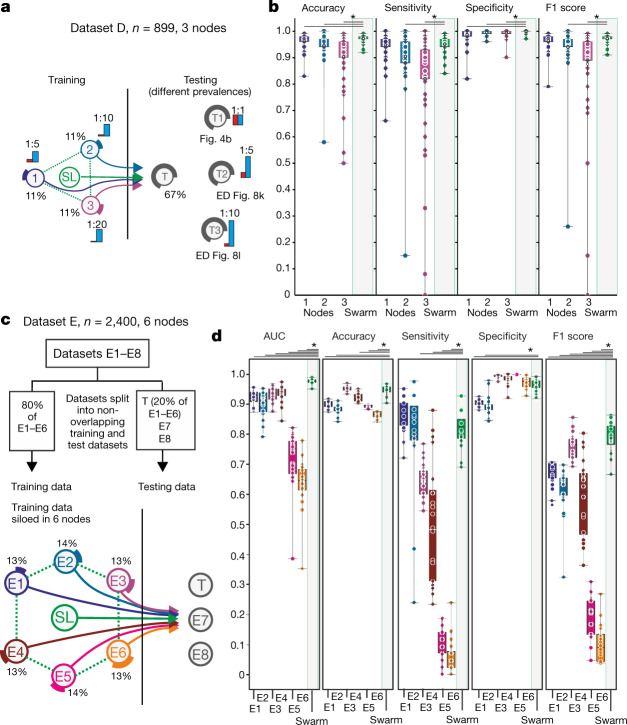
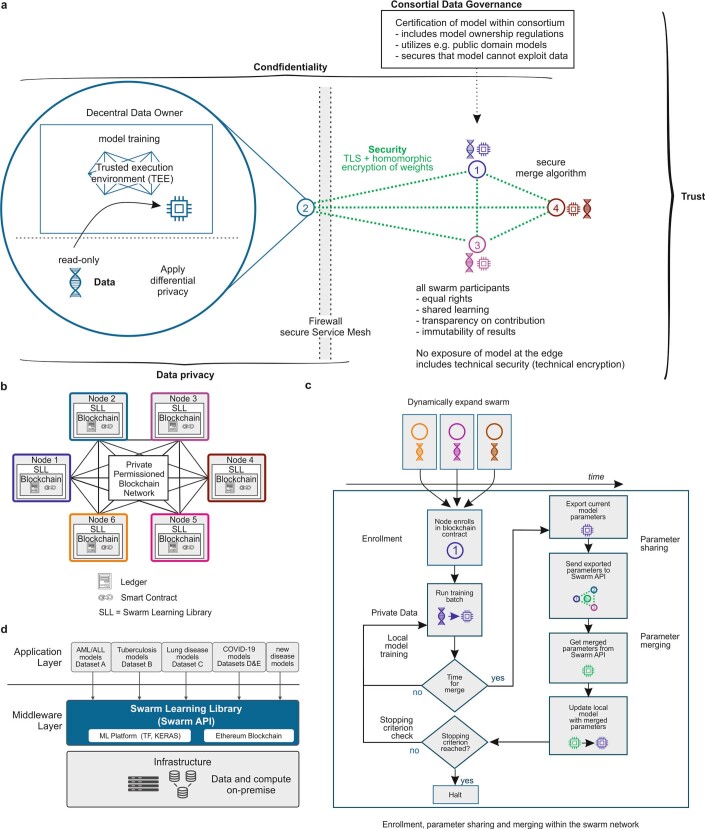
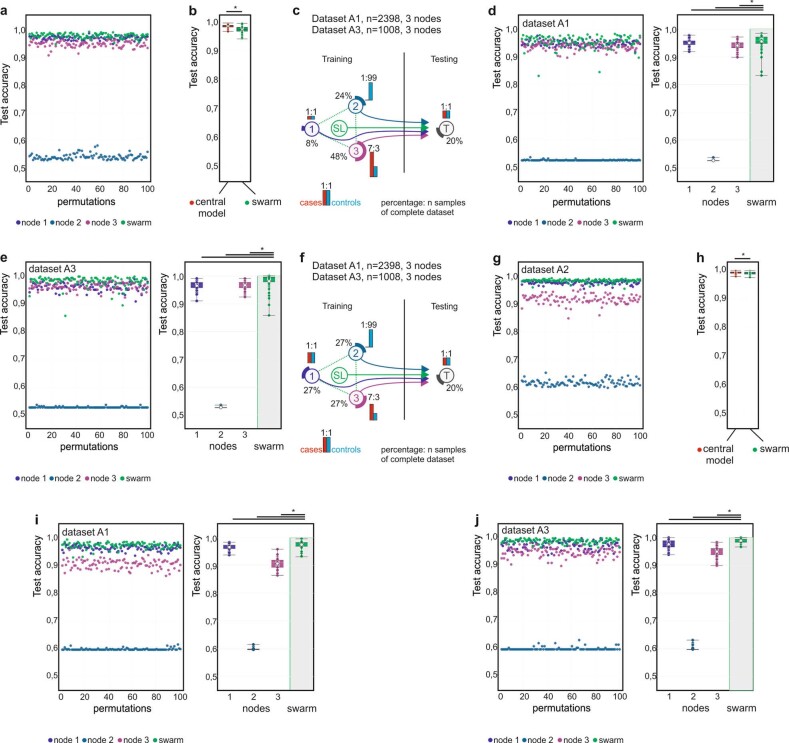
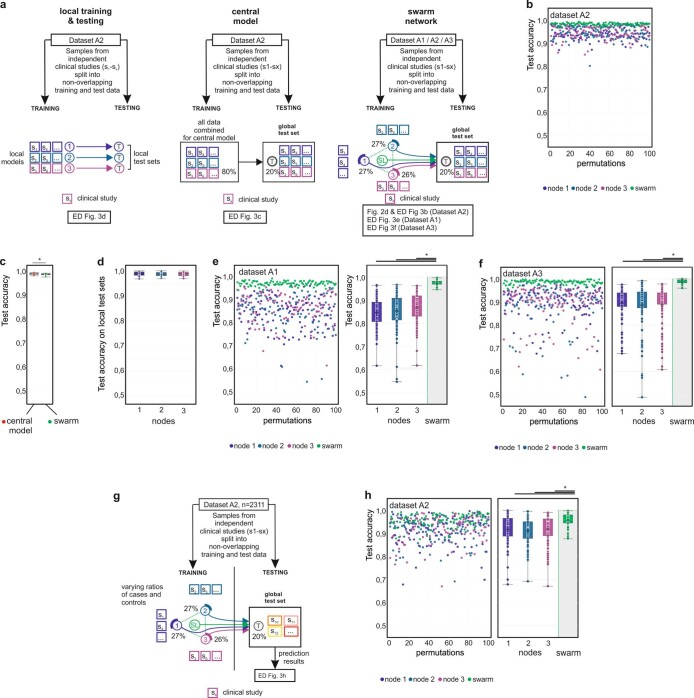
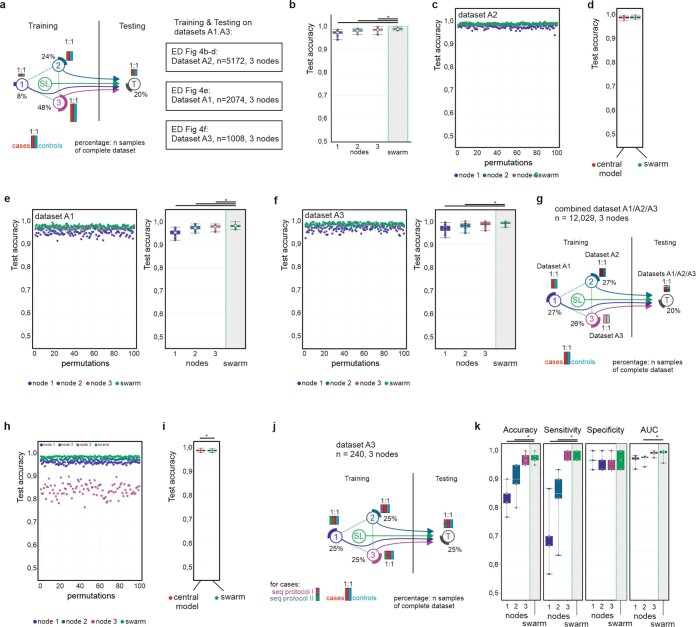
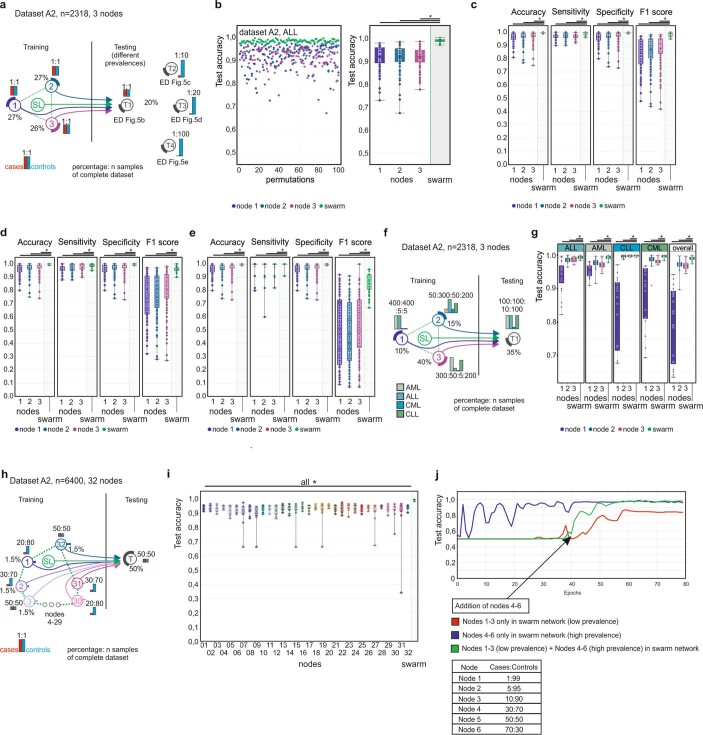
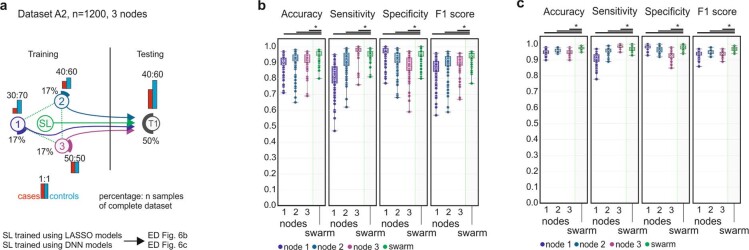
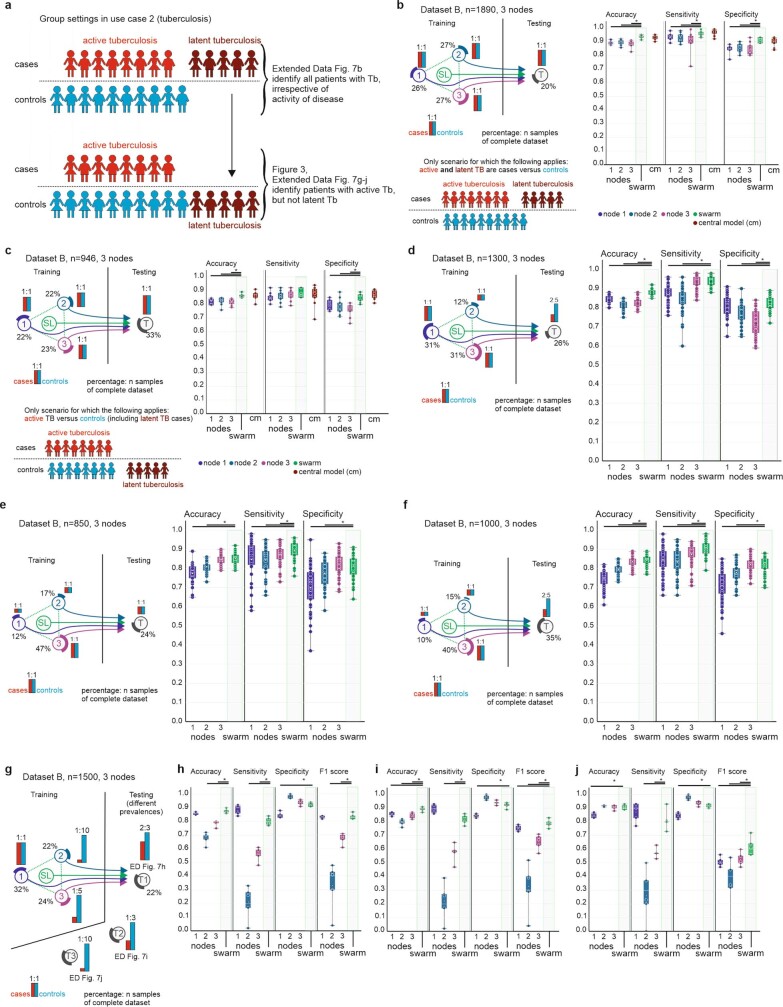
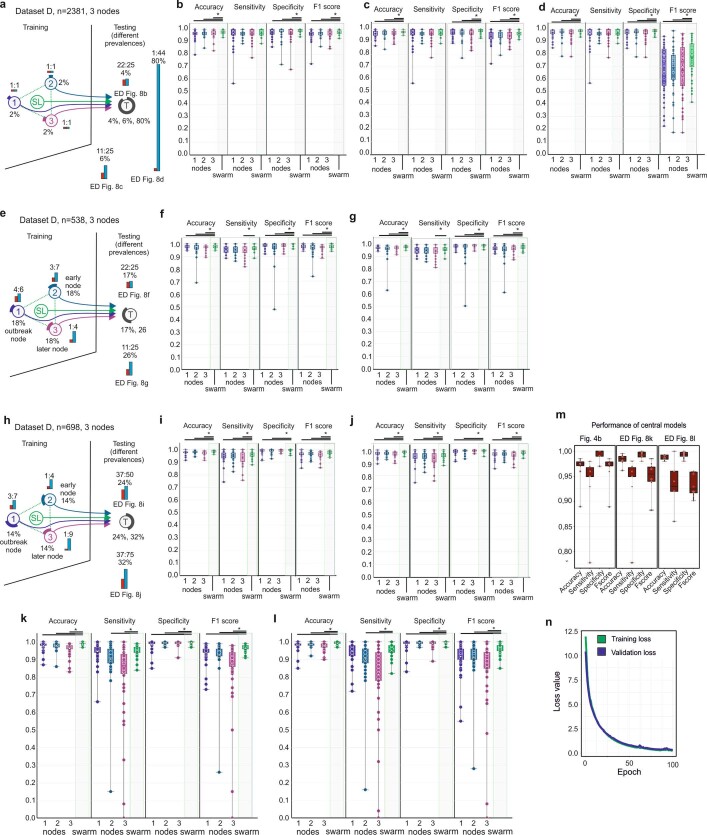
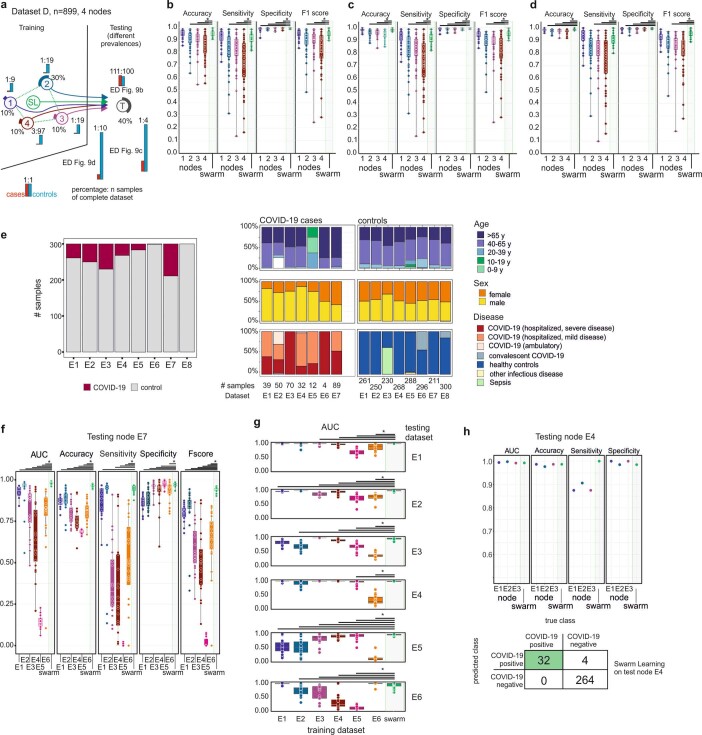
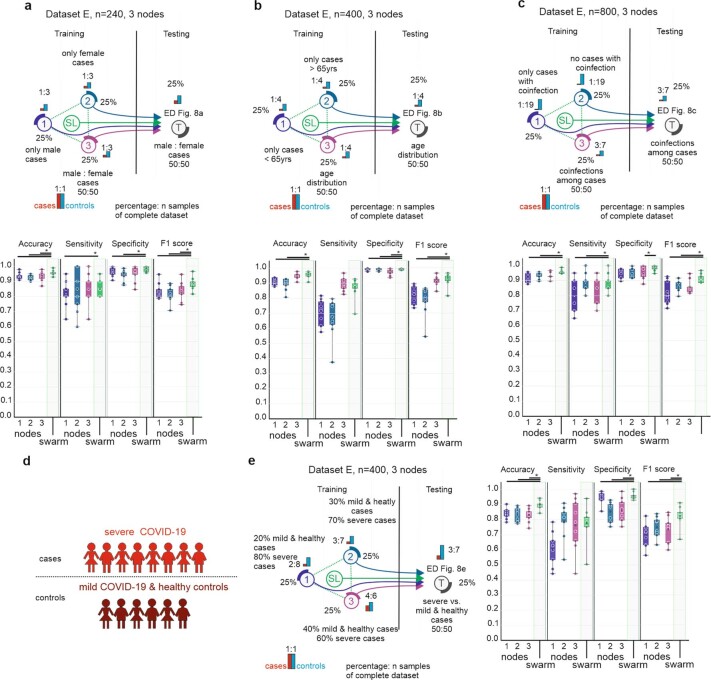
Fast and reliable detection of patients with severe and heterogeneous illnesses is a major goal of precision medicine1,2. Patients with leukaemia can be identified using machine learning on the basis of their blood transcriptomes3. However, there is an increasing divide between what is technically possible and what is allowed, because of privacy legislation4,5. Here, to facilitate the integration of any medical data from any data owner worldwide without violating privacy laws, we introduce Swarm Learning-a decentralized machine-learning approach that unites edge computing, blockchain-based peer-to-peer networking and coordination while maintaining confidentiality without the need for a central coordinator, thereby going beyond federated learning. To illustrate the feasibility of using Swarm Learning to develop disease classifiers using distributed data, we chose four use cases of heterogeneous diseases (COVID-19, tuberculosis, leukaemia and lung pathologies). With more than 16,400 blood transcriptomes derived from 127 clinical studies with non-uniform distributions of cases and controls and substantial study biases, as well as more than 95,000 chest X-ray images, we show that Swarm Learning classifiers outperform those developed at individual sites. In addition, Swarm Learning completely fulfils local confidentiality regulations by design. We believe that this approach will notably accelerate the introduction of precision medicine.


Conflict of interest statement

H.S., K.L.S., S. Manamohan, Saikat Mukherjee, V.G., R.S., C.S., M.D., B.M, C.M.S., S.C., M.S.W. and E.L.G. are employees of Hewlett Packard Enterprise. Hewlett Packard Enterprise developed the SLL in its entirety as described in this work and has submitted multiple associated patent applications. E.J.G.-B. received honoraria from AbbVie USA, Abbott CH, InflaRx GmbH, MSD Greece, XBiotech Inc. and Angelini Italy and independent educational grants from AbbVie, Abbott, Astellas Pharma Europe, AxisShield, bioMérieux Inc, InflaRx GmbH, and XBiotech Inc. All other authors declare no competing interests.

Figures

Fig. 1
Fig. 1. Concept of Swarm Learning.
a, Illustration of the concept of local learning with data and computation at different, disconnected locations. b, Principle of cloud-based machine learning. c, Federated learning, with data being kept with the data contributor and computing performed at the site of local data storage and availability, but parameter settings orchestrated by a central parameter server. d, Principle of SL without the need for a central custodian. e, Schematic of the Swarm network, consisting of Swarm edge nodes that exchange parameters for learning, which is implemented using blockchain technology. Private data are used at each node together with the model provided by the Swarm network. fl, Descriptions of the transcriptome datasets used. f, g, Datasets A1 (f; n = 2,500) and A2 (g; n = 8,348): two microarray-based transcriptome datasets of PBMCs. h, Dataset A3: 1,181 RNA-seq-based transcriptomes of PBMCs. i, Dataset B: 1,999 RNA-seq-based whole blood transcriptomes. j, Dataset E: 2,400 RNA-seq-based whole blood and granulocyte transcriptomes. k, Dataset D: 2,143 RNA-seq-based whole blood transcriptomes. l, Dataset C: 95,831 X-ray images. CML, chronic myeloid leukaemia; CLL, chronic lymphocytic leukaemia; Inf., infections; Diab., type II diabetes; MDS, myelodysplastic syndrome; MS, multiple sclerosis; JIA, juvenile idiopathic arthritis; TB, tuberculosis; HIV, human immunodeficiency virus; AID, autoimmune disease.
Fig. 2
Fig. 2. Swarm Learning to predict leukaemias from PBMC data.
a, Overview of the experimental setup. Data consisting of biological replicates are split into non-overlapping training and test sets. Training data are siloed in Swarm edge nodes 1–3 and testing node T is used as independent test set. SL is achieved by integrating nodes 1–3 for training following the procedures described in the Supplementary Information. Red and blue bars illustrate the scenario-specific distribution of cases and controls among the nodes; percentages depict the percentage of samples from the full dataset. b, Scenario using dataset A2 with uneven distributions of cases and controls and of samples sizes among nodes. c, Scenario with uneven numbers of cases and controls at the different training nodes but similar numbers of samples at each node. d, Scenario with samples from independent studies from A2 sampled to different nodes, resulting in varying numbers of cases and controls per node. e, Scenario in which each node obtained samples from different transcriptomic technologies (nodes 1–3: datasets A1–A3). The test node obtained samples from each dataset A1–A3. be, Box plots show accuracy of 100 permutations performed for the 3 training nodes individually and for SL. All samples are biological replicates. Centre dot, mean; box limits, 1st and 3rd quartiles; whiskers, minimum and maximum values. Accuracy is defined for the independent fourth node used for testing only. Statistical differences between results derived by SL and all individual nodes including all permutations performed were calculated using one-sided Wilcoxon signed-rank test with continuity correction; *P < 0.05, exact P values listed in Supplementary Table 5.
Fig. 3
Fig. 3. Swarm Learning to identify patients with TB or lung pathologies.
ac, Scenarios for the prediction of TB with experimental setup as in Fig. 2a. a, Scenario with even number of cases at each node; 10 permutations. b, Scenario similar to a but with six training nodes; 10 permutations. c, Scenario in which the training nodes have evenly distributed numbers of cases and controls at each training node, but node 2 has fewer samples; 50 permutations. d, Scenario for multilabel prediction of dataset C with uneven distribution of diseases at nodes; 10 permutations. ad, Box plots show accuracy of all permutations for the training nodes individually and for SL. All samples are biological replicates. Centre dot, mean; box limits, 1st and 3rd quartiles; whiskers, minimum and maximum values. Accuracy is defined for the independent fourth node used for testing only. Statistical differences between results derived by SL and all individual nodes including all permutations performed were calculated with one-sided Wilcoxon signed rank test with continuity correction; *P < 0.05, exact P values listed in Supplementary Table 5.
Fig. 4
Fig. 4. Identification of patients with COVID-19 in an outbreak scenario.
a, An outbreak scenario for COVID-19 using dataset D with experimental setup as in Fig. 2a. b, Evaluation of a with even prevalence showing accuracy, sensitivity, specificity and F1 score of 50 permutations for each training node and SL, on the test node. c, An outbreak scenario with dataset E, particularly E1–6 with an 80:20 training:test split. Training data are distributed to six training nodes, independent test data are placed at the test node. d, Evaluation of c showing AUC, accuracy, sensitivity, specificity and F1 score of 20 permutations. All samples are biological replicates. Centre dot, mean; box limits, 1st and 3rd quartiles; whiskers, minimum and maximum values. Statistical differences between results derived by SL and all individual nodes including all permutations performed were calculated with one-sided Wilcoxon signed-rank test with continuity correction; *P < 0.05, all P values listed in Supplementary Table 5.
Extended Data Fig. 1
Extended Data Fig. 1. Corresponding to Fig. 1.
a, Overview of SL and the relationship to data privacy, confidentiality and trust. b, Concept and outline of the private permissioned blockchain network as a layer of the SL network. Each node consists of the blockchain, including the ledger and smart contract, as well as the SLL with the API to interact with other nodes within the network. c, The principles of the SL workflow once the nodes have been enrolled within the Swarm network via private permissioned blockchain contract and dynamic onboarding of new Swarm nodes. d, Application and middleware layer as part of the SL concept.
Extended Data Fig. 2
Extended Data Fig. 2. Scenario corresponding to Fig. 2b, c in datasets A1 and A3.
Main settings and representation of schema and data visualization as described in Fig. 2a. a, Evaluation of test accuracy for 100 permutations of the scenario shown in Fig. 2b. b, Evaluation of SL versus central model for the scenario shown in Fig. 2b for 100 permutations. c, Scenario with different prevalences of AML and numbers of samples at each training node. The test dataset has an even distribution. d, Evaluation of test accuracy for 100 permutations of dataset A1 per node and SL. e, Evaluation using dataset A3 for 100 permutations. f, Scenario with similar training set sizes per node but decreasing prevalence. The test dataset ratio is 1:1. g, Evaluation of test accuracy for 100 permutations of the scenario shown in Fig. 2c. h, Evaluation of SL versus central model of the scenario shown in Fig. 2c for 100 permutations. i, Evaluation of test accuracy over 100 permutations for dataset A1 with the scenario shown in f. j, Evaluation of test accuracy over 100 permutations for dataset A3 with the scenario shown in f. b, d, e, hj, Box plots show representation of accuracy of 100 permutations performed for the 3 training nodes individually as well as the results obtained by SL. All samples are biological replicates. Centre dot, mean; box limits, 1st and 3rd quartiles; whiskers, minimum and maximum values. Accuracy is defined for the independent fourth node used for testing only. Statistical differences between results derived by SL and all individual nodes including all permutations performed were calculated with one-sided Wilcoxon signed rank test with continuity correction; *P < 0.05, exact P values listed in Supplementary Table 5.
Extended Data Fig. 3
Extended Data Fig. 3. Scenario to test for batch effects of siloed studies in datasets A1–A3 and scenario with multiple consortia.
Main settings and representation of schema and data visualization are as in Fig. 2a. a, Scenario with training nodes coming from independent clinical studies for local models (left), central model (middle) and the Swarm network (right) and testing on a non-overlapping global test with samples from the same studies. b, Evaluation of test accuracy over 100 permutations for dataset A2 with the scenario shown in a (right) and Fig. 2d. c, Comparison of test accuracy between central model (a, middle) and SL (a, right). d, Comparison of test accuracy on the local test datasets (a, left) for 100 permutations. e, Evaluation of test accuracy of individual nodes versus SL over 100 permutations for dataset A1 when training nodes have data from independent clinical studies. f, Evaluation of test accuracy of individual nodes versus SL over 100 permutations for dataset A3 when training nodes have data from independent clinical studies. g, Scenario with three consortia contributing training nodes and a fourth one providing the testing node. h, Evaluation of test accuracy for scenario shown in g over 100 permutations for dataset A2. df, h, Box plots show representation of accuracy of all permutations performed for the 3 training nodes individually as well as the results obtained by SL (d only for local models). All samples are biological replicates. Centre dot, mean; box limits, 1st and 3rd quartiles; whiskers, minimum and maximum values. Performance measures are defined for the independent fourth node used for testing only. Statistical differences between results derived by SL and all individual nodes including all permutations performed were calculated with one-sided Wilcoxon signed rank test with continuity correction; *P < 0.05, exact P values are listed in Supplementary Table 5.
Extended Data Fig. 4
Extended Data Fig. 4. Scenario corresponding to Fig. 2e in datasets A1 and A3 and scenario using different data generation methods in each training node.
Main settings and representation of schema and data visualization are as in Fig. 2a. a, Scenario with even distribution of cases and controls at each training node and the test node, but different numbers of samples at each node and overall increase in numbers of samples. b, c, Test accuracy for evaluation of dataset A2 over 100 permutations. d, Comparison of central model with SL over 100 permutations. e, Test accuracy for evaluation of dataset A1 over 99 permutations. f, Test accuracy for evaluation of dataset A3 over 100 permutations. g, Scenario where datasets A1, A2, and A3 are assigned to a single training node each. h, Evaluation of test accuracy over 100 permutations. i, Comparison of the test accuracy of central model and SL over 98 permutations. j, Scenario similar to g but where the nodes use datasets from different RNA-seq protocols. k, Evaluation of results for accuracy, AUC, sensitivity, and specificity over five permutations. df, i, k, Box plots show predictive performance over all permutations performed for the three training nodes individually as well as the results obtained by SL. All samples are biological replicates. Centre dot, mean; box limits, 1st and 3rd quartiles; whiskers, minimum and maximum values. Performance measures are defined for the independent fourth node used for testing only. Statistical differences between results derived by SL and all individual nodes including all permutations performed were calculated with one-sided Wilcoxon signed rank test with continuity correction; *P < 0.05, exact P values listed in Supplementary Table 5.
Extended Data Fig. 5
Extended Data Fig. 5. Scenario for ALL in dataset 2 and multi-class prediction and expansion of SL.
Main settings are identical to what is described in Fig. 2a. Here cases are samples derived from patients with ALL, while all other samples are controls (including AML). a, Scenario for the detection of ALL in dataset A2. The training sets are evenly distributed among the nodes with varying prevalence at the testing node. Data from independent clinical studies are samples to each node, as described for AML in Fig. 2d. b, Evaluation of scenario in a for test accuracy over 100 permutations with a prevalence ratio of 1:1. c, Evaluation using a test dataset with prevalence ratio of 10:100 over 100 permutations. d, Evaluation using a test dataset with prevalence ratio of 5:100 over 100 permutations. e, Evaluation using a test dataset with prevalence ratio of 1:100. f, Scenario for multi-class prediction of different types of leukaemia in dataset A2. Each node has a different prevalence. g, Test accuracy for the different types of leukaemia over 20 permutations. h, Scenario that simulates 32 small Swarm nodes. i, Evaluation of test accuracy for the 32 nodes and the Swarm over 10 permutations. j, Development of accuracy over training epochs with addition of new nodes. be, g, i, Box plots show performance of all permutations performed for the training nodes individually as well as the results obtained by SL. All samples are biological replicates. Centre dot, mean; box limits, 1st and 3rd quartiles; whiskers, minimum and maximum values. Performance measures are defined for the independent test node used for testing only. Statistical differences between results derived by SL and all individual nodes including all permutations performed were calculated with one-sided Wilcoxon signed rank test with continuity correction; *P < 0.05, exact P values listed in Supplementary Table 5.
Extended Data Fig. 6
Extended Data Fig. 6. Comparison of LASSO and neural networks.
a, Scenario for training different models in the Swarm. b, Evaluation of a LASSO model for accuracy, sensitivity, specificity and F1 score over 100 permutations. c, Evaluation of a Neural Network model for accuracy, sensitivity, specificity and F1 score over 100 permutations. b, c, Box plots show performance of all permutations performed for the training nodes individually as well as the results obtained by SL. All samples are biological replicates. Centre dot, mean; box limits, 1st and 3rd quartiles; whiskers, minimum and maximum values. Performance measures are defined for the independent fourth node used for testing only. Statistical differences between results derived by SL and all individual nodes including all permutations performed were calculated with one-sided Wilcoxon signed rank test with continuity correction; *P < 0.05, exact P values listed in Supplementary Table 5.
Extended Data Fig. 7
Extended Data Fig. 7. Scenarios for detecting all TB versus controls and for detecting active TB with low prevalence at training nodes.
Main settings are as in Fig. 2a. a, Different group settings used with assignment of latent TB to control or case. b, Left, evaluation of a scenario where active and latent TB are cases. The data are evenly distributed among the training nodes. Right, test accuracy, sensitivity and specificity for nodes, Swarm and a central model over 10 permutations. c, Left, scenario similar to b but with latent TB as control. Right, test accuracy, sensitivity and specificity for nodes, Swarm and a central model over 10 permutations. d, Left, scenario with reduced prevalence at the test node. Right, test accuracy, sensitivity and specificity for nodes and Swarm over 10 permutations. e, Scenario with even distribution of cases and controls at each training node, where node 1 has a very small training set. The test dataset is evenly distributed. Right, test accuracy, sensitivity and specificity over 50 permutations. f, Left, scenario similar to e but with uneven distribution in the test node. Right, test accuracy, sensitivity and specificity over 50 permutations. g, Scenario with each training node having a different prevalence. Three prevalence scenarios were used in the test dataset. h, Accuracy, sensitivity, specificity and F1 score over five permutations for testing set T1 as shown in g. i, As in h but with prevalence changed to 1:3 cases:controls in the training set. j, As in h but with prevalence changed to 1:10 cases:controls in the training set. bf, hj, Box plots show performance of all permutations performed for the training nodes individually as well as the results obtained by SL. All samples are biological replicates. Centre dot, mean; box limits, 1st and 3rd quartiles; whiskers, minimum and maximum values. Performance measures are defined for the independent fourth node used for testing only. Statistical differences between results derived by SL and all individual nodes including all permutations performed were calculated with one-sided Wilcoxon signed rank test with continuity correction; *P < 0.05, exact P values listed in Supplementary Table 5.
Extended Data Fig. 8
Extended Data Fig. 8. Baseline scenario for detecting patients with COVID-19 and scenario with reduced prevalence at training nodes.
Main settings are as in Fig. 2a. a, Scenario for detecting COVID-19 with even training set distribution among nodes 1–3. Three testing sets with different prevalences were simulated. b, Accuracy, sensitivity, specificity and F1 score over 50 permutations for scenario in a with a 22:25 case:control ratio. c, As in b for an 11:25 ratio. d, As in b for a 1:44 ratio. e, Scenario with the same sample size at each training node, but prevalence decreasing from node 1 to node 3. There are two test datasets (f, g). f, Evaluation of scenario in e with 22:25 ratio at the test node over 50 permutations. g, Evaluation of scenario in e with reduced prevalence over 50 permutations. h, Scenario similar to e but with a steeper decrease in prevalence between nodes 1 and 3. i, Evaluation of scenario in h with a ratio of 37:50 at the test node over 50 permutations. j, Evaluation of scenario in h with a reduced prevalence compared to i over 50 permutations. k, Scenario as in Fig. 4a using a 1:5 ratio for cases and controls in the test dataset evaluated over 50 permutations. l, Scenario as in Fig. 4a using a 1:10 ratio in the test dataset to simulate detection in regions with new infections, evaluated over 50 permutations. m, Performance of central models for k, l and Fig. 4b. n, Loss function of training and validation loss over 100 training epochs. bd, f, g, im, Box plots show performance of all permutations performed for the training nodes individually as well as the results obtained by SL. All samples are biological replicates. Centre dot, mean; box limits, 1st and 3rd quartiles; whiskers, minimum and maximum values. Performance measures are defined for the independent fourth node used for testing only. Statistical differences between results derived by SL and all individual nodes including all permutations performed were calculated with one-sided Wilcoxon signed rank test with continuity correction; *P < 0.05, exact P values listed in Supplementary Table 5.
Extended Data Fig. 9
Extended Data Fig. 9. Scenario with reduced prevalence in training and test datasets and multi-centre scenario at a four-node setting.
Main settings as in Fig. 2a. a, Scenario with prevalences from 10% at node 1 to 3% at node 4. There are three test datasets (bd) with decreasing prevalence and increasing total sample size. b, Evaluation of scenario in a with 111:100 ratio over 50 permutations. c, Evaluation of scenario in a with 1:4 ratio and increased sample number of the test dataset over 50 permutations. d, Evaluation of scenario in a with 1:10 prevalence and increased sample number of the test dataset over 50 permutations. e, Dataset properties for the participating cities E1–E8, indicating case:control ratio and demographic properties. f, AUC, accuracy, sensitivity, specificity and F1 score over 20 permutations for scenario that uses E1–E6 as training nodes and E7 as external test node. g, Evaluation of a multi-city scenario where a medical centre (in each row) serves as a test node. The AUC for each training node and the SL is shown for 20 permutations. h, Multi-city scenario. Only three nodes (E1–E3) are used for training and the external test node E4 uses data from a different sequencing facility. AUC, accuracy, sensitivity and specificity as well as the confusion matrix for one prediction. bd, f, g, Box plots show performance of all permutations performed for the training nodes individually as well as the results obtained by SL. All samples are biological replicates. Centre dot, mean; box limits, 1st and 3rd quartiles; whiskers, minimum and maximum values. Performance measures are defined for the independent fourth node used for testing only. Statistical differences between results derived by SL and all individual nodes including all permutations performed were calculated with one-sided Wilcoxon signed rank test with continuity correction; *P < 0.05, exact P values listed in Supplementary Table 5.
Extended Data Fig. 10
Extended Data Fig. 10. Scenarios for testing different factors and scenario for testing disease severity.
Main settings as in Fig. 2a. a, Top, scenario to test influence of sex with three training nodes. Training node 1 has only male cases, node 2 has only female cases. Training node 3 and the test node have a 50%/50% split. Bottom, accuracy, sensitivity, specificity and F1 score for each training node and the Swarm in 10 permutations. b, Top, scenario to test influence of age with three training nodes. Training node 1 only has cases younger than 65 years, node 2 only has cases older than 65 years. Training node 3 and the test node have a 50%/50% split of cases above and below 65 years. Bottom, accuracy, sensitivity, specificity and F1 score for each training node and the Swarm in 10 permutations. c, Top, scenario to test influence of co-infections with three training nodes. Training node 1 has only cases with co-infections, node 2 has no cases with co-infections. Training node 3 and the test node have a 50%/50% split. Bottom, accuracy, sensitivity, specificity and F1 score for each training node and the Swarm in 10 permutations. d, Prediction setting. Severe cases of COVID-19 are cases, mild cases of COVID-19 and healthy donors are controls. e, Left, scenario to test influence of disease severity with three training nodes. Training node 1 has 20% mild or healthy and 80% severe cases, node 3 has 40% mild or healthy and 60% severe cases. Training node 2 and the test node have 30% mild or healthy and 70% severe cases. Right, accuracy, sensitivity, specificity and F1 score for each training node and the Swarm for 10 permutations. ac, e, Box plots show performance all permutations performed for the training nodes individually as well as the results obtained by SL. All samples are biological replicates. Centre dot, mean; box limits, 1st and 3rd quartiles; whiskers, minimum and maximum values. Performance measures are defined for the independent fourth node used for testing only. Statistical differences between results derived by SL and all individual nodes including all permutations performed were calculated with one-sided Wilcoxon signed rank test with continuity correction; *P < 0.05, exact P values listed in Supplementary Table 5.

References

    1. Aronson SJ, Rehm HL. Building the foundation for genomics in precision medicine. Nature. 2015;526:336–342. doi: 10.1038/nature15816. - DOI - PMC - PubMed
    1. Haendel MA, Chute CG, Robinson PN. Classification, ontology, and precision medicine. N. Engl. J. Med. 2018;379:1452–1462. doi: 10.1056/NEJMra1615014. - DOI - PMC - PubMed
    1. Warnat-Herresthal S, et al. Scalable prediction of acute myeloid leukemia using high-dimensional machine learning and blood transcriptomics. iScience. 2020;23:100780. doi: 10.1016/j.isci.2019.100780. - DOI - PMC - PubMed
    1. Wiens J, et al. Do no harm: a roadmap for responsible machine learning for health care. Nat. Med. 2019;25:1337–1340. doi: 10.1038/s41591-019-0548-6. - DOI - PubMed
    1. Price WN, II, Cohen IG. Privacy in the age of medical big data. Nat. Med. 2019;25:37–43. doi: 10.1038/s41591-018-0272-7. - DOI - PMC - PubMed

Publication types