

Optimization of Ordered Subset Expectation Maximization Parameters for Image Reconstruction in Tc-99m Methoxyisobutylisonitrile Myocardial Perfusion SPECT and Comparison with Corresponding Filtered Back Projection-Reconstructed Images
- PMID: 34040290
- PMCID: PMC8130694
- DOI: 10.4103/ijnm.IJNM_140_20
Optimization of Ordered Subset Expectation Maximization Parameters for Image Reconstruction in Tc-99m Methoxyisobutylisonitrile Myocardial Perfusion SPECT and Comparison with Corresponding Filtered Back Projection-Reconstructed Images
Abstract
Purpose of the study: To establish the most appropriate ordered subset expectation maximization (OSEM) parameters for image reconstruction in Tc-99m methoxyisobutylisonitrile (MIBI) myocardial perfusion SPECT (MPS) and comparison with corresponding filtered back projection (FBP)-reconstructed images.
Methods: A total of 99 stress-rest MPS studies (47 normal and 52 abnormal) were retrospectively analyzed using 16 different combinations of iterations and subsets. Images were reconstructed both with and without postreconstruction Butterworth filter (cutoff frequency and order for stress: 0.4 and 10 and for rest: 0.52 and 5, respectively) for each combination. A total of 3168 images were evaluated qualitatively by two nuclear medicine physicians on a scoring scale of 1-4. Best visual quality image iteration-subset combination was determined for each patient both with and without Butterworth filter and was further compared with FBP-reconstructed image. The interobserver agreement was obtained using kappa statistics.
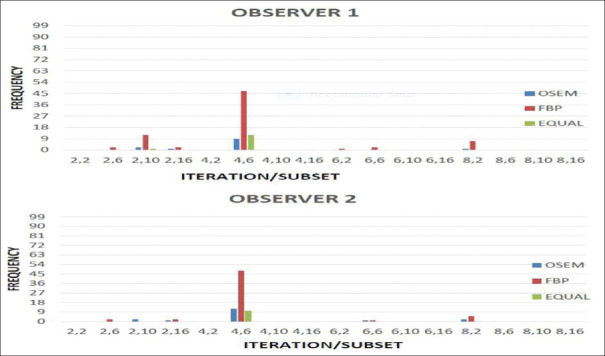
Results: The best quality images were obtained using a combination of four iterations and six subsets for both with and without Butterworth filter. The value of kappa for interobserver agreement for OSEM images with Butterworth filter was 0.570 and for OSEM images without Butterworth filter was 0.857. On comparison, FBP images were better than OSEM-reconstructed images without Butterworth filter (P < 0.0001 calculated using Fisher's exact test) with substantial agreement (kappa = 0.628). However, OSEM-reconstructed images with Butterworth filter were better than FBP images and showed moderate agreement (kappa = 0.486).
Conclusion: The most appropriate OSEM reconstruction parameter in Tc-99m MIBI MPS is 4-iteration and 6-subset combination. FBP-reconstructed images were better than the images reconstructed with OSEM without postreconstruction Butterworth filter. However, OSEM-reconstructed image with Butterworth filter was better than FBP images.
Keywords: Filtered back projection; image reconstruction; myocardial perfusion SPECT; ordered subset expectation maximization.
Copyright: © 2021 Indian Journal of Nuclear Medicine.
Conflict of interest statement
There are no conflicts of interest.
Figures


Similar articles
-
Optimization of the filter parameters in (99m)Tc myocardial perfusion SPECT studies: the formulation of flowchart.Australas Phys Eng Sci Med. 2016 Jun;39(2):571-81. doi: 10.1007/s13246-016-0433-2. Epub 2016 Apr 6. Australas Phys Eng Sci Med. 2016. PMID: 27052439
-
Impacts of different reconstruction methods on the image quality of cadmium-zinc-telluride-based single photon emission computed tomography/computed tomography pulmonary perfusion imaging.Nucl Med Commun. 2023 Aug 1;44(8):673-681. doi: 10.1097/MNM.0000000000001710. Epub 2023 May 29. Nucl Med Commun. 2023. PMID: 37233601
-
Impact of reconstruction parameters on spatial resolution and its comparison between cadmium-zinc-telluride SPECT/CT and conventional SPECT/CT.Nucl Med Commun. 2022 Jan 1;43(1):8-16. doi: 10.1097/MNM.0000000000001484. Nucl Med Commun. 2022. PMID: 34559760
-
Optimization of Ordered Subset Expectation Maximization Reconstruction for Reducing Urinary Bladder Artifacts in Single-photon Emission Computed Tomography Imaging.World J Nucl Med. 2011 Jan;10(1):3-8. doi: 10.4103/1450-1147.82108. World J Nucl Med. 2011. PMID: 22034576 Free PMC article.
-
The influence of resolution recovery by using collimator detector response during 3D OSEM image reconstruction on (99m)Tc-ECD brain SPET images.Hell J Nucl Med. 2012 May-Aug;15(2):92-7. doi: 10.1967/s002449910027. Epub 2012 Jun 27. Hell J Nucl Med. 2012. PMID: 22741145
References
-
- Bruyant PP. Analytic and iterative reconstruction algorithms in SPECT. J Nucl Med. 2002;43:1343–58. - PubMed
-
- Naum A, Kleven-Madsen N, Biermann M, Johnsen B, Tvedt BA. Quantitative comparison of myocardial perfusion defects using different reconstruction algorithms. J Clin Exp Cardiol. 2011;S5:2.
-
- Hesse B, Tägil K, Cuocolo A, Anagnostopoulos C, Bardiés M, Bax J, et al. EANM/ESC procedural guidelines for myocardial perfusion imaging in nuclear cardiology. Eur J Nucl Med Mol Imaging. 2005;32:855–97. - PubMed
LinkOut - more resources
Full Text Sources
Other Literature Sources
Research Materials
Miscellaneous