

An Integrated Analysis of Network Pharmacology, Molecular Docking, and Experiment Validation to Explore the New Candidate Active Component and Mechanism of Cuscutae Semen-Mori Fructus Coupled-Herbs in Treating Oligoasthenozoospermia
- PMID: 34040346
- PMCID: PMC8139735
- DOI: 10.2147/DDDT.S307015
An Integrated Analysis of Network Pharmacology, Molecular Docking, and Experiment Validation to Explore the New Candidate Active Component and Mechanism of Cuscutae Semen-Mori Fructus Coupled-Herbs in Treating Oligoasthenozoospermia
Abstract
Purpose: One of the most common types of male infertility is recognized as oligoasthenozoospermia (OA), characterized by low sperm count and quality in males. As a traditional Chinese medicine (TCM), Cuscutae Semen-Mori Fructus coupled-herbs (CSMFCH) has been known to act a curative effect on OA for thousands of years. Nevertheless, the substantial basis and molecular mechanism of CSMFCH in treating OA remain elusive.
Methods: Herein, an integrated approach, including network pharmacology, molecular docking, and experiment validation, was utilized to reveal the new candidate active component and mechanism of CSMFCH in treating OA.
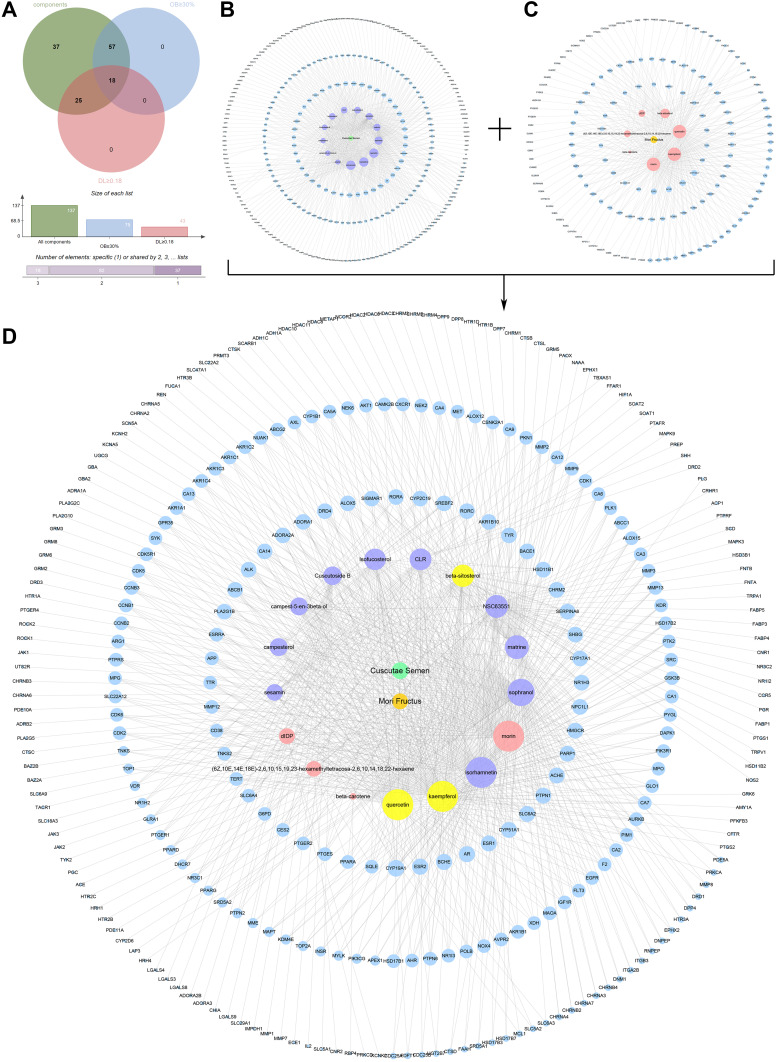
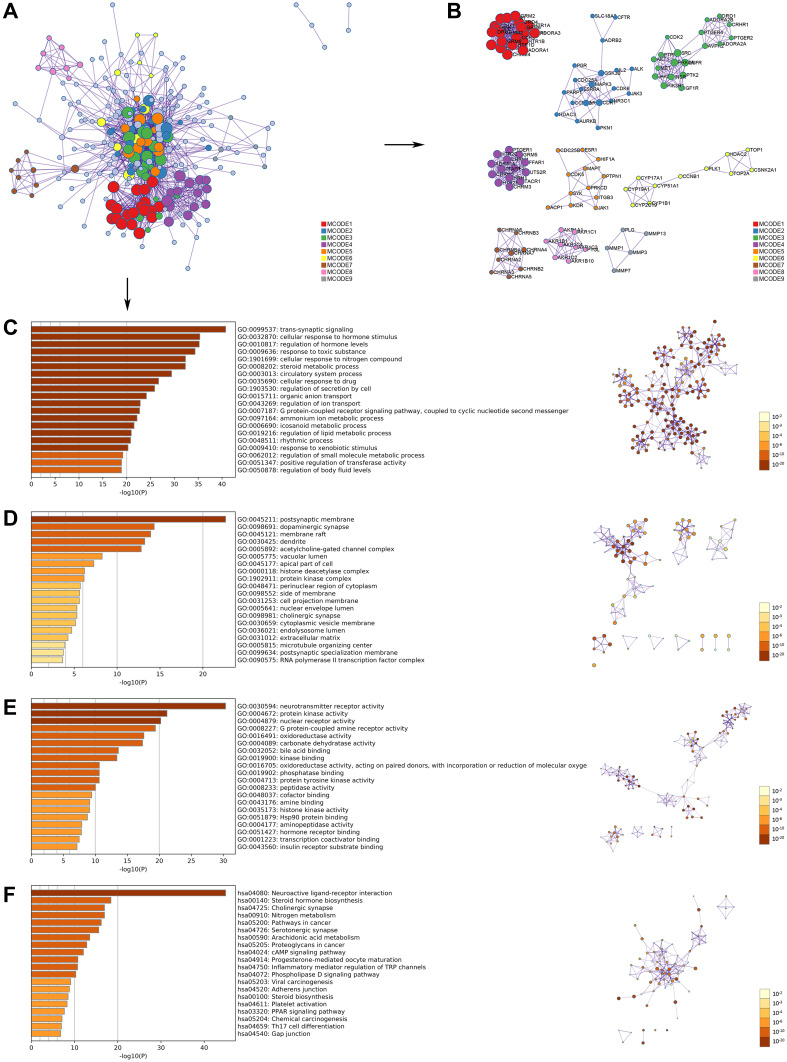
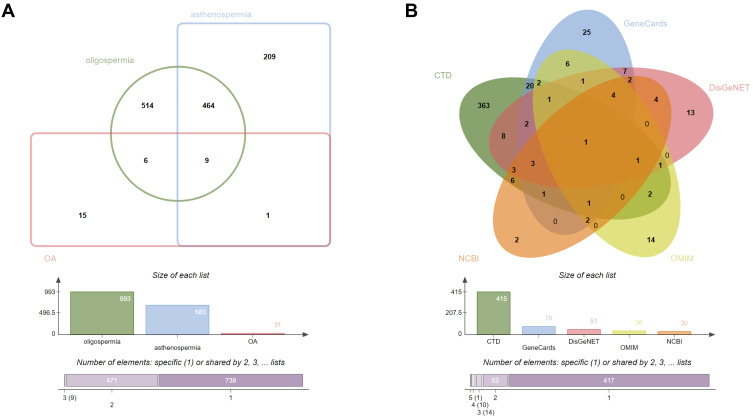
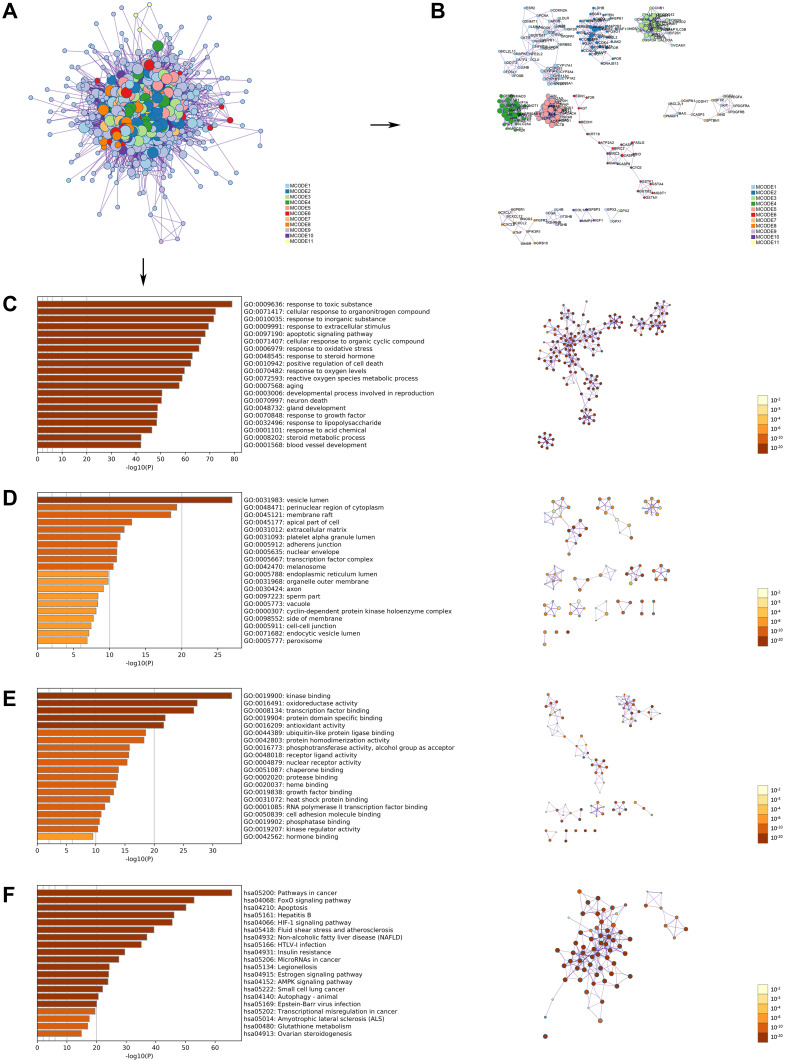
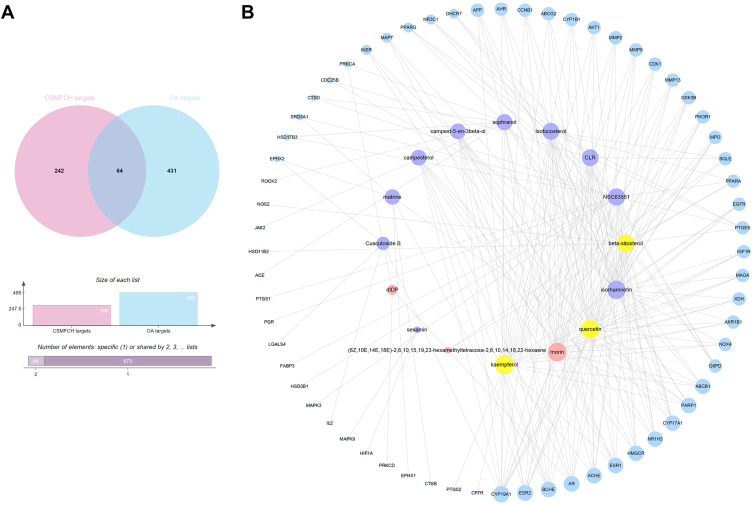
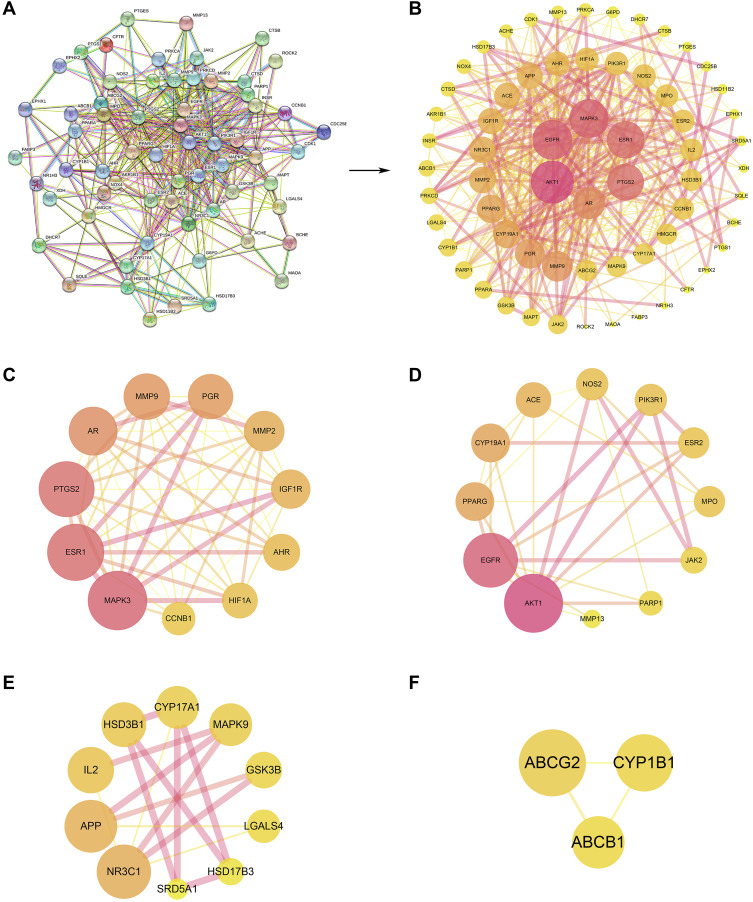
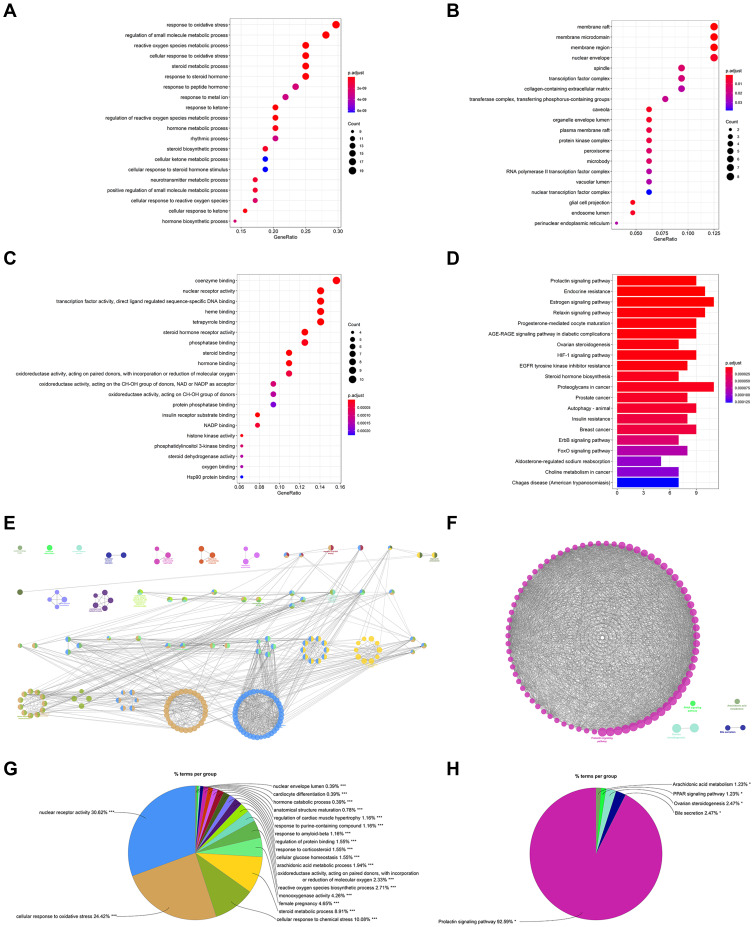
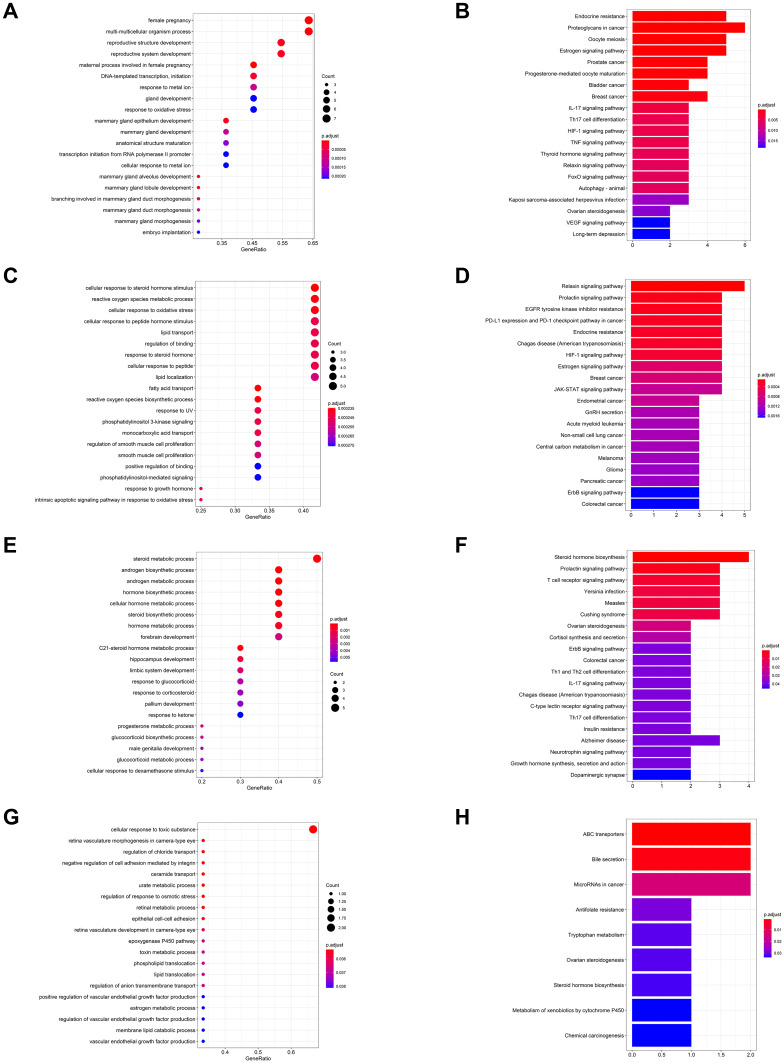
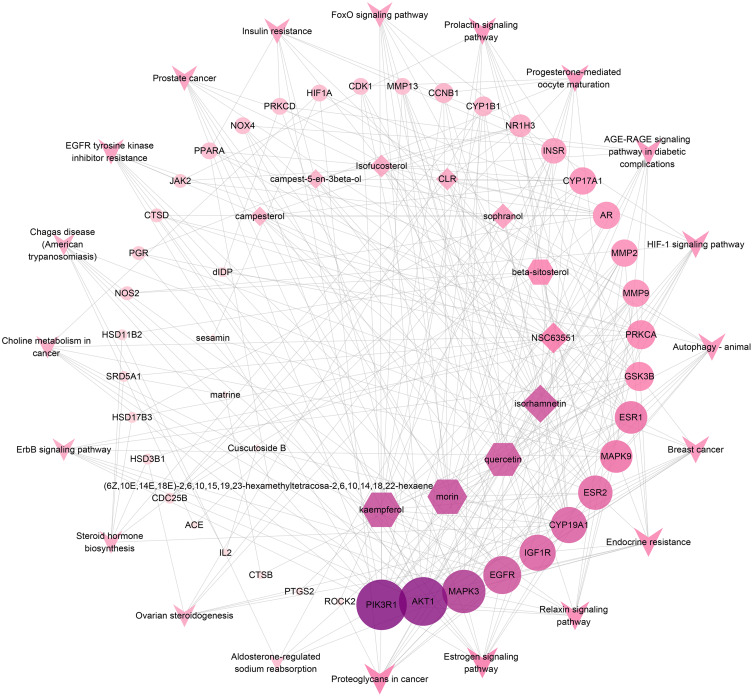
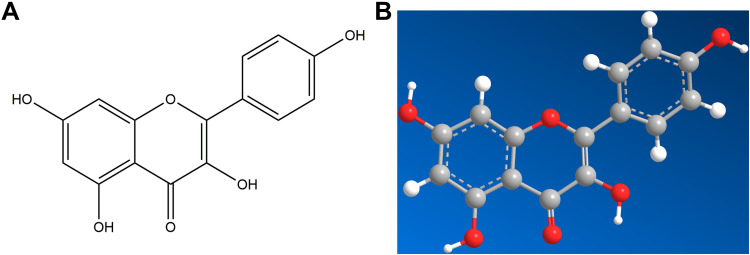
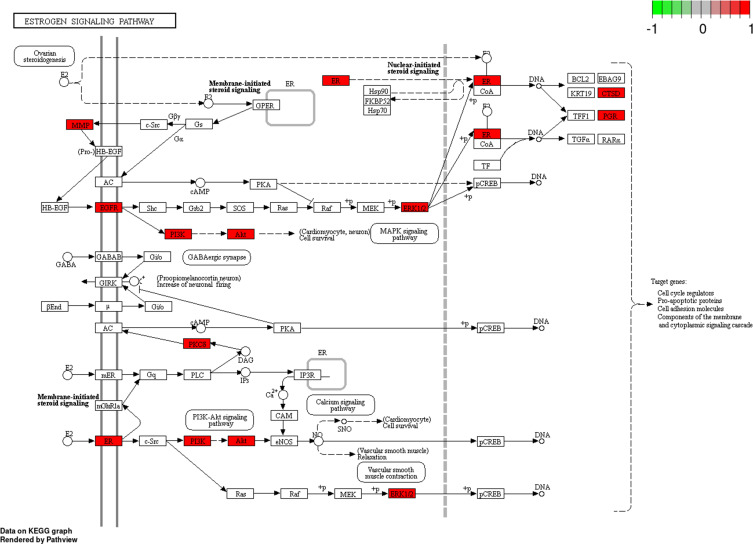
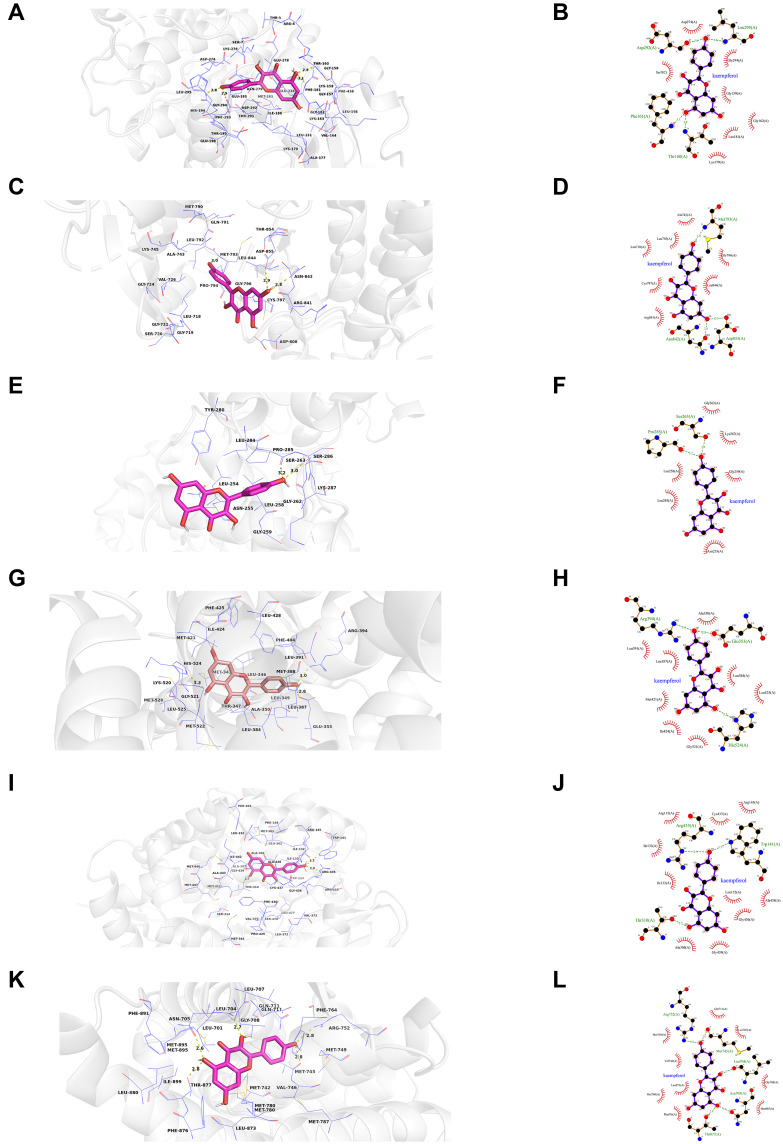
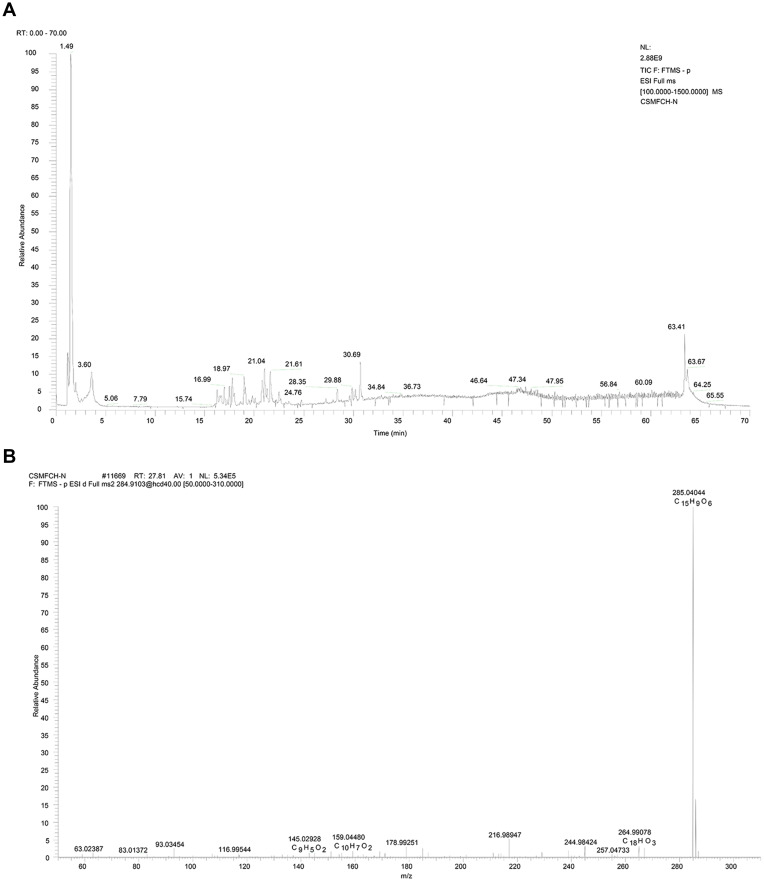
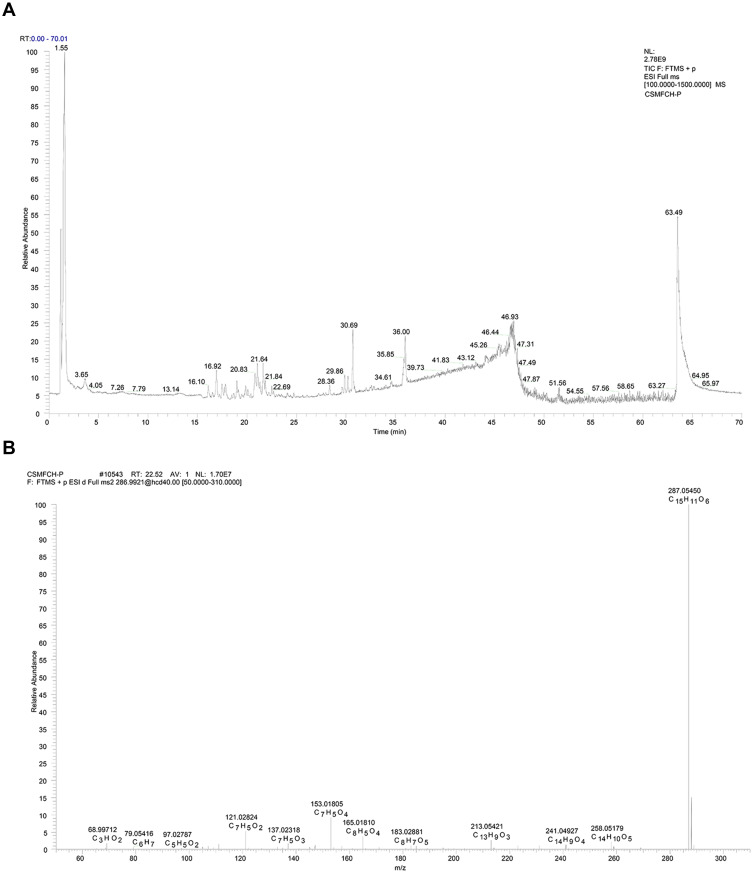
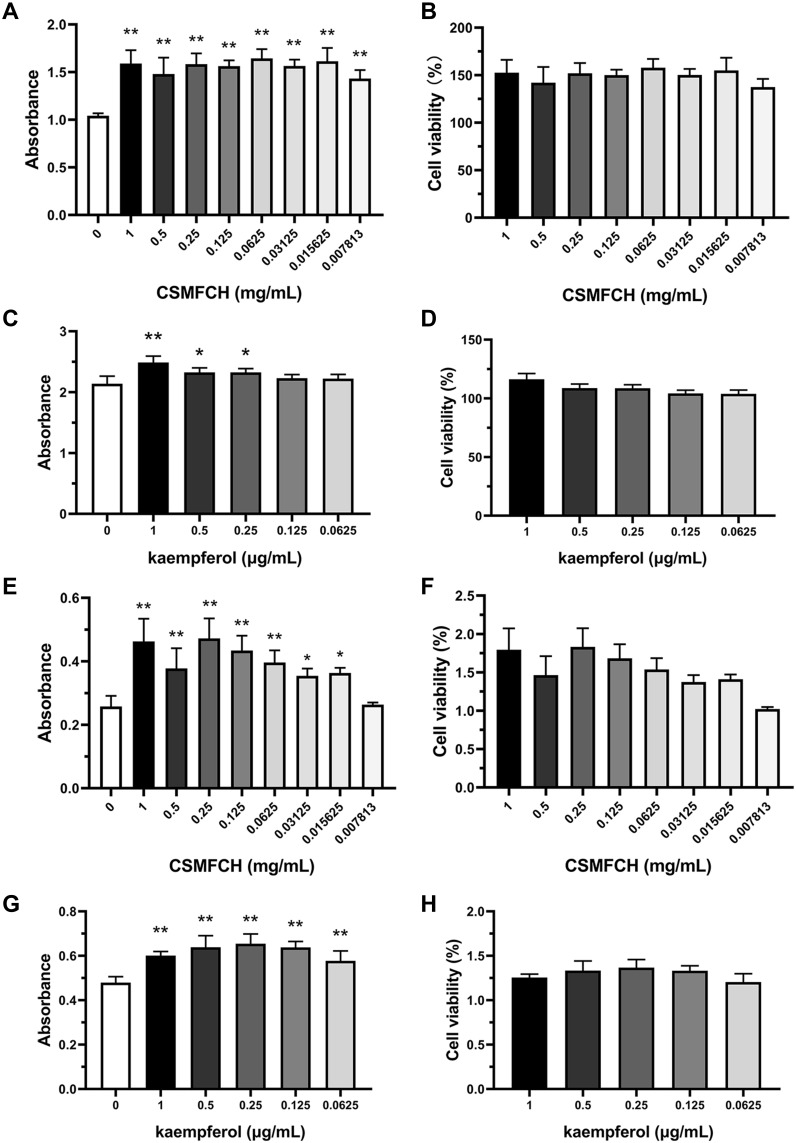
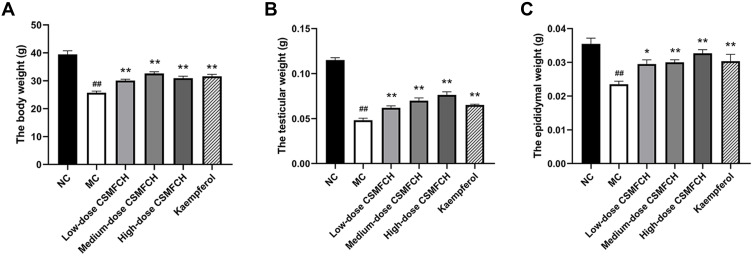
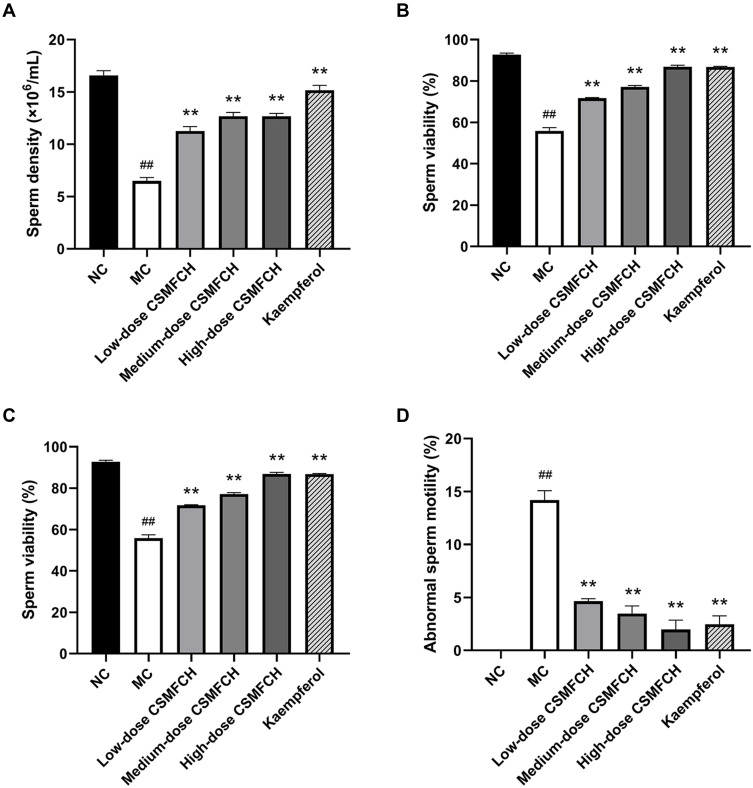
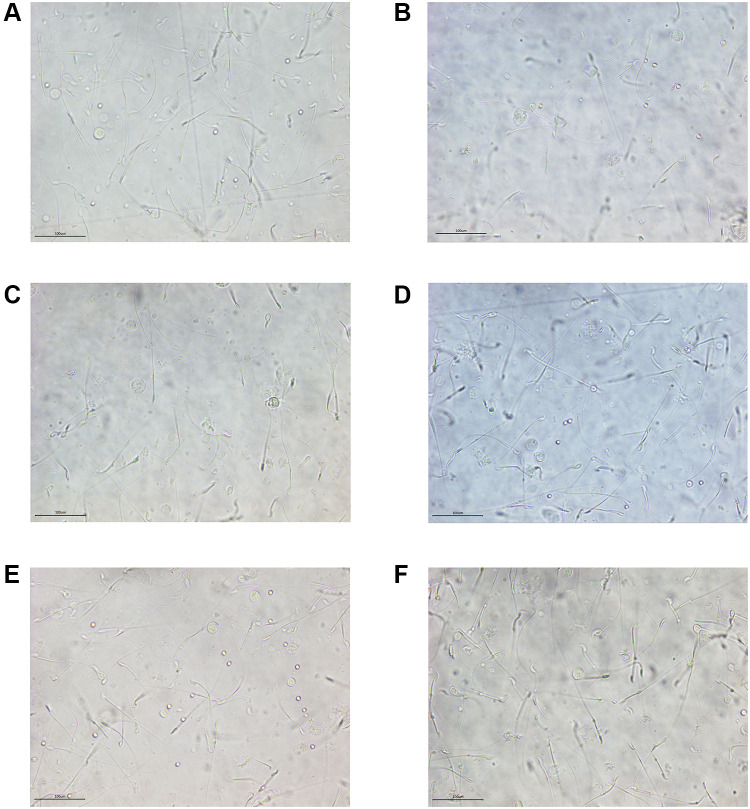
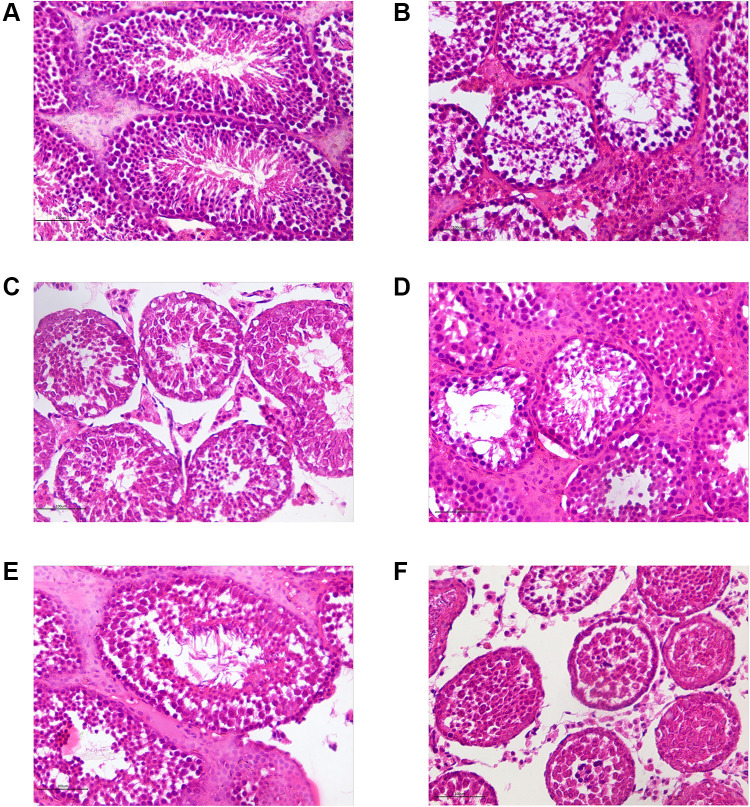
Results: The results show that kaempferol is the most significant bioactive component of CSMFCH on OA. The mechanism and targets of CSMFCH against OA are relevant to hormone regulation, oxidant stress, and reproductive promotion. In order to validate network pharmacology results, molecular docking and experiment validation were conducted. In detail, molecular docking was employed to verify the strong binding interactions between kaempferol and the core targets. UHPLC-Q-Orbitrap-MS was used to identify kaempferol in the CSMFCH extract. In vitro and in vivo experiments further proved CSMFCH and kaempferol could enhance the mouse Leydig (TM3) and mouse Sertoli (TM4) cell viability, improve the male reproductive organ weights, sperm quality, and decrease testis tissue damage in the OA mouse model induced by CP.
Conclusion: Our results not only identify the new candidate active component of CSMFCH in treating OA but also provide new insights into the mechanisms of CSMFCH against OA.
Keywords: kaempferol; network pharmacology; oligoasthenozoospermia; traditional Chinese medicine.
© 2021 Bai et al.
Conflict of interest statement
The authors report no conflicts of interest in this work.
Figures
Similar articles
-
UHPLC-Q/Orbitrap HRMS combined with spectrum-effect relationship and network pharmacology to discovery the gastrointestinal motility-promoting material basis in Citri Sarcodactylis Fructus.J Ethnopharmacol. 2025 Jan 30;337(Pt 2):118926. doi: 10.1016/j.jep.2024.118926. Epub 2024 Oct 10. J Ethnopharmacol. 2025. PMID: 39393559
-
Network pharmacology integrated molecular docking reveals the bioactive components and potential targets of Morinda officinalis-Lycium barbarum coupled-herbs against oligoasthenozoospermia.Sci Rep. 2021 Jan 26;11(1):2220. doi: 10.1038/s41598-020-80780-6. Sci Rep. 2021. PMID: 33500463 Free PMC article.
-
Identifying the active components and mechanisms of Persicae Semen in treating androgenetic alopecia: Insights from network pharmacology and experimental evaluations.J Ethnopharmacol. 2025 May 12;347:119755. doi: 10.1016/j.jep.2025.119755. Epub 2025 Apr 11. J Ethnopharmacol. 2025. PMID: 40220939
-
Assessing the Mechanism of Action of "Fructus Ligustri Lucidi-Cuscutae Semen" in Prostate Cancer Treatment Using Network Pharmacology and Molecular Docking.Comput Math Methods Med. 2022 Oct 25;2022:7543619. doi: 10.1155/2022/7543619. eCollection 2022. Comput Math Methods Med. 2022. PMID: 36330452 Free PMC article.
-
Traditional Chinese medicine formulas for the treatment of osteoporosis: Implication for antiosteoporotic drug discovery.J Ethnopharmacol. 2016 Aug 2;189:61-80. doi: 10.1016/j.jep.2016.05.025. Epub 2016 May 11. J Ethnopharmacol. 2016. PMID: 27180315 Review.
Cited by
-
Elucidating the anti-hypertensive mechanisms of Uncaria rhynchophylla-Alisma plantago-aquatica L: an integrated network pharmacology, cluster analysis, and molecular docking approach.Front Chem. 2024 Feb 29;12:1356458. doi: 10.3389/fchem.2024.1356458. eCollection 2024. Front Chem. 2024. PMID: 38496269 Free PMC article.
-
Experimental validation and molecular docking to explore the active components of cannabis in testicular function and sperm quality modulations in rats.BMC Complement Med Ther. 2022 Aug 26;22(1):227. doi: 10.1186/s12906-022-03704-z. BMC Complement Med Ther. 2022. PMID: 36028848 Free PMC article.
-
Network pharmacology: a bright guiding light on the way to explore the personalized precise medication of traditional Chinese medicine.Chin Med. 2023 Nov 8;18(1):146. doi: 10.1186/s13020-023-00853-2. Chin Med. 2023. PMID: 37941061 Free PMC article. Review.
-
Treatment progress of cryptozoospermia with Western Medicine and traditional Chinese medicine: A literature review.Health Sci Rep. 2022 Dec 27;6(1):e1019. doi: 10.1002/hsr2.1019. eCollection 2023 Jan. Health Sci Rep. 2022. PMID: 36582629 Free PMC article.
References
-
- Machen GL, Sandlow JI. Causes of male infertility. Male Infertility Springer. 2020;3–14.
Publication types
MeSH terms
Substances
LinkOut - more resources
Full Text Sources
Other Literature Sources
Research Materials
Miscellaneous
