

Veridical Causal Inference using Propensity Score Methods for Comparative Effectiveness Research with Medical Claims
- PMID: 34040495
- PMCID: PMC8142944
- DOI: 10.1007/s10742-020-00222-8
Veridical Causal Inference using Propensity Score Methods for Comparative Effectiveness Research with Medical Claims
Abstract
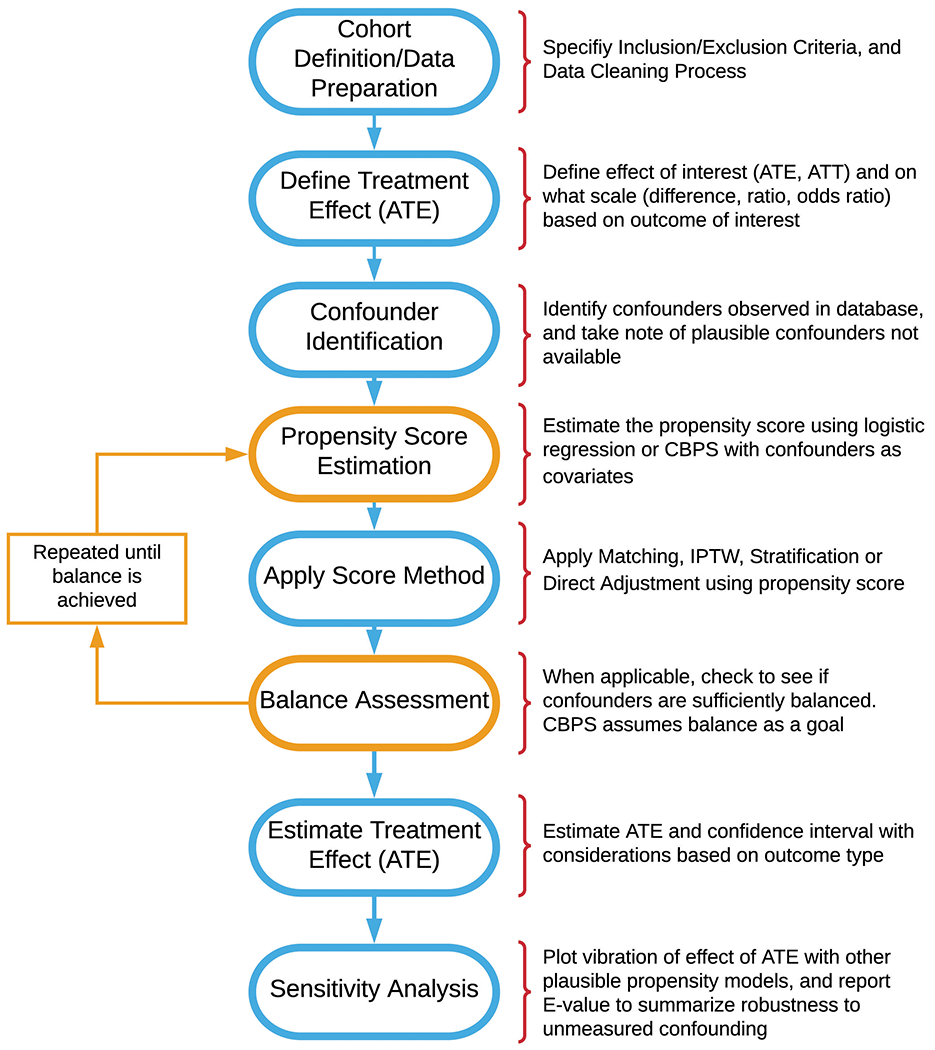
Medical insurance claims are becoming increasingly common data sources to answer a variety of questions in biomedical research. Although comprehensive in terms of longitudinal characterization of disease development and progression for a potentially large number of patients, population-based inference using these datasets require thoughtful modifications to sample selection and analytic strategies relative to other types of studies. Along with complex selection bias and missing data issues, claims-based studies are purely observational, which limits effective understanding and characterization of the treatment differences between groups being compared. All these issues contribute to a crisis in reproducibility and replication of comparative findings using medical claims. This paper offers practical guidance to the analytical process, demonstrates methods for estimating causal treatment effects with propensity score methods for several types of outcomes common to such studies, such as binary, count, time to event and longitudinally-varying measures, and also aims to increase transparency and reproducibility of reporting of results from these investigations. We provide an online version of the paper with readily implementable code for the entire analysis pipeline to serve as a guided tutorial for practitioners. The online version can be accessed at https://rydaro.github.io/. The analytic pipeline is illustrated using a sub-cohort of patients with advanced prostate cancer from the large Clinformatics TM Data Mart Database (OptumInsight, Eden Prairie, Minnesota), consisting of 73 million distinct private payer insurees from 2001-2016.
Keywords: average treatment effect; covariate adjustment; hormone therapy; insurance claims; matching; prostate cancer; reproducibility; sensitivity analysis; veridical data science.
Conflict of interest statement
Conflicts of Interest: The authors have no competing interests and nothing to disclose.
Figures
References
-
- Ali M. Sanni, Groenwold Rolf H.H., Belitser Svetlana V., Pestman Wiebe R., Hoes Arno W., Roes Kit C.B., de Boer Anthonius, and Klungel Olaf H.. 2015. “Reporting of Covariate Selection and Balance Assessment in Propensity Score Analysis Is Suboptimal: A Systematic Review.” Journal of Clinical Epidemiology 68 (2): 122–31. 10.1016/J.JCLINEPI.2014.08.011. - DOI - PubMed
-
- Andersen Robert.: Modern Methods for Robust Regression 1–6. (2019)
Grants and funding
LinkOut - more resources
Full Text Sources
Other Literature Sources