. 2021 May 10:14:618360.
doi: 10.3389/fnmol.2021.618360. eCollection 2021.

Comparative Effectiveness of Intracerebroventricular, Intrathecal, and Intranasal Routes of AAV9 Vector Administration for Genetic Therapy of Neurologic Disease in Murine Mucopolysaccharidosis Type I

Affiliations

Comparative Effectiveness of Intracerebroventricular, Intrathecal, and Intranasal Routes of AAV9 Vector Administration for Genetic Therapy of Neurologic Disease in Murine Mucopolysaccharidosis Type I

Lalitha R Belur et al. Front Mol Neurosci. .

Abstract

Mucopolysaccharidosis type I (MPS I) is an inherited metabolic disorder caused by deficiency of the lysosomal enzyme alpha-L-iduronidase (IDUA). The two current treatments [hematopoietic stem cell transplantation (HSCT) and enzyme replacement therapy (ERT)], are insufficiently effective in addressing neurologic disease, in part due to the inability of lysosomal enzyme to cross the blood brain barrier. With a goal to more effectively treat neurologic disease, we have investigated the effectiveness of AAV-mediated IDUA gene delivery to the brain using several different routes of administration. Animals were treated by either direct intracerebroventricular (ICV) injection, by intrathecal (IT) infusion into the cerebrospinal fluid, or by intranasal (IN) instillation of AAV9-IDUA vector. AAV9-IDUA was administered to IDUA-deficient mice that were either immunosuppressed with cyclophosphamide (CP), or immunotolerized at birth by weekly injections of human iduronidase. In animals treated by ICV or IT administration, levels of IDUA enzyme ranged from 3- to 1000-fold that of wild type levels in all parts of the microdissected brain. In animals administered vector intranasally, enzyme levels were 100-fold that of wild type in the olfactory bulb, but enzyme expression was close to wild type levels in other parts of the brain. Glycosaminoglycan levels were reduced to normal in ICV and IT treated mice, and in IN treated mice they were normalized in the olfactory bulb, or reduced in other parts of the brain. Immunohistochemical analysis showed extensive IDUA expression in all parts of the brain of ICV treated mice, while IT treated animals showed transduction that was primarily restricted to the hind brain with some sporadic labeling seen in the mid- and fore brain. At 6 months of age, animals were tested for spatial navigation, memory, and neurocognitive function in the Barnes maze; all treated animals were indistinguishable from normal heterozygous control animals, while untreated IDUA deficient animals exhibited significant learning and spatial navigation deficits. We conclude that IT and IN routes are acceptable and alternate routes of administration, respectively, of AAV vector delivery to the brain with effective IDUA expression, while all three routes of administration prevent the emergence of neurocognitive deficiency in a mouse MPS I model.

Keywords: AAV9; IDUA; MPS I; gene therapy; intracerebroventricular administration; intranasal infusion; intrathecal injection.


Conflict of interest statement

KFK was employed by REGENXBIO Inc. at the time of the study. The remaining authors declare that the research was conducted in the absence of any commercial or financial relationships that could be construed as a potential conflict of interest.

Figures

FIGURE 1
FIGURE 1
Routes of AAV9-IDUA administration to access the brain. ICV, Intracerebroventricular; IT, Intrathecal; IN, Intranasal.
FIGURE 2
FIGURE 2
IDUA activity in the brain after ICV administration of AAV9-IDUA vector. Brains were microdissected and assayed for IDUA enzyme activity. Each data point indicates a value from a single animal with the mean indicated by the short horizontal line. (A) Animals were immunotolerized with Aldurazyme (laronidase) (n = 9). (B). Animals were immunosuppressed with cyclophosphamide (n = 4). (C) Animals were not immunomodulated (n = 4). Widespread enzyme activity was seen in all ICV treated groups compared to heterozygote normal controls (n = 3) regardless of whether they were immunomodulated or not. Enzyme was not detected in untreated MPS I animals (<0.02 nmoles/h/mg protein) (n = 3).
FIGURE 3
FIGURE 3
IDUA Activity in the brain after IT administration of AAV9-IDUA vector. Brains were microdissected and assayed for IDUA enzyme activity. Each data point indicates a value from a single animal with the mean indicated by the short horizontal line. (A) Animals were immunotolerized with Aldurazyme (laronidase) (n = 9). Widespread enzyme activity was seen in the immunotolerized IT treated group compared to heterozygote normal controls (n = 3). (B) Animals were immunosuppressed with cyclophosphamide (n = 5). Animals that were immunosuppressed had lower levels of activity in the cerebellum, compared to immunotolerized animals, although the difference was not significant. P-values for treated animals were < 0.01 compared to untreated controls. (C) Animals were not immunomodulated (n = 3). Activities in these animals were lower for several areas of the brain, notably the olfactory bulb, cortex, cerebellum, thalamus and brain stem. Levels of enzyme activity were close to that of normal heterozygote controls. Enzyme was not detected in untreated MPS I animals (<0.02 nmoles/h/mg protein) (n = 3). P-values for treated animals were < 0.05 compared to untreated controls.
FIGURE 4
FIGURE 4
IDUA activity in the brain after IN administration of AAV9-IDUA vector. Brains were microdissected and assayed for IDUA enzyme activity (n = 7). Each data point indicates a value from a single animal with the mean indicated by the short horizontal line. All animals were immunosuppressed with cyclophosphamide, and showed levels of activity that were similar to or a fraction of normal heterozygote controls, except for the olfactory bulb, which exhibited enzyme levels that were 100 times that of normal controls. Enzyme was not detected in untreated MPS I animals (< 0.02 nmoles/hr/mg protein) (n = 3). P-values ranged from < 0.001 (olfactory bulb) to not significant (other parts of the brain).
FIGURE 5
FIGURE 5
Glycosaminoglycan (GAG) storage in brain post-AAV administration. Tissue lysates from different parts of the brain were assayed for GAG storage. The levels of GAG found in whole brain of untreated MPS I mice averaged around 20 μg GAG/mg protein, and in normal heterozygotes ranged from 4 to 12 μg GAG/mg protein. Each data point indicates a value from a single animal with the mean values represented by horizontal lines. (A) GAG accumulation in brain following ICV administration. GAG levels from both immunosuppressed and immunotolerized animals were normalized across the brain. There was no significant difference between the 2 immunomodulated groups. P-values were <0.0001 for treated animals compared to untreated controls. (B) GAG accumulation in brain following IT administration. GAG levels from both immunosuppressed and immunotolerized animals were normalized across the brain. Levels of GAG were slightly higher than ICV GAGs, but still in the normal range. Thalamus and brain stem GAG levels from immunotolerized animals were slightly higher than normal levels, although lower than untreated MPS I animals. There was no significant difference between the 2 immunomodulated groups. P-values were < 0.001 for treated animals compared to untreated controls. (C). GAG accumulation in brain following IN administration. GAG levels from immunosuppressed animals were normalized in the olfactory bulb, and while some animals were not normalized in other parts of the brain, levels were lower than untreated MPS I animals. P-values ranged from < 0.001 to < 0.05 for treated animals compared to untreated controls.
FIGURE 6
FIGURE 6
Vector biodistribution. Tissue DNA extracts were assayed for the presence of IDUA sequences by quantitative PCR. Each symbol represents 1 animal. Dashed line indicates the lower limit of detection analyzed from genomic DNA samples collected from heterozygote controls (<0.01). (A) IDUA vector sequences after ICV administration. Vector copy numbers (VCNs) from immunotolerized animals ranged from 0.01 to 10 copies per cell in ICV administered animals. Average VCNs were highest in cortex and hippocampus, while they were lowest in the spinal cord, close to the limit of detection of 0.01. (B) IDUA vector sequences after IT injection. VCNs from immunotolerized animals were lower in IT injected animals, ranging from 0.01 to 0.1 copies per cell. (C) IDUA vector sequences after IN administration. The pattern of VCN was similar to that of enzyme data. As expected, the only VCNs that were above the level of detection were in the olfactory bulb.
FIGURE 7
FIGURE 7
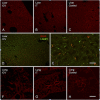
Localization of IDUA immunolabeling in brain following ICV and IT delivery. (A,B) Select neurons in the brainstem showed IDUA-ir following ICV (A) but not IT (B) delivery of the vector. (C,D,G,H) Cells of the hippocampus showed IDUA-ir following both ICV (C,G) and IT (D,H) delivery, although many more hippocampal neurons were labeled after ICV delivery. (E,F,I) Cells of the cerebellum showed IDUA-ir following ICV (E,I) but not IT (F) delivery of the virus. The majority of the labeled cells in the cerebellum were Purkinje cells (arrow in I). (J,K) Many IDUA-ir cells of the olfactory bulb were seen following ICV (J) delivery as opposed to IT (K) delivery. Most transduction was seen in the glomerular layer. (L,M) A subset of cells of the choroid plexus showed IDUA-ir after ICV (L) delivery but not IT delivery (M). (N–Q) IDUA-ir was seen in the cortex of animals following ICV (N,O,Q) but not IT (not shown) delivery. Colocalization of IDUA (red) and NeuN (green, P and Q) labeling in cortex suggests that IDUA-ir could be seen in neurons. Scale bars: (A–F,J–N), 150 μm; (G,H,I) 75 μm; O, P, Q 25 μm.
FIGURE 8
FIGURE 8
Localization of IDUA immunolabeling in spinal cord following IT delivery. (A) Motor neurons of the ventral horn of sacral spinal cord show IDUA labeling. (B) IDUA staining is restricted to neurons and is not colocalized with the microglial marker Iba1. (C) IDUA is colocalized within neurons with the lysosomal marker LAMP1. Scale bars: (A) 150 μm; (B) 25 μm; (C) 75 μm.
FIGURE 9
FIGURE 9
Localization of IDUA immunolabeling in liver and lung. (A–C) IDUA labeling was seen in the liver of ICV-treated (A) and to a lesser extent IT-treated (B) mice, compared to control (C). (D,E) IDUA labeling in liver colocalized with LAMP-1 labeling. (F–H) Sparse IDUA labeling was seen in lung of ICV-treated (F) and to a lesser extent IT-treated (G) mice, compared to control (H). Scale bars: (A–D,F–H) 150 μm; (E) 25 μm.
FIGURE 10
FIGURE 10
Assessment of neurocognitive improvement. The Barnes Maze was used to assess spatial learning and memory in immunomodulated animals treated with vector using ICV and IT routes (n = 9 in both groups). We have previously demonstrated improvement of neurocognitive deficit in IN administered animals (Belur et al., 2017) (*p < 0.05, **p < 0.01). (A) ICV treated animals were significantly improved based on the Barnes maze. Latency to escape in ICV treated animals was not significantly different from heterozygote controls, and was significantly improved compared to untreated MPS I animals. (B) IT treated animals showed the same pattern of cognitive improvement in the Barnes maze exhibiting significantly better performance compared to untreated MPS I controls.

Similar articles

Cited by

References

    1. Aronovich E. L., Bell J. B., Belur L. R., Gunther R., Koniar B., Erickson D. C., et al. (2007). Prolonged expression of a lysosomal enzyme in mouse liver after sleeping beauty transposon-mediated gene delivery: implications for non-viral gene therapy of mucopolysaccharidoses. J. Gene Med. 9 403–415. 10.1002/jgm.1028 - DOI - PMC - PubMed
    1. Aronovich E. L., Bell J. B., Khan S. A., Belur L. R., Gunther R., Koniar B., et al. (2009). Systemic correction of storage disease in MPS I NOD/SCID mice using the sleeping beauty transposon system. Mol. Ther. 17 1136–1144. 10.1038/mt.2009.87 - DOI - PMC - PubMed
    1. Baldo G., Mayer F. Q., Martinelli B. Z., de Carvalho T. G., Meyer F. S., de Oliveira P. G., et al. (2013). Enzyme replacement therapy started at birth improves outcome in difficult-to-treat organs in mucopolysaccharidosis I mice. Mol. Genet. Metab. 109 33–40. 10.1016/j.ymgme.2013.03.005 - DOI - PubMed
    1. Begley D. J., Pontikis C. C., Scarpa M. (2008). Lysosomal storage diseases and the blood-brain barrier. Curr. Pharm. Des. 14 1566–1580. 10.2174/138161208784705504 - DOI - PubMed
    1. Belur L., Huber A., Mantone M., Karlen A., Smith M., Ou L., et al. (2021). Comparative systemic and neurologic effectiveness of intravenous and intrathecal AAV9 delivered individually or combined in a murine model of mucopolysaccharidosis type I. Mol. Gen. Metab. 132 S19–S20.