

Saliva Neurofilament Light Chain Is Not a Diagnostic Biomarker for Neurodegeneration in a Mixed Memory Clinic Population
- PMID: 34040512
- PMCID: PMC8141589
- DOI: 10.3389/fnagi.2021.659898
Saliva Neurofilament Light Chain Is Not a Diagnostic Biomarker for Neurodegeneration in a Mixed Memory Clinic Population
Abstract
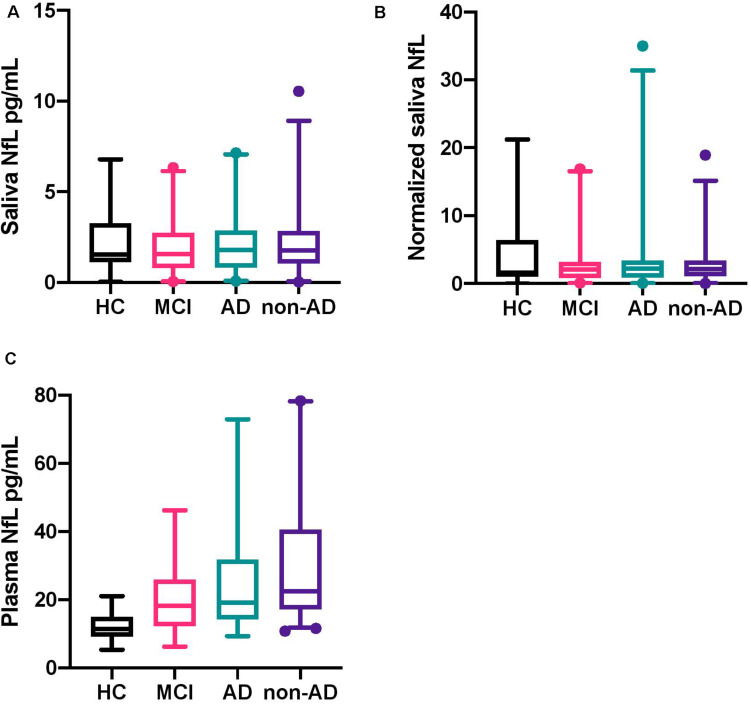
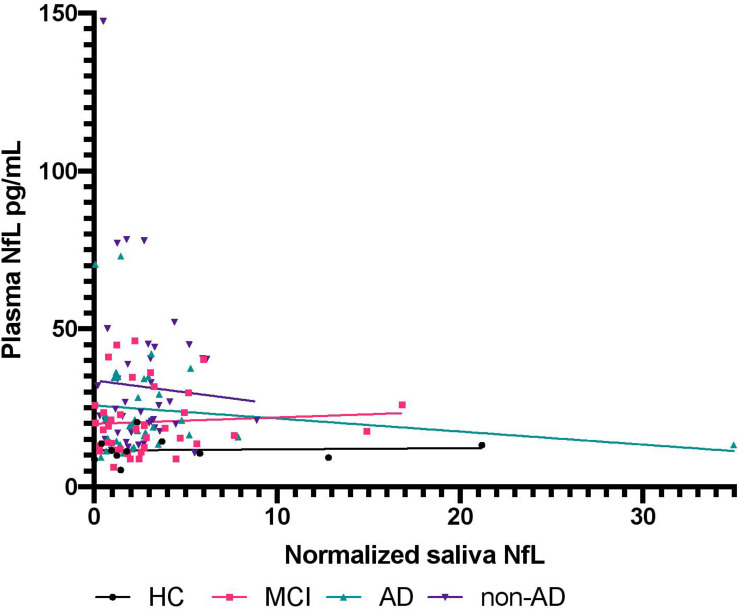
Neurodegeneration and axonal injury result in an increasing release of neurofilament light chain (NfL) into bodily fluids, including cerebrospinal fluid (CSF) and blood. Numerous studies have shown that NfL levels in CSF and blood are increased in neurodegenerative disorders and monitor neurodegeneration. Saliva is an easily accessible biofluid that could be utilized as a biofluid measurement of Alzheimer's disease (AD) biomarkers. In this study, for the first time, salivary NfL was measured and compared to plasma NfL in a consecutive cohort of patients referred to cognitive assessments. In two mixed memory clinic cohorts, saliva samples were taken from 152 patients, AD (n = 49), mild cognitive impairment (MCI) (n = 47), non-AD (n = 56), and also 17 healthy controls. In addition, 135 also had a matching plasma sample. All saliva and plasma samples were analyzed for NfL, and the association between saliva and plasma NfL and CSF levels of total tau (t-tau), phosphorylated tau (p-tau), and beta amyloid 1-42 (Aβ42) were investigated. In total, 162/169 had quantifiable levels of salivary NfL by single molecule array (Simoa). No statistically significant differences were found in salivary NfL concentration across the diagnostic groups, but as expected, significant increases were found for plasma NfL in dementia cases (P < 0.0001). There was no association between saliva and plasma NfL levels. Furthermore, saliva NfL did not correlate with CSF Aβ42, p-tau, or tau concentrations. In conclusion, NfL is detectable in saliva but does not reflect neurodegeneration in the brain.
Keywords: Alzheimer’s disease; biomarker; dementia; neurodegeneration; neurofilament light chain; plasma; saliva.
Copyright © 2021 Gleerup, Sanna, Høgh, Simrén, Blennow, Zetterberg, Hasselbalch, Ashton and Simonsen.
Conflict of interest statement
KB has served as a consultant, at advisory boards, or at data monitoring committees for Abcam, Axon, Biogen, JOMDD/Shimadzu, Julius Clinical, Lilly, MagQu, Novartis, Roche Diagnostics, and Siemens Healthineers and is a co-founder of Brain Biomarker Solutions in Gothenburg AB (BBS), which is a part of the GU Ventures Incubator Program. HZ has served at scientific advisory boards for Denali, Roche Diagnostics, Wave, Samumed, Siemens Healthineers, Pinteon Therapeutics, Nervgen, and CogRx, has given lectures in symposia sponsored by Fujirebio, Alzecure, and Biogen, and is a co-founder of Brain Biomarker Solutions in Gothenburg AB (BBS), which is a part of the GU Ventures Incubator Program. The remaining authors declare that the research was conducted in the absence of any commercial or financial relationships that could be construed as a potential conflict of interest.
Figures
Similar articles
-
Association Between Longitudinal Plasma Neurofilament Light and Neurodegeneration in Patients With Alzheimer Disease.JAMA Neurol. 2019 Jul 1;76(7):791-799. doi: 10.1001/jamaneurol.2019.0765. JAMA Neurol. 2019. PMID: 31009028 Free PMC article.
-
Comparison of CSF and plasma NfL and pNfH for Alzheimer's disease diagnosis: a memory clinic study.J Neurol. 2024 Mar;271(3):1297-1310. doi: 10.1007/s00415-023-12066-6. Epub 2023 Nov 11. J Neurol. 2024. PMID: 37950758
-
Plasma neurofilament light chain as a biomarker of Alzheimer's disease in Subjective Cognitive Decline and Mild Cognitive Impairment.J Neurol. 2022 Aug;269(8):4270-4280. doi: 10.1007/s00415-022-11055-5. Epub 2022 Mar 14. J Neurol. 2022. PMID: 35288777 Free PMC article.
-
Novel Biomarkers for Alzheimer's Disease: Plasma Neurofilament Light and Cerebrospinal Fluid.Int J Alzheimers Dis. 2024 May 15;2024:6668159. doi: 10.1155/2024/6668159. eCollection 2024. Int J Alzheimers Dis. 2024. PMID: 38779175 Free PMC article. Review.
-
A Review of Fluid Biomarkers for Alzheimer's Disease: Moving from CSF to Blood.Neurol Ther. 2017 Jul;6(Suppl 1):15-24. doi: 10.1007/s40120-017-0073-9. Epub 2017 Jul 21. Neurol Ther. 2017. PMID: 28733960 Free PMC article. Review.
Cited by
-
Association Between Serum Neurofilament Light and Glial Fibrillary Acidic Protein Levels and Head Impact Burden in Women's Collegiate Water Polo.J Neurotrauma. 2023 Jun;40(11-12):1130-1143. doi: 10.1089/neu.2022.0300. Epub 2022 Nov 29. J Neurotrauma. 2023. PMID: 36259456 Free PMC article.
-
Salivary levels of amyloid beta reflect brain amyloid beta burden in cognitively-normal older adults.J Prev Alzheimers Dis. 2025 Aug;12(7):100216. doi: 10.1016/j.tjpad.2025.100216. Epub 2025 Jun 9. J Prev Alzheimers Dis. 2025. PMID: 40494737 Free PMC article.
-
The Added Value of Cerebrospinal Fluid Neurofilament Light Chain to Existing Diagnostic Methods and Biomarkers in a Mixed Memory Clinic Cohort of Consecutive Patients.J Alzheimers Dis Rep. 2022 Mar 25;6(1):121-127. doi: 10.3233/ADR-210047. eCollection 2022. J Alzheimers Dis Rep. 2022. PMID: 35530115 Free PMC article.
-
Saliva: a challenging human fluid to diagnose brain disorders with a focus on Alzheimer's disease.Neural Regen Res. 2023 Dec;18(12):2606-2610. doi: 10.4103/1673-5374.373675. Neural Regen Res. 2023. PMID: 37449596 Free PMC article. Review.
-
Comparisons of neurodegenerative disease biomarkers across different biological fluids from patients with Huntington's disease.J Neurol. 2025 Jan 23;272(2):158. doi: 10.1007/s00415-024-12785-4. J Neurol. 2025. PMID: 39849121 Free PMC article.
References
-
- Ashton N. J., Leuzy A., Lim Y. M., Troakes C., Hortobágyi T., Höglund K., et al. (2019b). Increased plasma neurofilament light chain concentration correlates with severity of post-mortem neurofibrillary tangle pathology and neurodegeneration. Acta Neuropathol. Commun. 7:5. 10.1186/s40478-018-0649-3 - DOI - PMC - PubMed
Grants and funding
LinkOut - more resources
Full Text Sources
Other Literature Sources