. 2021 May 10:12:670224.
doi: 10.3389/fphar.2021.670224. eCollection 2021.

Polyphyllin Ⅲ-Induced Ferroptosis in MDA-MB-231 Triple-Negative Breast Cancer Cells can Be Protected Against by KLF4-Mediated Upregulation of xCT

Affiliations

Polyphyllin Ⅲ-Induced Ferroptosis in MDA-MB-231 Triple-Negative Breast Cancer Cells can Be Protected Against by KLF4-Mediated Upregulation of xCT

Yulu Zhou et al. Front Pharmacol. .

Abstract

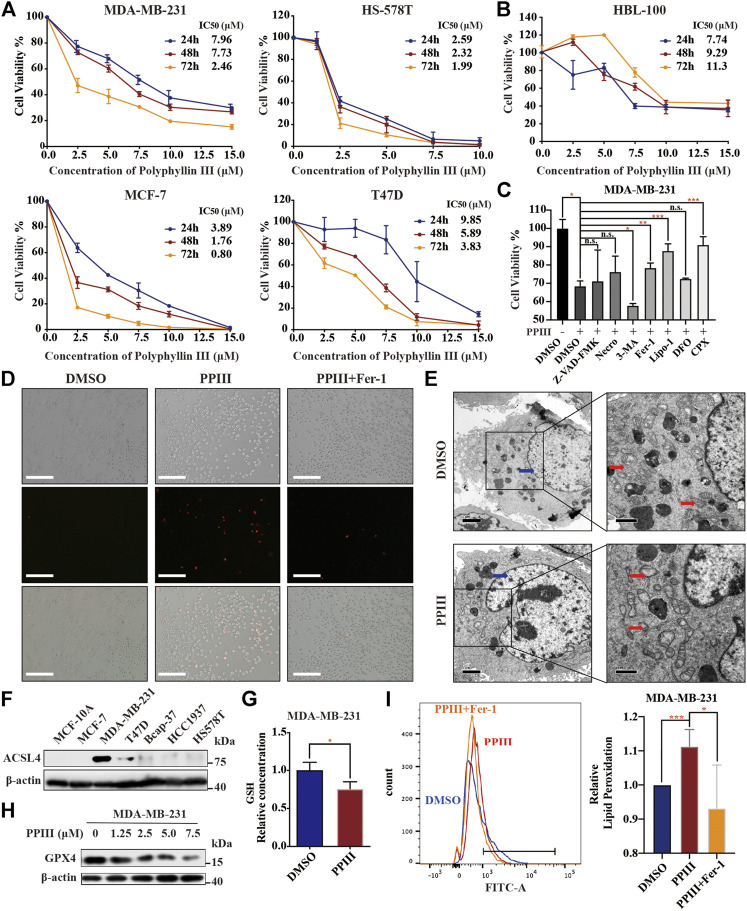
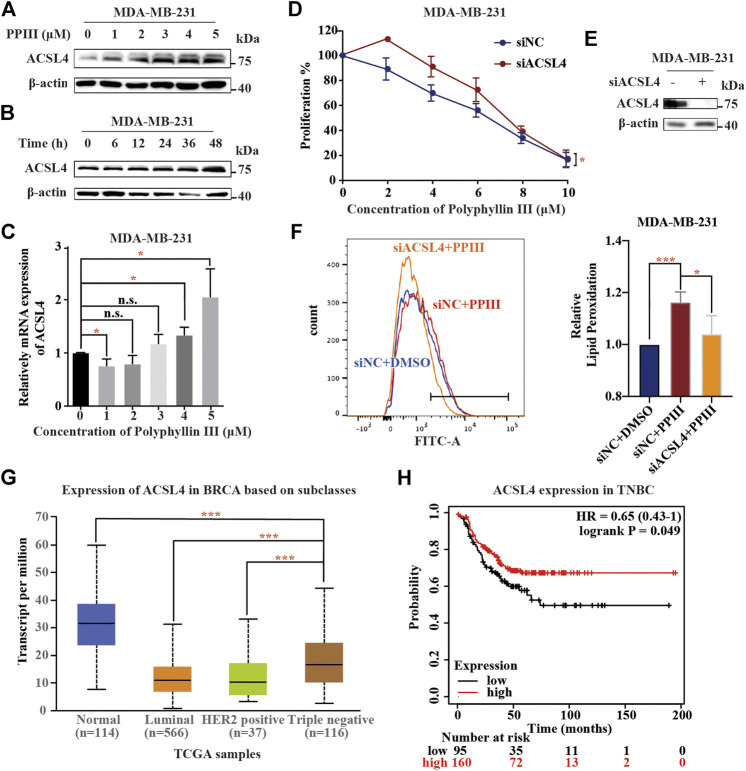
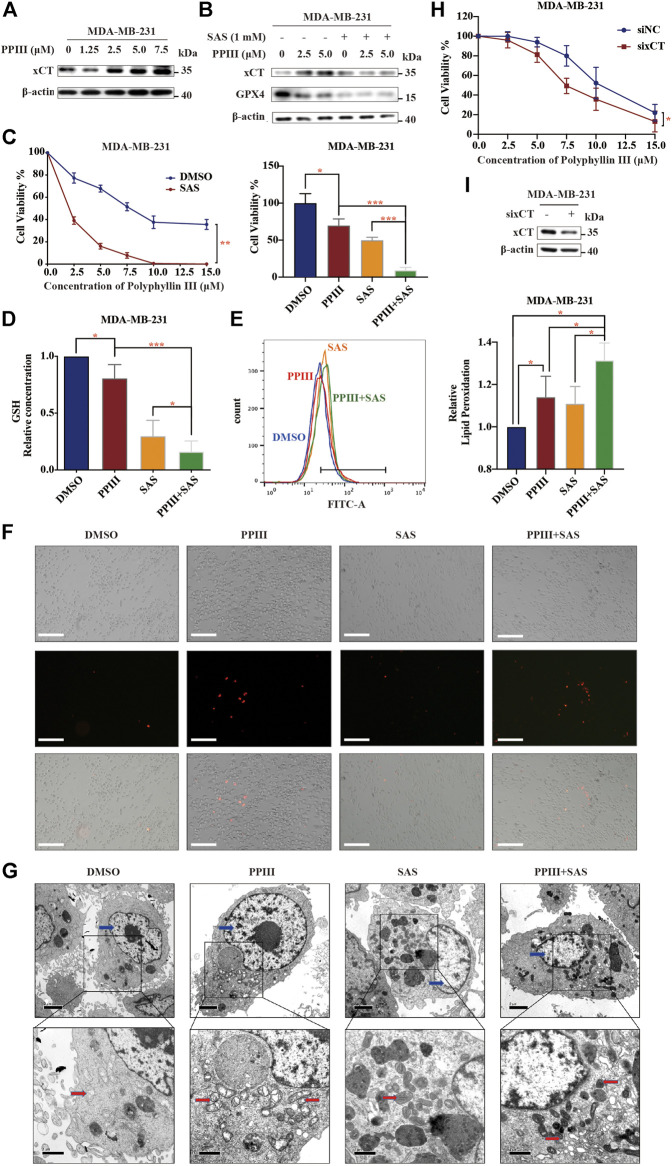
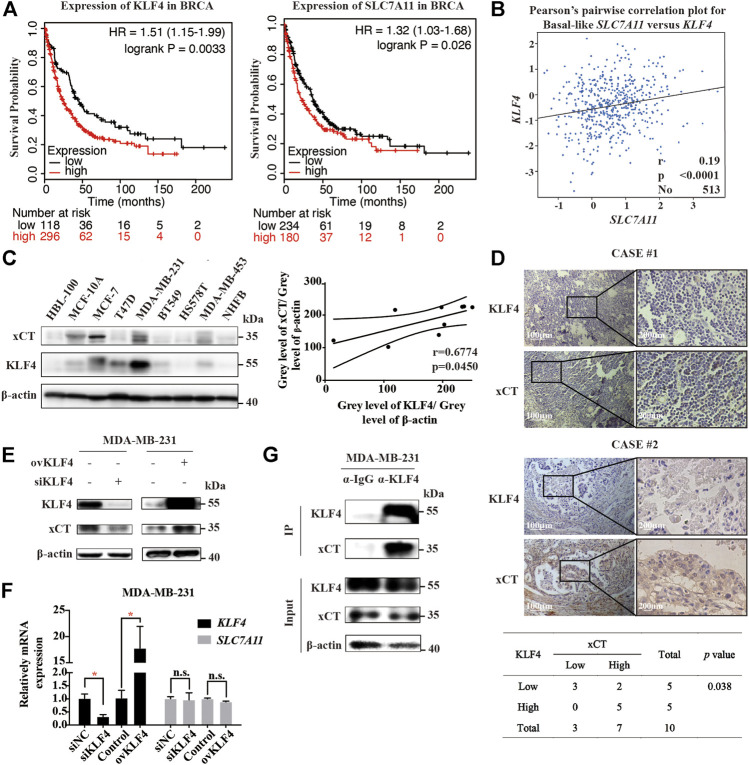
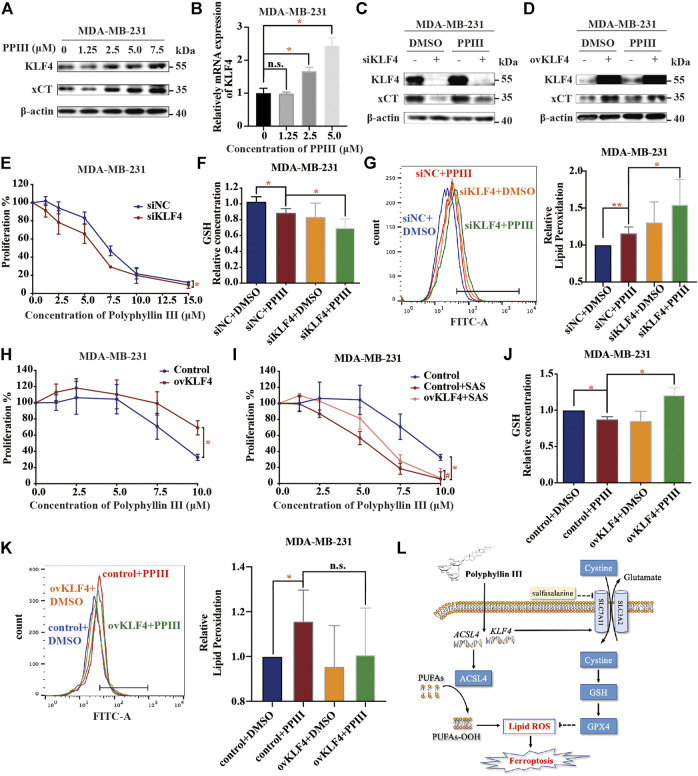
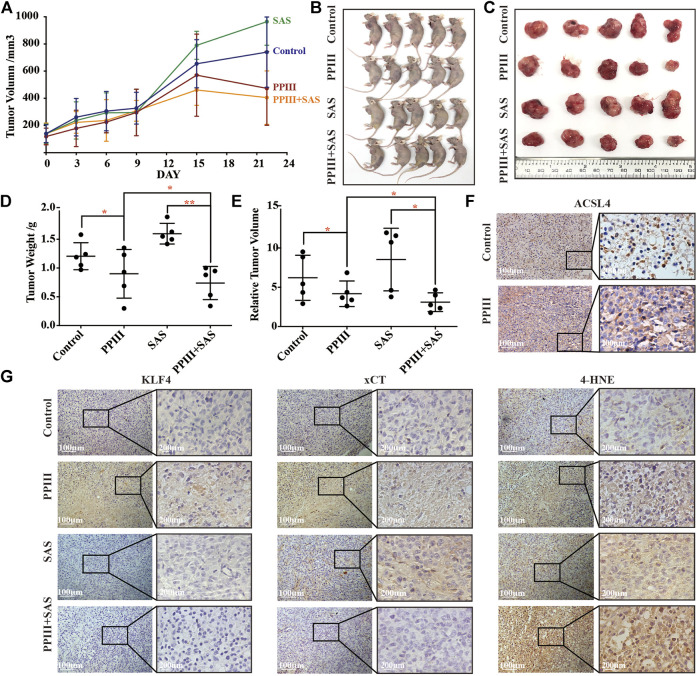
Ferroptosis, which is characterized by the accumulation of intracellular iron and subsequent lipid peroxidation, is a newly discovered form of regulated cell death and plays an important role in tumor suppression. Herein, we showed that Polyphyllin III, which is a major saponin extracted from Paris polyphylla rhizomes, exerted its proliferation-inhibitory effect on MDA-MB-231 triple-negative breast cancer cells mainly through ACSL4-mediated lipid peroxidation elevation and ferroptosis induction. ACSL4 deletion partly attenuated Polyphyllin III-induced ferroptosis. Polyphyllin III treatment also induced KLF4-mediated protective upregulation of xCT, which is the negative regulator of ferroptosis. Interestingly, combination with the xCT inhibitor sulfasalazine (SAS) or downregulation of KLF4 sensitized MDA-MB-231 cells to Polyphyllin III. Furthermore, in vivo xenograft models, SAS significantly sensitized MDA-MB-231 breast cancer cells to Polyphyllin III, likely by enhancing intracellular lipid peroxidation and ferroptosis. The results of this study collectively demonstrated that Polyphyllin III exerts its anticancer effect by inducing ferroptosis via ACSL4 in MDA-MB-231 breast cancer cells. More importantly, we observed for the first time that KLF4-mediated xCT upregulation serves as negative feedback during ferroptosis progression, which might contribute to drug resistance in cancer treatment.

Keywords: ACSL4; KLF4; Polyphyllin III; breast cancer; ferroptosis; xCT.


Conflict of interest statement

The authors declare that the research was conducted in the absence of any commercial or financial relationships that could be construed as a potential conflict of interest.

Figures

FIGURE 1
FIGURE 1
Polyphyllin III induces ferroptosis in breast cancer cells. (A). MDA-MB-231, HS578T, MCF-7, and T47D cells were treated with different concentrations of Polyphyllin III for 24, 48 and 72 h (DMSO was added to replenish to the same volume). The cell viability was assayed (n = 3 independent repeats). (B). HBL-100 breast epithelial cells were treated with different concentrations of Polyphyllin III for 24, 48 and 72 h (DMSO was added to replenish to the same volume). The cell viability was assayed (n = 3 independent repeats). (C). MDA-MB-231 cells were treated with 5 μM Polyphyllin III for 24 h in the absence or presence of 20 μM Z-VAD-FMK, 1 μM (E)-necrosulfonamide (Necro), 10 μM 3-methyladenine (3-MA), 500 nM ferrostatin-1 (Fer-1), 200 nM liproxstatin-1 (Lipo-1), 50 μM deferoxamine (DFO), and 10 μM ciclopirox (CPX). The cell viability was assayed (n = 3 independent repeats, p values were calculated using two-tailed unpaired Student’s t-test). (D). MDA-MB-231 cells were treated with 5 μM Polyphyllin III (PPIII) for 24 h in the absence or presence of 500 nM ferrostatin-1 (Fer-1). Propidium iodide (PI) staining for dead cells was conducted and observed under fluorescence microscopy. (E). Transmission electron microscopy images of MDA-MB-231 cells treated with DMSO (Control) or 5 μM Polyphyllin III (PPIII) for 24 h. Red arrows, mitochondria; blue arrows, nucleus. (F). The protein expression level of ACSL4 in different cell lines was analyzed by western blot. (G). MDA-MB-231 cells were treated with DMSO or 5 μM Polyphyllin III (PPIII) for 24 h. The relative levels of GSH were assayed (error bars are means ± SD, n = 3 independent repeats, p values were calculated using a two-tailed unpaired Student’s t-test). (H). Western blot analysis of GPX4 expression in MDA-MB-231 cells after Polyphyllin III (0–7.5 μM) treatment for 24 h. (I). MDA-MB-231 cells were treated with 5 μM Polyphyllin III (PPIII) for 24 h in the absence or presence of 500 nM ferrostatin-1 (Fer-1). The relative levels of lipid peroxidation were assayed by C11-BODIPY fluorescence (the error bars show the means ± SD, n = 3 independent repeats, p values were calculated using a two-tailed unpaired Student’s t-test). *p < 0.05; **p < 0.01; ***p < 0.001; n. s., not significant (p > 0.05).
FIGURE 2
FIGURE 2
Polyphyllin III induces ferroptosis partly by upregulating ACSL4. (A). Western blot analysis of ACSL4 expression in MDA-MB-231 cells after Polyphyllin III (0–5 μM) treatment for 24 h (DMSO was added to replenish to the same volume). (B). Western blot analysis of ACSL4 expression in MDA-MB-231 cells after 5 μM Polyphyllin III treatment for 6, 12, 24, 36, and 48 h. (C). The relative ACSL4 mRNA level was measured by qRT-PCR after MDA-MB-231 cells were treated with Polyphyllin III (0–5 μM) for 24 h (the error bars show the means ± SD, n = 3 independent repeats, p values were calculated using two-tailed unpaired Student’s t-test). (D). MDA-MB-231 cells were transfected with negative control siRNA (siNC) or ACSL4 siRNA (siACSL4) and then treated with Polyphyllin III (0–25 μM) for 24 h. The cell viability was assayed (n = 3 independent repeats, p values were calculated using two-tailed paired Student’s t-test). (E). Western blot analysis of ACSL4 expression in MDA-MB-231 cells after transfection with ACSL4 siRNA for 72 h. (F). MDA-MB-231 cells were transfected with negative control siRNA (siNC) or ACSL4 siRNA (siACSL4) and then treated with 5 μM Polyphyllin III for 24 h. The relative levels of lipid peroxidation were assayed by C11-BODIPY fluorescence (the error bars show the means ± SD, n = 3 independent repeats, p values were calculated using a two-tailed unpaired Student’s t-test). (G). Online UALCAN analysis of the expression of ACSL4 in BRCA based on subclasses. (H). Online Kaplan-Meier Plotter analysis (http://kmplot.com/analysis) of triple-negative breast cancer patient outcomes. Differences in relapse-free survival (RFS) were compared in groups stratified by ACSL4 status. *p < 0.05; **p < 0.01; ***p < 0.001; n. s., not significant (p > 0.05).
FIGURE 3
FIGURE 3
Polyphyllin III induces protective xCT upregulation, and its combination with SAS sensitizes breast cancer cells to Polyphyllin III. (A). Western blot analysis of xCT expression in MDA-MB-231 cells after Polyphyllin III (0–7.5 μM) treatment for 24 h. (B). Western blot analysis of xCT and GPX4 expression in MDA-MB-231 cells after Polyphyllin III treatment for 24 h with or without 1 mM SAS. (C–G). MDA-MB-231 cells were treated with Polyphyllin III (0–15 μM) for 24 h in the absence or presence of 1 mM SAS. The error bars show the means ± SD, n = 3 independent repeats, and p values were calculated using a two-tailed unpaired Student’s t-test (C) The cell viability was assayed (D) The relative levels of GSH were assayed (E) The relative levels of lipid peroxidation were assayed by C11-BODIPY fluorescence (F) Propidium iodide (PI) staining for dead cells was conducted and observed under fluorescence microscopy (G) Transmission electron microscopy images were taken: red arrows, mitochondria; blue arrows, nucleus. (H). MDA-MB-231 cells were transfected with negative control siRNA (siNC) or xCT siRNA (sixCT) and then treated with 5 μM Polyphyllin III for 24 h. The cell viability was assayed (n = 3 independent repeats, p values were calculated using two-tailed paired Student’s t-test). (I). Western blot analysis of xCT expression after sixCT transfection. *p < 0.05; **p < 0.01; ***p < 0.001; n. s., not significant (p > 0.05).
FIGURE 4
FIGURE 4
The expressions of KLF4 and xCT are positively correlated in breast cancer. (A). Online Kaplan-Meier Plotter analysis (http://kmplot.com/analysis) of breast cancer patient outcomes. Differences in post progression survival (PPS) were compared in groups stratified by KLF4 or SLC7A11 status. (B). Analysis of the GEO database shows that the expression levels of KLF4 and SLC7A11 in basal-like breast cancer cells are positively correlated. (C). Western blot analysis of KLF4 and xCT expression in different breast cancer cell lines. The p value was calculated using Pearson correlation analysis. (D). Immunohistochemical staining of KLF4 and xCT in clinical specimens of breast cancer patients. The correlation between KLF4 and xCT was assayed (n = 10, p value was calculated using Pearson correlation analysis). (E). Western blot analysis of xCT expression after knocking down or overexpressing KLF4. (F). qRT-PCR analysis of relative xCT mRNA expression after knocking down or overexpressing KLF4. (G). The protein interaction between KLF4 and xCT was detected by immunoprecipitation. *p < 0.05; **p < 0.01; ***p < 0.001; n. s., not significant (p > 0.05).
FIGURE 5
FIGURE 5
KLF4 is involved in Polyphyllin III-induced protective upregulation of xCT. (A). Western blot analysis of KLF4 and xCT expression in MDA-MB-231 cells after Polyphyllin III (0–7.5 μM) treatment for 24 h. (B). qRT-PCR analysis of relative KLF4 mRNA expression after Polyphyllin III (0–5 μM) treatment for 24 h. (C,D). Western blot analysis of KLF4 and xCT expression after 5 μM Polyphyllin III treatment for 24 h when transfected (C) with negative control siRNA (siNC) or KLF4 siRNA (siKLF4) and (D) with the control plasmid (Control) or KLF4 plasmid (ovKLF4). (E–G). MDA-MB-231 cells were transfected with negative control siRNA (siNC) or KLF4 siRNA (siKLF4) and then treated with 5 μM Polyphyllin III for 24 h. The error bars show the means ± SD, n = 3 independent repeats, and p values were calculated using a two-tailed paired Student’s t-test in (E) and a two-tailed unpaired Student’s t-test in (F) and (G) (E) The cell viability was assayed (F) The relative levels of GSH were assayed (G) The relative levels of lipid peroxidation were assayed by C11-BODIPY fluorescence. (H–K). KLF4 was overexpressed using plasmid transfection in MDA-MB-231 cells, and then the cells were treated with 5 μM Polyphyllin III for 24 h. The error bars show the means ± SD, n = 3 independent repeats, p values were calculated using a two-tailed paired Student’s t-test in (H) and (I) and a two-tailed unpaired Student’s t-test in (J)–(K) (H) The cell viability was assayed (I) The cells were treated with 5 μM Polyphyllin III in the absence or presence of SAS for 24 h. The cell viability was assayed (J) The relative levels of GSH were assayed (K) The relative levels of lipid peroxidation were assayed by C11-BODIPY fluorescence. (L) Schematic diagram of the mechanism of Polyphyllin III in MDA-MB-231 cells. *p < 0.05; **p < 0.01; ***p < 0.001; n. s., not significant (p > 0.05).
FIGURE 6
FIGURE 6
Polyphyllin III treatment with or without SAS suppressed tumor growth in vivo. (A). Athymic nude mice were orthotopically injected with MDA-MB-231 cells and treated with Polyphyllin III and/or SAS daily by intraperitoneal injection until the end of experiments. The tumor volumes of MDA-MB-231 xenograft tumors at different time points (days) during the indicated treatments are shown. The error bars show the means ± SD, n = 5 independent repeats. p values were calculated using a two-tailed paired Student’s t-test. (B). Images of the nude mice from each treatment group are shown at day 22 after the indicated treatment. (C). Isolated tumor images from each treatment group are shown at day 22 after the indicated treatment. (D). Individual value plot showing the weights of MDA-MB-231 tumor xenografts in each indicated treatment group at day 22. (E). Individual value plot showing the relative tumor volumes of MDA-MB-231 tumor xenografts in each indicated treatment group at day 22. (F). Immunohistochemical staining of ACSL4 in MDA-MB-231 xenograft tumors with or without Polyphyllin III treatment. (G). Immunohistochemical staining of KLF4, xCT and 4-HNE in MDA-MB-231 xenograft tumors with the indicated treatments. Representative images of each group are shown. *p < 0.05; **p < 0.01; ***p < 0.001; n. s., not significant (p > 0.05).

Similar articles

Cited by

References

    1. Banik U., Parasuraman S., Adhikary A. K., Othman N. H. (2017). Curcumin: The Spicy Modulator of Breast Carcinogenesis. J. Exp. Clin. Cancer Res. 36, 1–16. 10.1186/s13046-017-0566-5 - DOI - PMC - PubMed
    1. Bray F., Ferlay J., Soerjomataram I., Siegel R. L., Torre L. A., Jemal A. (2018). Global Cancer Statistics 2018: GLOBOCAN Estimates of Incidence and Mortality Worldwide for 36 Cancers in 185 Countries. CA: A Cancer J. Clinicians 68, 394–424. 10.3322/caac.21492 - DOI - PubMed
    1. Brigelius-Flohé R., Kipp A. (2009). Glutathione Peroxidases in Different Stages of Carcinogenesis. Biochim. Biophys. Acta (Bba) - Gen. Subjects 1790, 1555–1568. 10.1016/j.bbagen.2009.03.006 - DOI - PubMed
    1. Chen D., Eyupoglu I. Y., Savaskan N. (2017). Ferroptosis and Cell Death Analysis by Flow Cytometry. Methods Mol. Biol. 1601, 71–77. 10.1007/978-1-4939-6960-9_6 - DOI - PubMed
    1. Conrad M., Friedmann Angeli J. P., Pedro J. (2015). Glutathione Peroxidase 4 (Gpx4) and Ferroptosis: What's So Special about it?. Mol. Cell Oncol. 2, e995047. 10.4161/23723556.2014.995047 - DOI - PMC - PubMed

LinkOut - more resources