

Development and Validation of a CD8+ T Cell Infiltration-Related Signature for Melanoma Patients
- PMID: 34040608
- PMCID: PMC8141567
- DOI: 10.3389/fimmu.2021.659444
Development and Validation of a CD8+ T Cell Infiltration-Related Signature for Melanoma Patients
Abstract
Aim: Immunotherapy shows efficacy in only a subset of melanoma patients. Here, we intended to construct a risk score model to predict melanoma patients' sensitivity to immunotherapy.
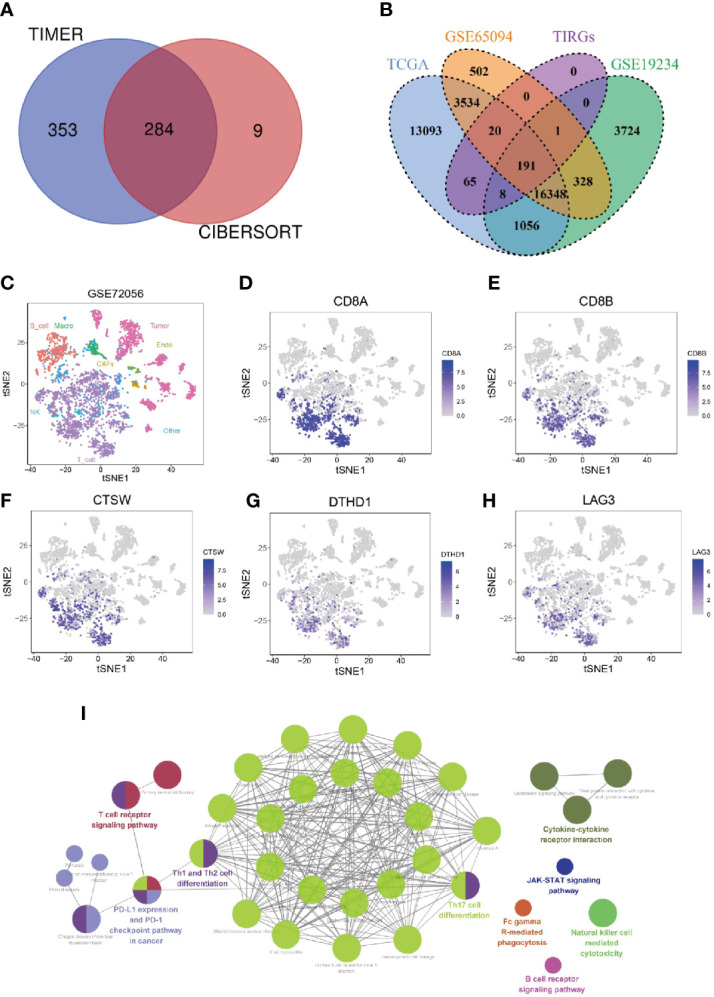
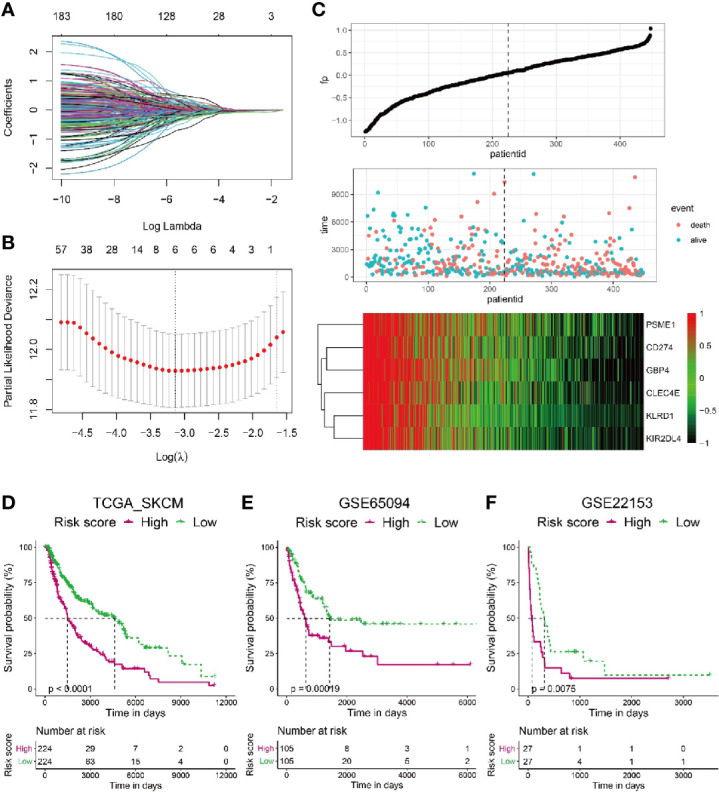
Methods: Integration analyses were performed on melanoma patients from high-dimensional public datasets. The CD8+ T cell infiltration related genes (TIRGs) were selected via TIMER and CIBERSORT algorithm. LASSO Cox regression was performed to screen for the crucial TIRGs. Single sample gene set enrichment analysis (ssGSEA) and ESTIMATE algorithm were used to evaluate the immune activity. The prognostic value of the risk score was determined by univariate and multivariate Cox regression analysis.
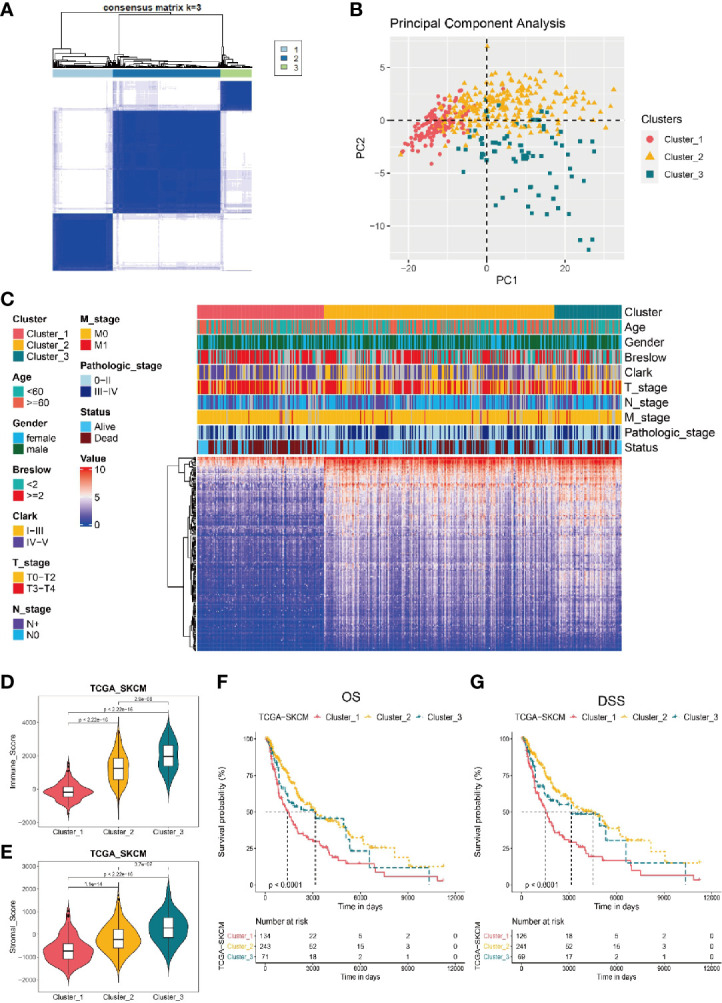
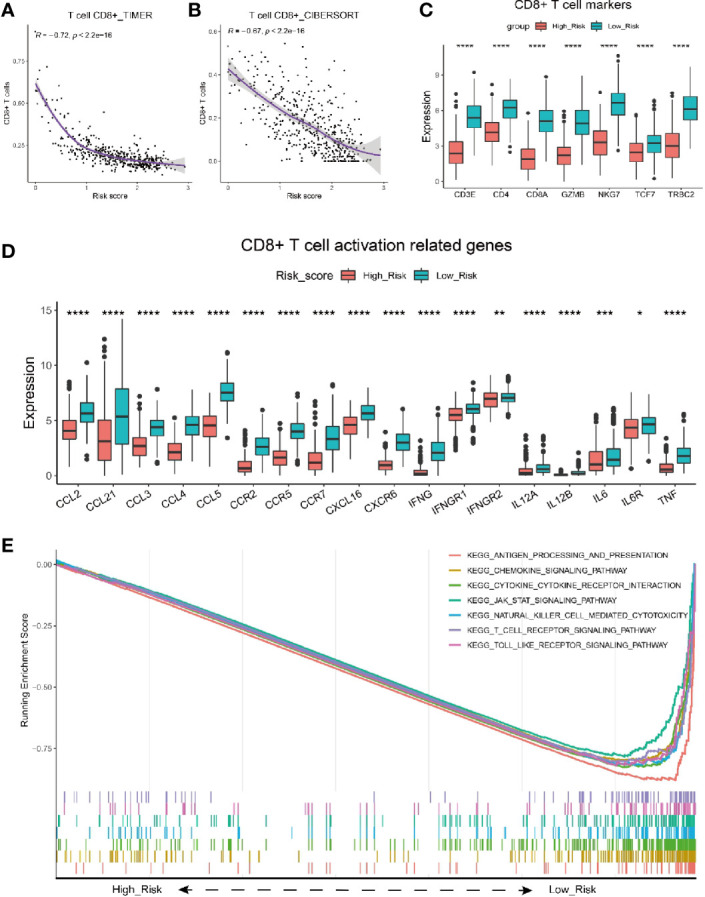
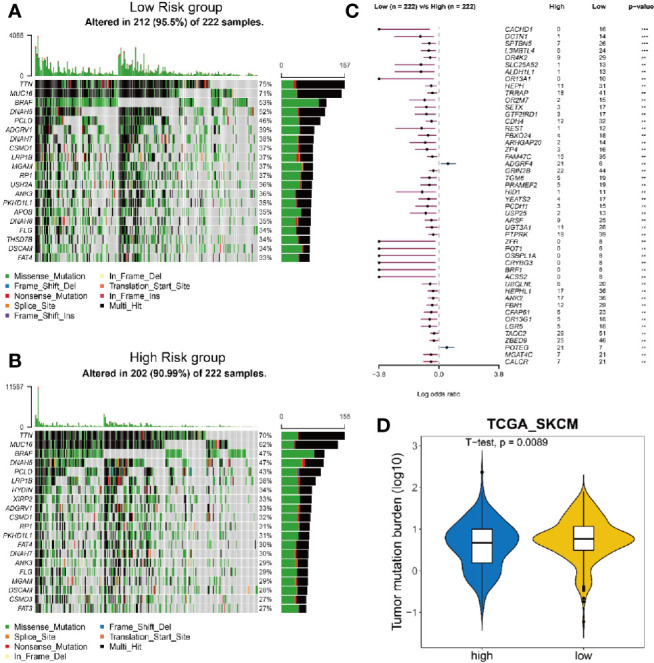
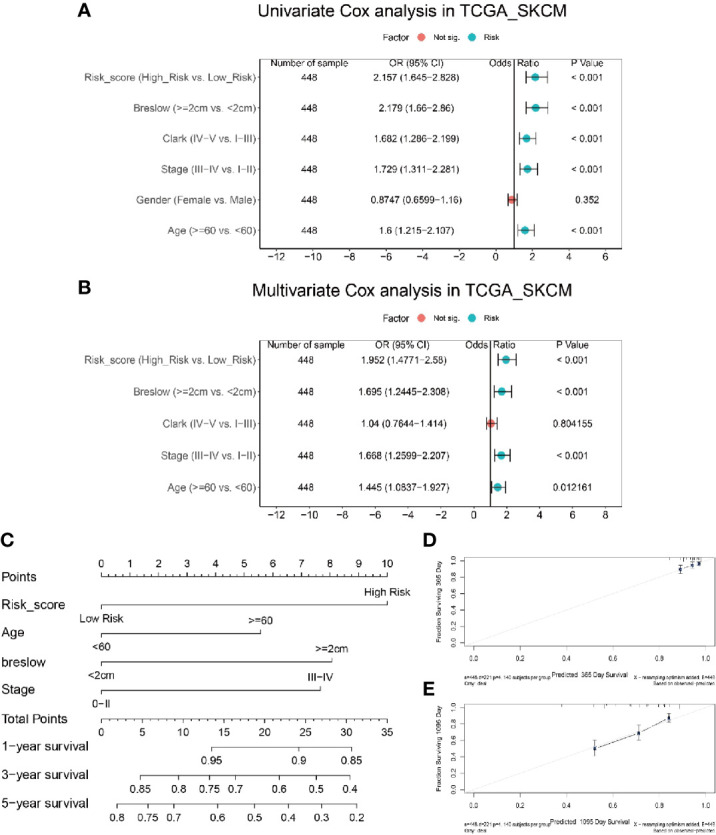
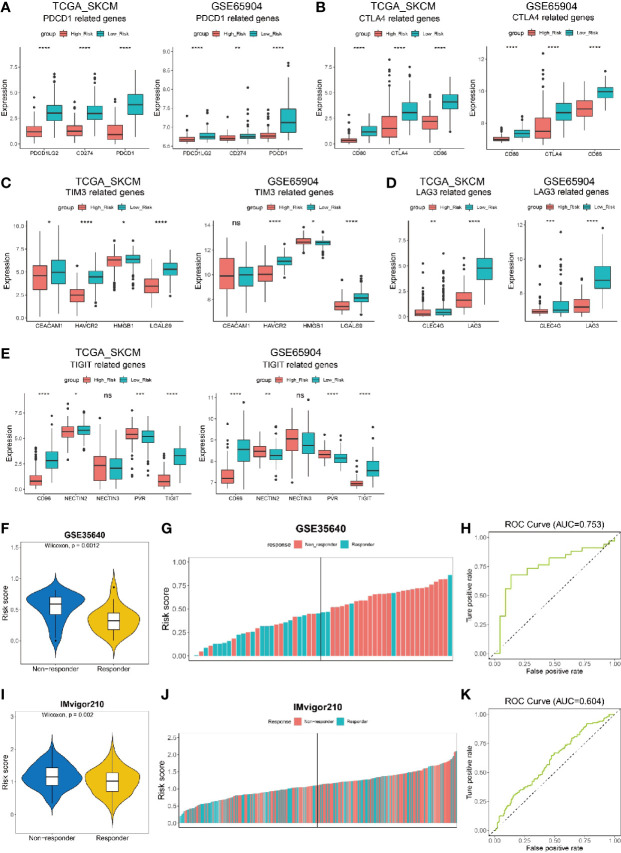
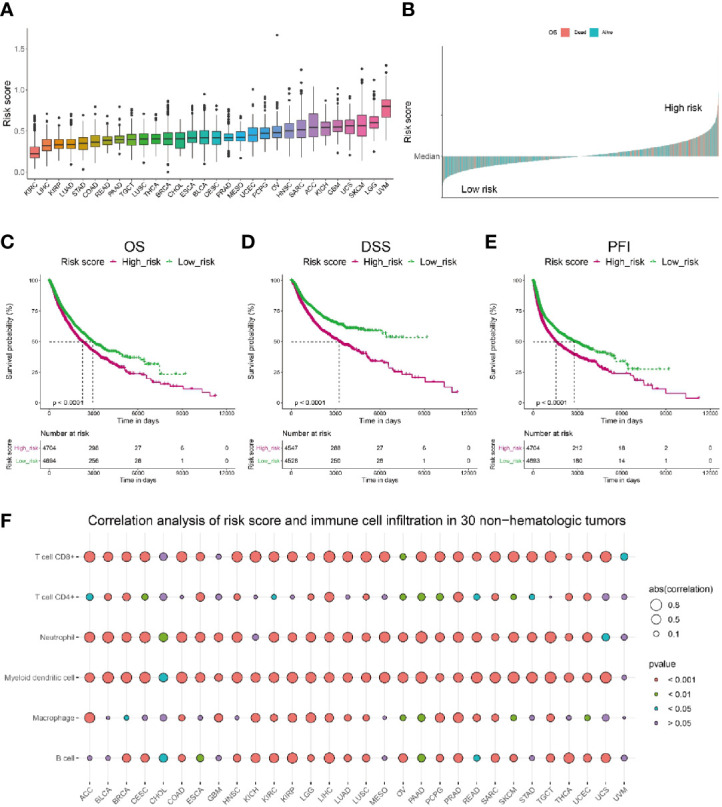
Results: 184 candidate TIRGs were identified in melanoma patients. Based on the candidate TIRGs, melanoma patients were classified into three clusters which were characterized by different immune activity. Six signature genes were further screened out of 184 TIRGs and a representative risk score for patient survival was constructed based on these six signature genes. The risk score served as an indicator for the level of CD8+ T cell infiltration and acted as an independent prognostic factor for the survival of melanoma patients. By using the risk score, we achieved a good predicting result for the response of cancer patients to immunotherapy. Moreover, pan-cancer analysis revealed the risk score could be used in a wide range of non-hematologic tumors.
Conclusions: Our results showed the potential of using signature gene-based risk score as an indicator to predict melanoma patients' sensitivity to immunotherapy.
Keywords: CD8+ T cells; immune response; immunotherapy; melanoma; single cell RNA sequencing analysis.
Copyright © 2021 Yuan, Zhu, Lan, Duan, Zhu, Zhang, Li, Qu, Feng, Cai and Song.
Conflict of interest statement
The authors declare that the research was conducted in the absence of any commercial or financial relationships that could be construed as a potential conflict of interest.
Figures
Similar articles
-
Tumor Immune Microenvironment Characterization Identifies Prognosis and Immunotherapy-Related Gene Signatures in Melanoma.Front Immunol. 2021 May 6;12:663495. doi: 10.3389/fimmu.2021.663495. eCollection 2021. Front Immunol. 2021. PMID: 34025664 Free PMC article.
-
Pan-Cancer Analysis of Immune Cell Infiltration Identifies a Prognostic Immune-Cell Characteristic Score (ICCS) in Lung Adenocarcinoma.Front Immunol. 2020 Jun 30;11:1218. doi: 10.3389/fimmu.2020.01218. eCollection 2020. Front Immunol. 2020. PMID: 32714316 Free PMC article.
-
Discovering biomarkers associated with infiltration of CD8+ T cells and tumor-associated fibrosis in colon adenocarcinoma using single-cell RNA sequencing and gene co-expression network.Front Immunol. 2025 Mar 31;16:1496640. doi: 10.3389/fimmu.2025.1496640. eCollection 2025. Front Immunol. 2025. PMID: 40230854 Free PMC article.
-
Prognostic and Predictive Immunohistochemistry-Based Biomarkers in Cancer and Immunotherapy.Hematol Oncol Clin North Am. 2019 Apr;33(2):291-299. doi: 10.1016/j.hoc.2018.12.005. Epub 2019 Jan 17. Hematol Oncol Clin North Am. 2019. PMID: 30833001 Free PMC article. Review.
-
Ferroptosis-Associated Classifier and Indicator for Prognostic Prediction in Cutaneous Melanoma.J Oncol. 2021 Oct 28;2021:3658196. doi: 10.1155/2021/3658196. eCollection 2021. J Oncol. 2021. PMID: 34745259 Free PMC article. Review.
Cited by
-
CD8-Lymphocytic Phenotype Significance in Primary Multiple and Familial Melanoma with Various CDKN2A Mutational Status.Medicina (Kaunas). 2023 Dec 12;59(12):2151. doi: 10.3390/medicina59122151. Medicina (Kaunas). 2023. PMID: 38138255 Free PMC article.
-
Tumor-agnostic transcriptome-based classifier identifies spatial infiltration patterns of CD8+T cells in the tumor microenvironment and predicts clinical outcome in early-phase and late-phase clinical trials.J Immunother Cancer. 2024 Apr 22;12(4):e008185. doi: 10.1136/jitc-2023-008185. J Immunother Cancer. 2024. PMID: 38649280 Free PMC article.
-
Core immune cell infiltration signatures identify molecular subtypes and promote precise checkpoint immunotherapy in cutaneous melanoma.Front Immunol. 2022 Aug 22;13:914612. doi: 10.3389/fimmu.2022.914612. eCollection 2022. Front Immunol. 2022. PMID: 36072600 Free PMC article.
-
Identification and validation of immunogenic cell death-related score in uveal melanoma to improve prediction of prognosis and response to immunotherapy.Aging (Albany NY). 2023 May 3;15(9):3442-3464. doi: 10.18632/aging.204680. Epub 2023 May 3. Aging (Albany NY). 2023. PMID: 37142279 Free PMC article.
-
Tumor immune microenvironment (TIME) to enhance antitumor immunity.Eur J Med Res. 2023 May 13;28(1):169. doi: 10.1186/s40001-023-01125-3. Eur J Med Res. 2023. PMID: 37179365 Free PMC article. Review.
References
Publication types
MeSH terms
Substances
LinkOut - more resources
Full Text Sources
Other Literature Sources
Medical
Research Materials