

Morpho-Physiological and Proteomic Response of Bt-Cotton and Non-Bt Cotton to Drought Stress
- PMID: 34040622
- PMCID: PMC8143030
- DOI: 10.3389/fpls.2021.663576
Morpho-Physiological and Proteomic Response of Bt-Cotton and Non-Bt Cotton to Drought Stress
Abstract
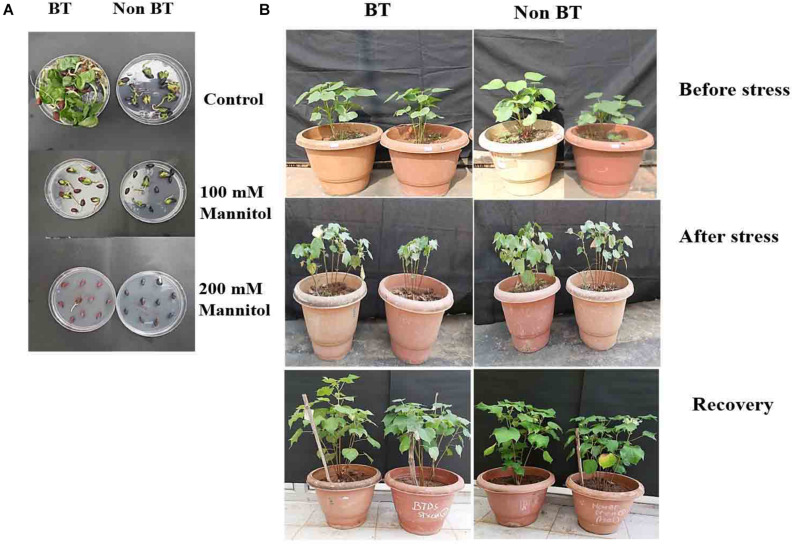
Drought stress impacts cotton plant growth and productivity across countries. Plants can initiate morphological, cellular, and proteomic changes to adapt to unfavorable conditions. However, our knowledge of how cotton plants respond to drought stress at the proteome level is limited. Herein, we elucidated the molecular coordination underlining the drought tolerance of two inbred cotton varieties, Bacillus thuringiensis-cotton [Bt-cotton + Cry1 Ac gene and Cry 2 Ab gene; NCS BG II BT (BTCS/BTDS)] and Hybrid cotton variety [Non-Bt-cotton; (HCS/HDS)]. Our morphological observations and biochemical experiments showed a different tolerance level between two inbred lines to drought stress. Our proteomic analysis using 2D-DIGE revealed that the changes among them were not obviously in respect to their controls apart from under drought stress, illustrating the differential expression of 509 and 337 proteins in BTDS and HDS compared to their controls. Among these, we identified eight sets of differentially expressed proteins (DEPs) and characterized them using MALDI-TOF/TOF mass spectrometry. Furthermore, the quantitative real-time PCR analysis was carried out with the identified drought-related proteins and confirmed differential expressions. In silico analysis of DEPs using Cytoscape network finds ATPB, NAT9, ERD, LEA, and EMB2001 to be functionally correlative to various drought-responsive genes LEA, AP2/ERF, WRKY, and NAC. These proteins play a vital role in transcriptomic regulation under stress conditions. The higher drought response in Bt cotton (BTCS/BTDS) attributed to the overexpression of photosynthetic proteins enhanced lipid metabolism, increased cellular detoxification and activation chaperones, and reduced synthesis of unwanted proteins. Thus, the Bt variety had enhanced photosynthesis, elevated water retention potential, balanced leaf stomata ultrastructure, and substantially increased antioxidant activity than the Non-Bt cotton. Our results may aid breeders and provide further insights into developing new drought-tolerant and high-yielding cotton hybrid varieties.
Keywords: 2D difference gel electrophoresis; Cytoscape; MALDI-TOF/TOF MS; abiotic stress; qRT-PCR.
Copyright © 2021 Nagamalla, Alaparthi, Mellacheruvu, Gundeti, Earrawandla and Sagurthi.
Conflict of interest statement
The authors declare that the research was conducted in the absence of any commercial or financial relationships that could be construed as a potential conflict of interest.
Figures


Similar articles
-
Proteomic responses of drought-tolerant and drought-sensitive cotton varieties to drought stress.Mol Genet Genomics. 2016 Jun;291(3):1293-303. doi: 10.1007/s00438-016-1188-x. Epub 2016 Mar 3. Mol Genet Genomics. 2016. PMID: 26941218
-
Tandem mass tag-based (TMT) quantitative proteomics analysis reveals the response of fine roots to drought stress in cotton (Gossypium hirsutum L.).BMC Plant Biol. 2020 Jul 11;20(1):328. doi: 10.1186/s12870-020-02531-z. BMC Plant Biol. 2020. PMID: 32652934 Free PMC article.
-
Characterization of the late embryogenesis abundant (LEA) proteins family and their role in drought stress tolerance in upland cotton.BMC Genet. 2018 Jan 15;19(1):6. doi: 10.1186/s12863-017-0596-1. BMC Genet. 2018. PMID: 29334890 Free PMC article.
-
Time-dependent leaf proteome alterations of Brachypodium distachyon in response to drought stress.Plant Mol Biol. 2017 Aug;94(6):609-623. doi: 10.1007/s11103-017-0628-2. Epub 2017 Jun 24. Plant Mol Biol. 2017. PMID: 28647905
-
Physiological and Differential Proteomic Analyses of Imitation Drought Stress Response in Sorghum bicolor Root at the Seedling Stage.Int J Mol Sci. 2020 Dec 1;21(23):9174. doi: 10.3390/ijms21239174. Int J Mol Sci. 2020. PMID: 33271965 Free PMC article.
Cited by
-
Drought stress amelioration in tomato (Solanum lycopersicum L.) seedlings by biostimulant as regenerative agent.Front Plant Sci. 2023 Aug 15;14:1211210. doi: 10.3389/fpls.2023.1211210. eCollection 2023. Front Plant Sci. 2023. PMID: 37662171 Free PMC article.
-
Effect of Drought Stress on Degradation and Remodeling of Membrane Lipids in Nostoc flagelliforme.Foods. 2022 Jun 18;11(12):1798. doi: 10.3390/foods11121798. Foods. 2022. PMID: 35741996 Free PMC article.
-
Integrative physiological, biochemical, and proteomic analysis of the leaves of two cotton genotypes under heat stress.PLoS One. 2025 Jan 9;20(1):e0316630. doi: 10.1371/journal.pone.0316630. eCollection 2025. PLoS One. 2025. PMID: 39787180 Free PMC article.
-
Cotton proteomics: Dissecting the stress response mechanisms in cotton.Front Plant Sci. 2022 Nov 17;13:1035801. doi: 10.3389/fpls.2022.1035801. eCollection 2022. Front Plant Sci. 2022. PMID: 36466262 Free PMC article. Review.
-
Evaluation of growth, physiological response, and drought resistance of different flue-cured tobacco varieties under drought stress.Front Plant Sci. 2024 Sep 26;15:1442618. doi: 10.3389/fpls.2024.1442618. eCollection 2024. Front Plant Sci. 2024. PMID: 39391771 Free PMC article.
References
-
- Agarwal P., Reddy M. K., Sopory S. K., Agarwal P. K. (2009). Plant rabs: characterization, functional diversity, and role in stress tolerance. Plant Mol. Biol. Rep. 27 417–430. 10.1007/s11105-009-0100-9 - DOI
-
- Ashraf M., Foolad M. R. (2007). Roles of glycine betaine and proline in improving plant abiotic stress resistance. Environ. Exp. Bot. 59 206–216. 10.1016/j.envexpbot.2005.12.006 - DOI
LinkOut - more resources
Full Text Sources
Other Literature Sources
Research Materials