. 2021 Jun;15(3):439-451.
doi: 10.1007/s11571-020-09635-0. Epub 2020 Sep 16.

Cross-frequency and iso-frequency estimation of functional corticomuscular coupling after stroke

Affiliations

Cross-frequency and iso-frequency estimation of functional corticomuscular coupling after stroke

Ping Xie et al. Cogn Neurodyn. 2021 Jun.

Abstract

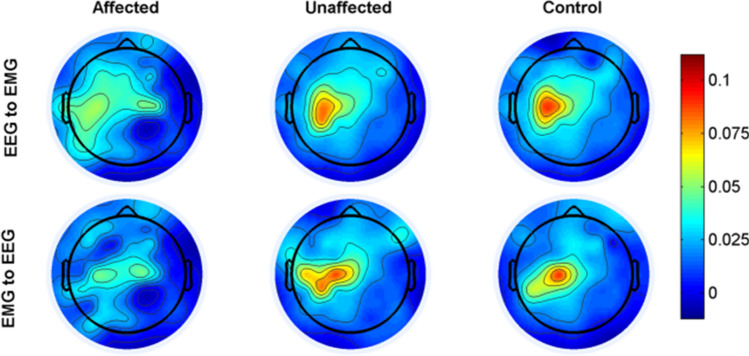
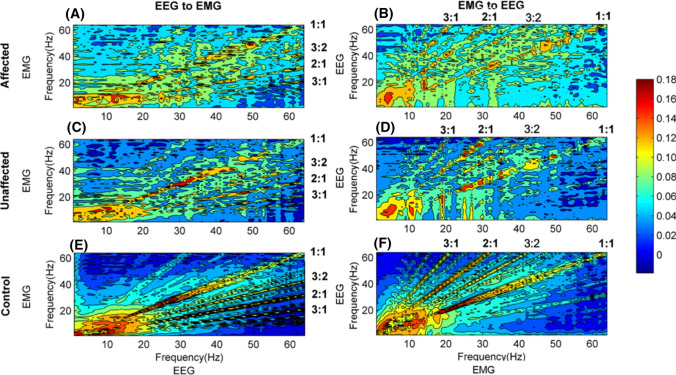
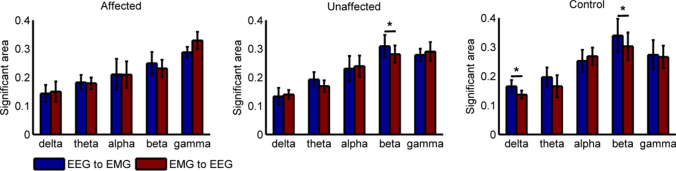
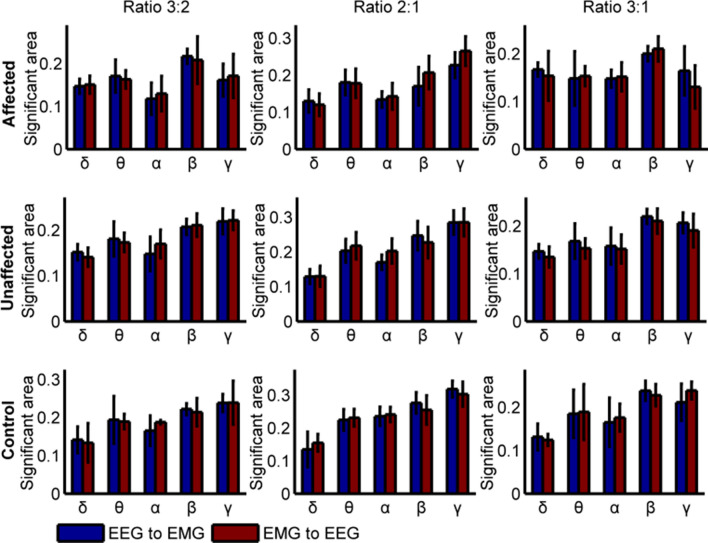
Functional corticomuscular coupling (FCMC) between the brain and muscles has been used for motor function assessment after stroke. Two types, iso-frequency coupling (IFC) and cross-frequency coupling (CFC), are existed in sensory-motor system for healthy people. However, in stroke, only a few studies focused on IFC between electroencephalogram (EEG) and electromyogram (EMG) signals, and no CFC studies have been found. Considering the intrinsic complexity and rhythmicity of the biological system, we first used the wavelet package transformation (WPT) to decompose the EEG and EMG signals into several subsignals with different frequency bands, and then applied transfer entropy (TE) to analyze the IFC and CFC relationship between each pair-wise subsignal. In this study, eight stroke patients and eight healthy people were enrolled. Results showed that both IFC and CFC still existed in stroke patients (EEG → EMG: 1:1, 3:2, 2:1; EMG → EEG: 1:1, 2:1, 2:3, 3:1). Compared with the stroke-unaffected side and healthy controls, the stroke-affected side yielded lower alpha, beta and gamma synchronization (IFC: beta; CFC: alpha, beta and gamma). Further analysis indicated that stroke patients yielded no significant difference of the FCMC between EEG → EMG and EMG → EEG directions. Our study indicated that alpha and beta bands were essential to concentrating and maintaining the motor capacities, and provided a new insight in understanding the propagation and function in the sensory-motor system.

Keywords: Cross-frequency coupling; Functional corticomuscular coupling; Iso-frequency coupling; Stroke.


Conflict of interest statement

Conflict of interestThe authors declare that they have no conflict of interes.

Figures

Fig. 1
Fig. 1
The Synchronous acquisition of the EEG and EMG signals
Fig. 2
Fig. 2
The topographic distribution where the strongest interaction in both directions for stroke-affected side, stroke-unaffected side and healthy controls, respectively. And the colorbar indicates the level of coherence (red, higher level; blue, lower level)
Fig. 3
Fig. 3
The grand average of TE values in two directions for stroke-affected side, stroke-unaffected side and healthy controls, respectively. (A) and (B) for the stroke-affected side, (C) and (D) for stroke-unaffected side and (E) and (F) for healthy controls. In all subgraphs, the frequency ratios are calculated from EEG frequency to EMG frequency. The colorbar indicates the level of TE values (red, higher level; blue, lower level)
Fig. 4
Fig. 4
Comparison of the grand average of ATE values for stroke-affected side, stroke-unaffected side and healthy controls in both pathways. (A)–(F) show the statistical results for theta, delta, alpha, beta band and gamma bands. F shows the grand averages of TE values on the diagonal of Fig. 3
Fig. 5
Fig. 5
Statistical analysis of the grand average of ATE at different bands between descending and ascending pathways for stroke-affected side, stroke-unaffected side and healthy controls, respectively
Fig. 6
Fig. 6
The significant area of TE with the ratios at 1:1, 3:2, 2:1 and 3:1 in two directions. A and D show significant area with ratio at 3:2, B and E with ratio at 2:1 and E and F with ratio at 3:1. The CFC ratio was given as EEG frequency over EMG frequency. “*” denotes p < 0.05, “**” denotes p < 0.01, and “***” denotes p < 0.001
Fig. 7
Fig. 7
Grand-average of TE values in two directions. The CFC ratio was given as EEG frequency over EMG. The first column represents the significant area with ratio at 3:2, the second and third columns with ratios at 2:1 and 3:1
Fig. 8
Fig. 8
Correlation between the Acoh in TE values and the STM test for stroke patients in descending pathway

Similar articles

Cited by

References

    1. Baker S, Olivier E, Lemon R. Coherent oscillations in monkey motor cortex and hand muscle EMG show task-dependent modulation. J Physiol. 1997;501:225–241. - PMC - PubMed
    1. Brown P, Salenius S, Rothwell JC, Hari R. Cortical correlate of the piper rhythm in humans. J Neurophysiol. 1998;80:2911–2917. - PubMed
    1. Canavier CC. Phase-resetting as a tool of information transmission. Curr Opin Neurobiol. 2015;31:206–213. - PMC - PubMed
    1. Canavier CC, Kazanci FG, Prinz AA. Phase resetting curves allow for simple and accurate prediction of robust N: 1 phase locking for strongly coupled neural oscillators. Biophys J . 2009;97:59–73. - PMC - PubMed
    1. Canolty RT, Knight RT. The functional role of cross-frequency coupling. Trends Cognit Sci. 2010;14:506–515. - PMC - PubMed

LinkOut - more resources