

Physicochemical-property guided design of a highly sensitive probe to image nitrosative stress in the pathology of stroke
- PMID: 34040723
- PMCID: PMC8133006
- DOI: 10.1039/c9sc03798e
Physicochemical-property guided design of a highly sensitive probe to image nitrosative stress in the pathology of stroke
Abstract
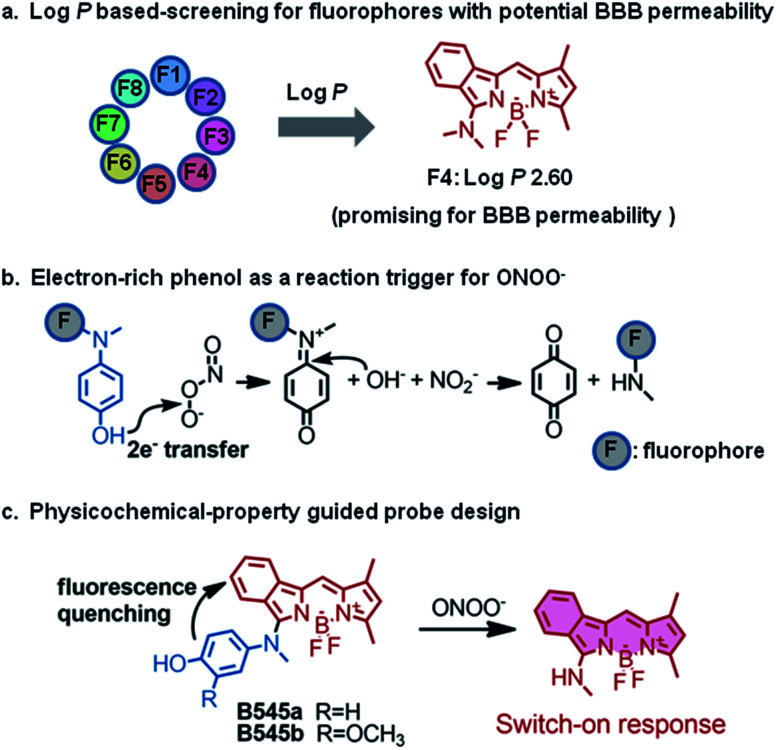
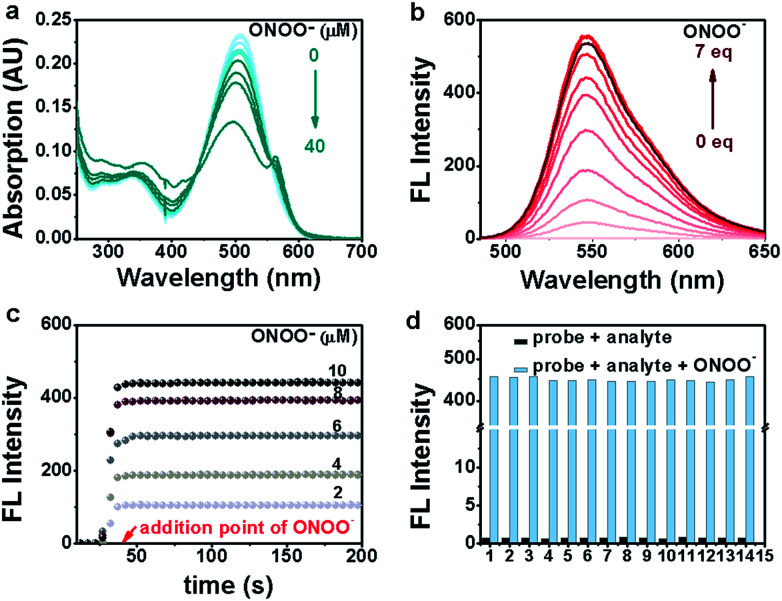
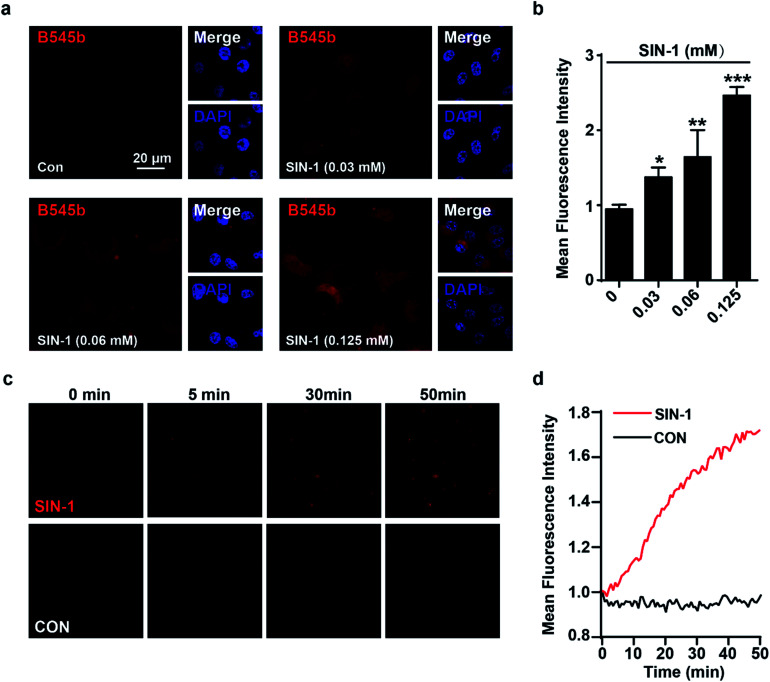
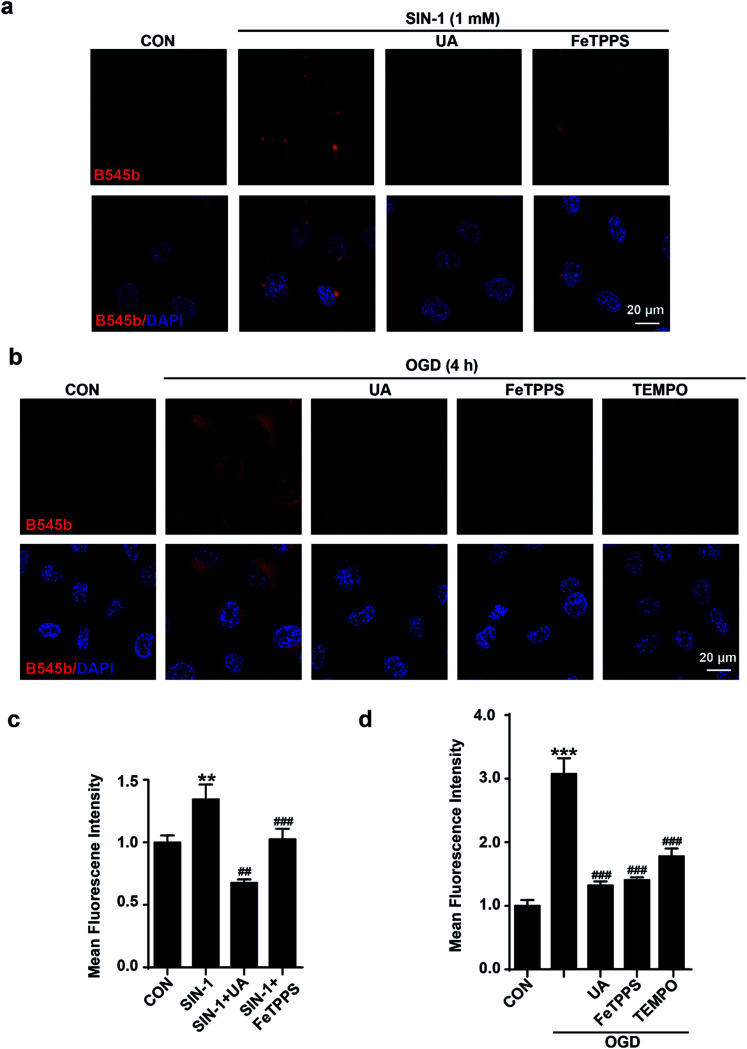
In vivo real-time imaging of nitrosative stress in the pathology of stroke has long been a formidable challenge due to both the presence of the blood-brain barrier (BBB) and the elusive nature of reactive nitrogen species, while this task is also informative to gain a molecular level understanding of neurovascular injury caused by nitrosative stress during the stroke episode. Herein, using a physicochemical property-guided probe design strategy in combination with the reaction-based probe design rationale, we have developed an ultrasensitive probe for imaging nitrosative stress evolved in the pathology of stroke. This probe demonstrates an almost zero background fluorescence signal but a maximum 1000-fold fluorescence enhancement in response to peroxynitrite, the nitrosative stress marker. Due to its good physicochemical properties, the probe readily penetrates the BBB after intravenous administration, and quickly accumulates in mice brain to sense local vascular injuries. After accomplishing its imaging mission, the probe is easily metabolized and therefore won't cause safety concerns. These desirable features make the probe competent for the straightforward visualization of nitrosative stress progression in stroke pathology.
This journal is © The Royal Society of Chemistry.
Conflict of interest statement
There are no conflicts to declare.
Figures
Similar articles
-
Targeting nitrosative stress for neurovascular protection: new implications in brain diseases.Curr Drug Targets. 2012 Feb;13(2):272-84. doi: 10.2174/138945012799201649. Curr Drug Targets. 2012. PMID: 22023405 Review.
-
Melatonin decreases neurovascular oxidative/nitrosative damage and protects against early increases in the blood-brain barrier permeability after transient focal cerebral ischemia in mice.J Pineal Res. 2006 Sep;41(2):175-82. doi: 10.1111/j.1600-079X.2006.00351.x. J Pineal Res. 2006. PMID: 16879324
-
Reactive nitrogen species induced catalases promote a novel nitrosative stress tolerance mechanism in Vibrio cholerae.Nitric Oxide. 2019 Jul 1;88:35-44. doi: 10.1016/j.niox.2019.04.002. Epub 2019 Apr 11. Nitric Oxide. 2019. PMID: 30981896
-
Nitroxide antioxidant as a potential strategy to attenuate the oxidative/nitrosative stress induced by hydrogen peroxide plus nitric oxide in cultured neurons.Nitric Oxide. 2016 Apr 1;54:38-50. doi: 10.1016/j.niox.2016.02.001. Epub 2016 Feb 16. Nitric Oxide. 2016. PMID: 26891889
-
[Aiming for zero blindness].Nippon Ganka Gakkai Zasshi. 2015 Mar;119(3):168-93; discussion 194. Nippon Ganka Gakkai Zasshi. 2015. PMID: 25854109 Review. Japanese.
Cited by
-
Fluorescent Probes for Disease Diagnosis.Chem Rev. 2024 Jun 12;124(11):7106-7164. doi: 10.1021/acs.chemrev.3c00776. Epub 2024 May 17. Chem Rev. 2024. PMID: 38760012 Free PMC article. Review.
-
Use of Deep-Learning Assisted Assessment of Cardiac Parameters in Zebrafish to Discover Cyanidin Chloride as a Novel Keap1 Inhibitor Against Doxorubicin-Induced Cardiotoxicity.Adv Sci (Weinh). 2023 Oct;10(30):e2301136. doi: 10.1002/advs.202301136. Epub 2023 Sep 7. Adv Sci (Weinh). 2023. PMID: 37679058 Free PMC article.
-
Screening Anti-Parkinson's Disease Drugs in Living Mouse Brains via a Peroxynitrite-Activated Fluorescent Probe.Chem Biomed Imaging. 2024 Dec 20;3(5):301-309. doi: 10.1021/cbmi.4c00076. eCollection 2025 May 26. Chem Biomed Imaging. 2024. PMID: 40443559 Free PMC article.
-
Near-Infrared Afterglow ONOO--Triggered Nanoparticles for Real-Time Monitoring and Treatment of Early Ischemic Stroke.ACS Appl Mater Interfaces. 2023 Oct 4;15(39):45574-45584. doi: 10.1021/acsami.3c08033. Epub 2023 Sep 20. ACS Appl Mater Interfaces. 2023. PMID: 37729542 Free PMC article.
References
LinkOut - more resources
Full Text Sources