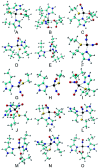
Stepwise nitrosylation of the nonheme iron site in an engineered azurin and a molecular basis for nitric oxide signaling mediated by nonheme iron proteins
- PMID: 34040732
- PMCID: PMC8132939
- DOI: 10.1039/d1sc00364j
Stepwise nitrosylation of the nonheme iron site in an engineered azurin and a molecular basis for nitric oxide signaling mediated by nonheme iron proteins
Abstract
Mononitrosyl and dinitrosyl iron species, such as {FeNO}7, {FeNO}8 and {Fe(NO)2}9, have been proposed to play pivotal roles in the nitrosylation processes of nonheme iron centers in biological systems. Despite their importance, it has been difficult to capture and characterize them in the same scaffold of either native enzymes or their synthetic analogs due to the distinct structural requirements of the three species, using redox reagents compatible with biomolecules under physiological conditions. Here, we report the realization of stepwise nitrosylation of a mononuclear nonheme iron site in an engineered azurin under such conditions. Through tuning the number of nitric oxide equivalents and reaction time, controlled formation of {FeNO}7 and {Fe(NO)2}9 species was achieved, and the elusive {FeNO}8 species was inferred by EPR spectroscopy and observed by Mössbauer spectroscopy, with complemental evidence for the conversion of {FeNO}7 to {Fe(NO)2}9 species by UV-Vis, resonance Raman and FT-IR spectroscopies. The entire pathway of the nitrosylation process, Fe(ii) → {FeNO}7 → {FeNO}8 → {Fe(NO)2}9, has been elucidated within the same protein scaffold based on spectroscopic characterization and DFT calculations. These results not only enhance the understanding of the dinitrosyl iron complex formation process, but also shed light on the physiological roles of nitric oxide signaling mediated by nonheme iron proteins.
This journal is © The Royal Society of Chemistry.
Conflict of interest statement
The authors declare no competing financial interest.
Figures


Similar articles
-
Spectroscopic characterization of mononitrosyl complexes in heme--nonheme diiron centers within the myoglobin scaffold (Fe(B)Mbs): relevance to denitrifying NO reductase.Biochemistry. 2011 Jul 5;50(26):5939-47. doi: 10.1021/bi200409a. Epub 2011 Jun 14. Biochemistry. 2011. PMID: 21634416 Free PMC article.
-
The nitric oxide reductase mechanism of a flavo-diiron protein: identification of active-site intermediates and products.J Am Chem Soc. 2014 Jun 4;136(22):7981-92. doi: 10.1021/ja5022443. Epub 2014 May 23. J Am Chem Soc. 2014. PMID: 24828196 Free PMC article.
-
The production of nitrous oxide by the heme/nonheme diiron center of engineered myoglobins (Fe(B)Mbs) proceeds through a trans-iron-nitrosyl dimer.J Am Chem Soc. 2014 Feb 12;136(6):2420-31. doi: 10.1021/ja410542z. Epub 2014 Feb 3. J Am Chem Soc. 2014. PMID: 24432820 Free PMC article.
-
A Nonheme Mononuclear {FeNO}7 Complex that Produces N2 O in the Absence of an Exogenous Reductant.Angew Chem Int Ed Engl. 2021 Sep 20;60(39):21558-21564. doi: 10.1002/anie.202109062. Epub 2021 Aug 20. Angew Chem Int Ed Engl. 2021. PMID: 34415659 Free PMC article.
-
A mononuclear nonheme {FeNO}6 complex: synthesis and structural and spectroscopic characterization.Chem Sci. 2018 Jul 20;9(34):6952-6960. doi: 10.1039/c8sc01962b. eCollection 2018 Sep 14. Chem Sci. 2018. PMID: 30210769 Free PMC article.
Cited by
-
Designing Artificial Metalloenzymes by Tuning of the Environment beyond the Primary Coordination Sphere.Chem Rev. 2022 Jul 27;122(14):11974-12045. doi: 10.1021/acs.chemrev.2c00106. Epub 2022 Jul 11. Chem Rev. 2022. PMID: 35816578 Free PMC article. Review.
-
Gas tunnel engineering of prolyl hydroxylase reprograms hypoxia signaling in cells.bioRxiv [Preprint]. 2024 May 15:2023.08.07.552357. doi: 10.1101/2023.08.07.552357. bioRxiv. 2024. Update in: Angew Chem Int Ed Engl. 2024 Nov 25;63(48):e202409234. doi: 10.1002/anie.202409234. PMID: 37609209 Free PMC article. Updated. Preprint.
-
Gas Tunnel Engineering of Prolyl Hydroxylase Reprograms Hypoxia Signaling in Cells.Angew Chem Int Ed Engl. 2024 Nov 25;63(48):e202409234. doi: 10.1002/anie.202409234. Epub 2024 Oct 21. Angew Chem Int Ed Engl. 2024. PMID: 39168829
References
-
- Ignarro L. J. and Freeman B. A., Nitric Oxide: Biology and Pathobiology, Elsevier Academic Press, 3rd edn, 2017
-
- Butler A. R. Megson I. L. Chem. Rev. 2002;102:1155–1166. - PubMed
-
- Wasser I. M. de Vries S. Moënne-Loccoz P. Schröder I. Karlin K. D. Chem. Rev. 2002;102:1201–1234. - PubMed
-
- Wardrop S. L. Watts R. N. Richardson D. R. Biochemistry. 2000;39:2748–2758. - PubMed
Grants and funding
LinkOut - more resources
Full Text Sources
Other Literature Sources

