

Experimental virus evolution in cancer cell monolayers, spheroids, and tissue explants
- PMID: 34040797
- PMCID: PMC8134955
- DOI: 10.1093/ve/veab045
Experimental virus evolution in cancer cell monolayers, spheroids, and tissue explants
Abstract
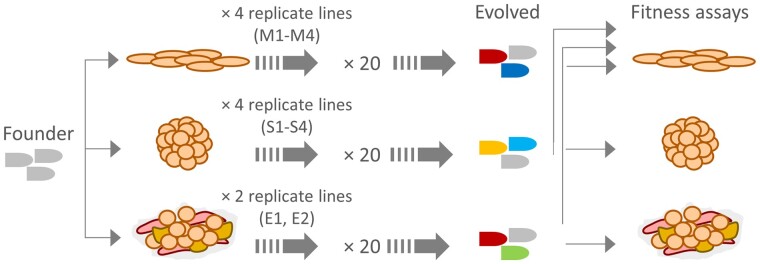
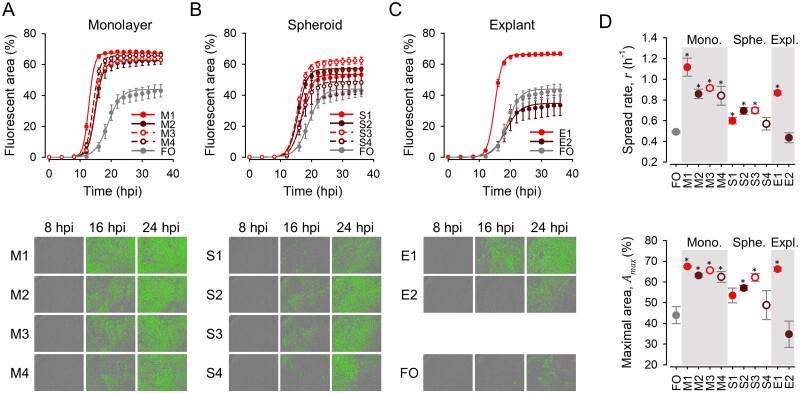
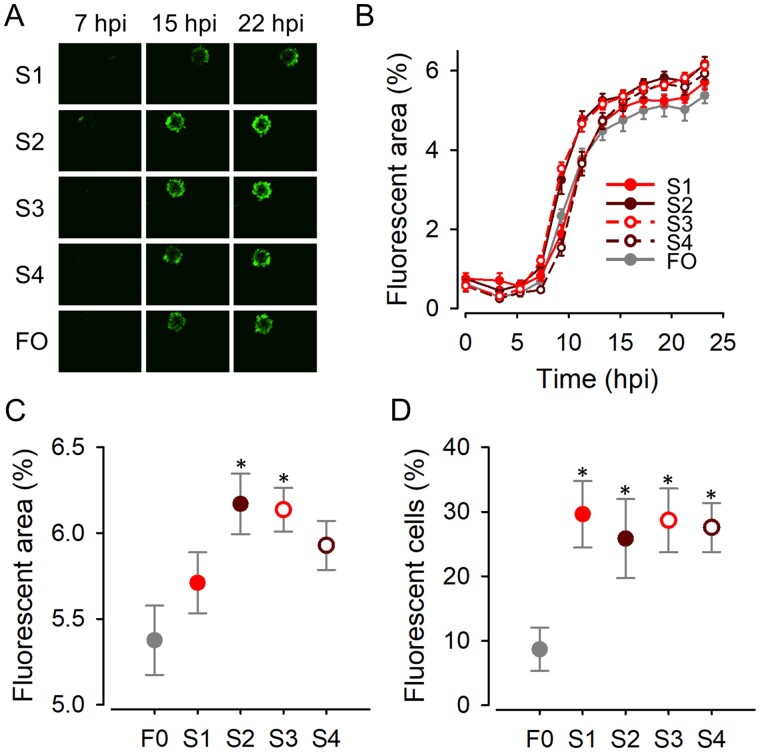
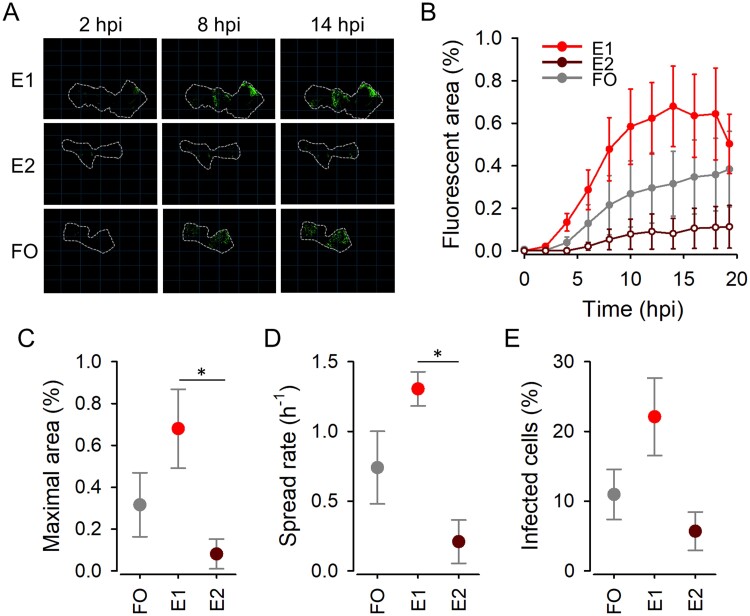
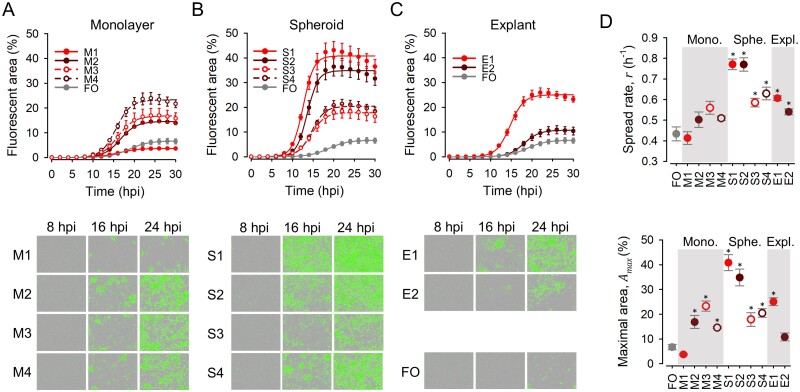
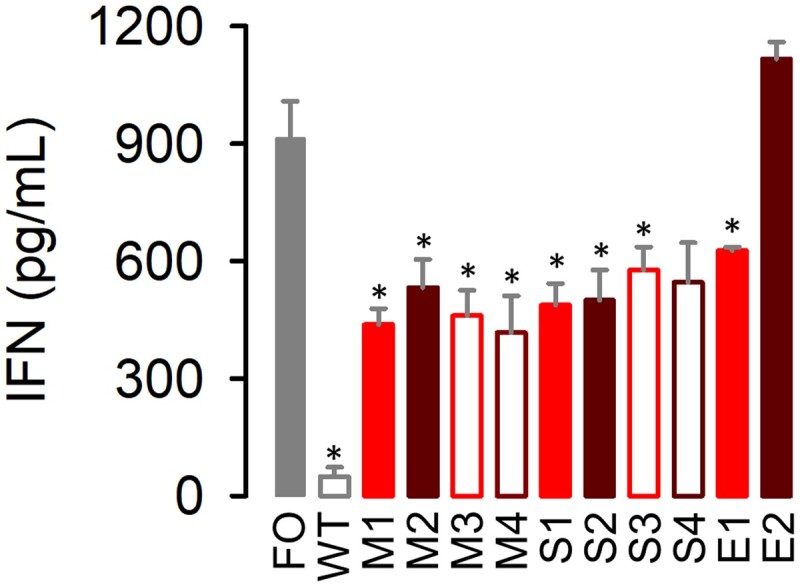
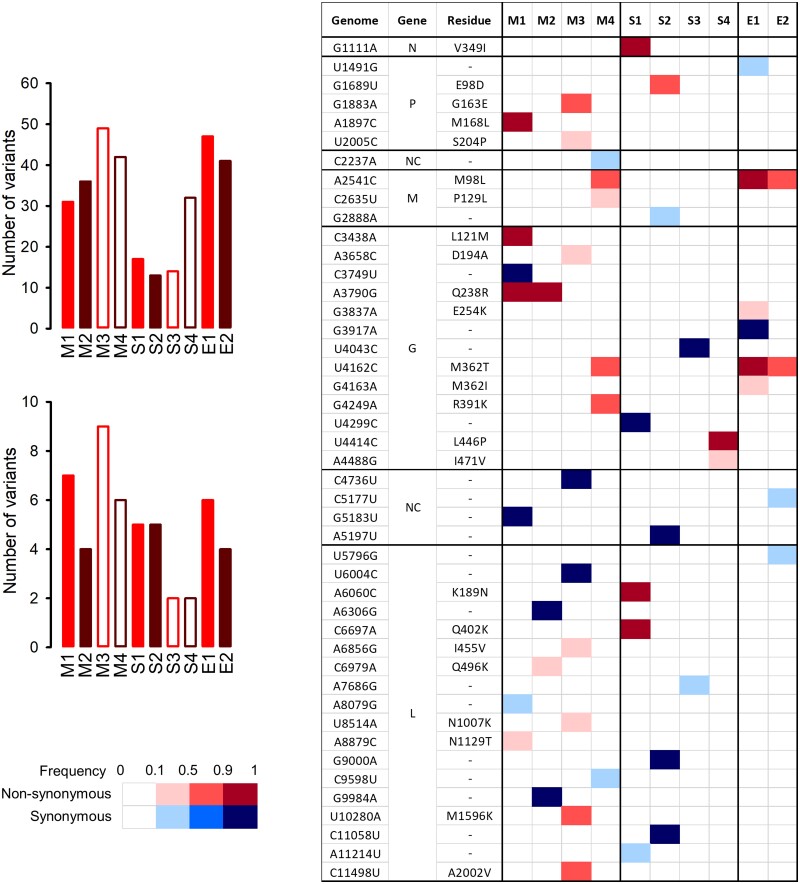
Viral laboratory evolution has been used for different applications, such as modeling viral emergence, drug-resistance prediction, and therapeutic virus optimization. However, these studies have been mainly performed in cell monolayers, a highly simplified environment, raising concerns about their applicability and relevance. To address this, we compared the evolution of a model virus in monolayers, spheroids, and tissue explants. We performed this analysis in the context of cancer virotherapy by performing serial transfers of an oncolytic vesicular stomatitis virus (VSV-Δ51) in 4T1 mouse mammary tumor cells. We found that VSV-Δ51 gained fitness in each of these three culture systems, and that adaptation to the more complex environments (spheroids or explants) correlated with increased fitness in monolayers. Most evolved lines improved their ability to suppress β-interferon secretion compared to the VSV-Δ51 founder, suggesting that the selective pressure exerted by antiviral innate immunity was important in the three systems. However, system-specific patterns were also found. First, viruses evolved in monolayers remained more oncoselective that those evolved in spheroids, since the latter showed concomitant adaptation to non-tumoral mouse cells. Second, deep sequencing indicated that viral populations evolved in monolayers or explants tended to be more genetically diverse than those evolved in spheroids. Finally, we found highly variable outcomes among independent evolutionary lines propagated in explants. We conclude that experimental evolution in monolayers tends to be more reproducible than in spheroids or explants, and better preserves oncoselectivity. Our results also suggest that monolayers capture at least some relevant selective pressures present in more complex systems.
Keywords: experimental evolution; oncolytic virus; vesicular stomatitis virus.
© The Author(s) 2021. Published by Oxford University Press.
Figures
Similar articles
-
Experimental Evolution Generates Novel Oncolytic Vesicular Stomatitis Viruses with Improved Replication in Virus-Resistant Pancreatic Cancer Cells.J Virol. 2020 Jan 17;94(3):e01643-19. doi: 10.1128/JVI.01643-19. Print 2020 Jan 17. J Virol. 2020. PMID: 31694943 Free PMC article.
-
Reovirus FAST Protein Enhances Vesicular Stomatitis Virus Oncolytic Virotherapy in Primary and Metastatic Tumor Models.Mol Ther Oncolytics. 2017 Aug 4;6:80-89. doi: 10.1016/j.omto.2017.08.001. eCollection 2017 Sep 15. Mol Ther Oncolytics. 2017. PMID: 28856238 Free PMC article.
-
Radioiodide imaging and radiovirotherapy of multiple myeloma using VSV(Delta51)-NIS, an attenuated vesicular stomatitis virus encoding the sodium iodide symporter gene.Blood. 2007 Oct 1;110(7):2342-50. doi: 10.1182/blood-2007-01-065573. Epub 2007 May 21. Blood. 2007. PMID: 17515401 Free PMC article.
-
VSV-tumor selective replication and protein translation.Oncogene. 2005 Nov 21;24(52):7710-9. doi: 10.1038/sj.onc.1209042. Oncogene. 2005. PMID: 16299531 Review.
-
Oncotargeting by Vesicular Stomatitis Virus (VSV): Advances in Cancer Therapy.Viruses. 2018 Feb 23;10(2):90. doi: 10.3390/v10020090. Viruses. 2018. PMID: 29473868 Free PMC article. Review.
Cited by
-
Inactivated Rothia nasimurium promotes a persistent antiviral immune status in porcine alveolar macrophages.Front Immunol. 2025 Jun 3;16:1584092. doi: 10.3389/fimmu.2025.1584092. eCollection 2025. Front Immunol. 2025. PMID: 40529370 Free PMC article.
-
Murine colon cancer derived cells exhibit heterogeneous resistance profiles against an oncolytic virus.Sci Rep. 2024 Nov 8;14(1):27209. doi: 10.1038/s41598-024-78313-6. Sci Rep. 2024. PMID: 39516525 Free PMC article.
-
Optimized Directed Virus Evolution to Accelerate the Generation of Oncolytic Coxsackievirus B3 Adapted to Resistant Colorectal Cancer Cells.Viruses. 2024 Dec 20;16(12):1958. doi: 10.3390/v16121958. Viruses. 2024. PMID: 39772264 Free PMC article.
References
-
- Beier R., Hermiston T., Mumberg D. (2013) ‘Isolation of More Potent Oncolytic Paramyxovirus by Bioselection’, Gene Therapy, 20: 102–11. - PubMed
LinkOut - more resources
Full Text Sources
Other Literature Sources
