

Differential DNA methylation in somatic and sperm cells of hatchery vs wild (natural-origin) steelhead trout populations
- PMID: 34040807
- PMCID: PMC8132314
- DOI: 10.1093/eep/dvab002
Differential DNA methylation in somatic and sperm cells of hatchery vs wild (natural-origin) steelhead trout populations
Abstract
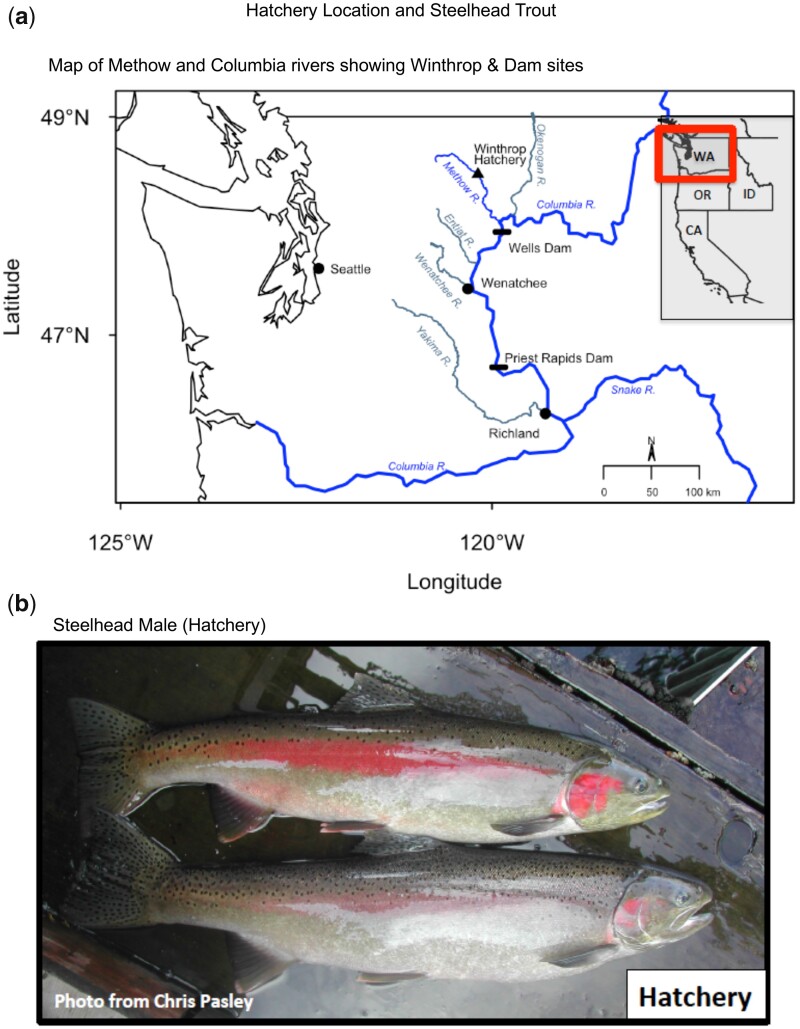
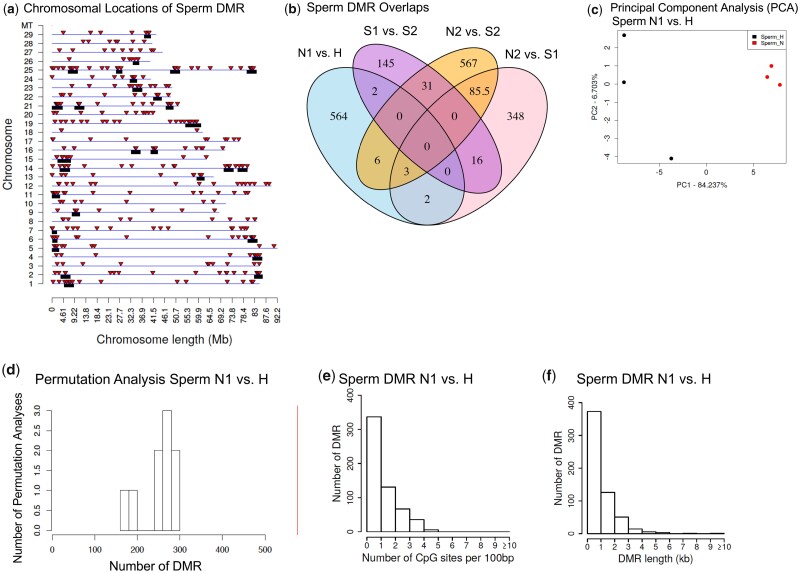
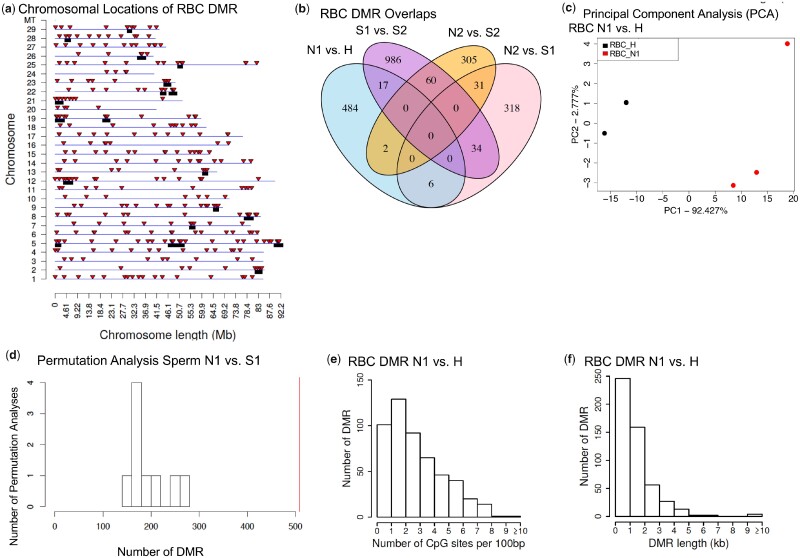
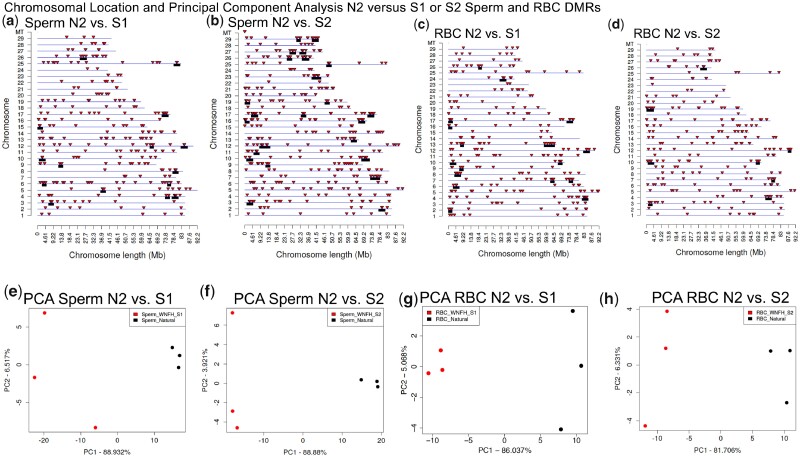
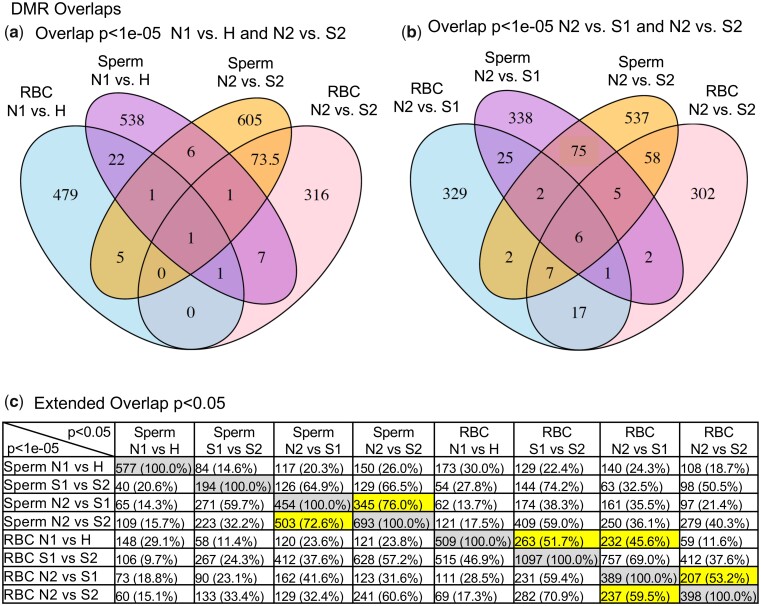
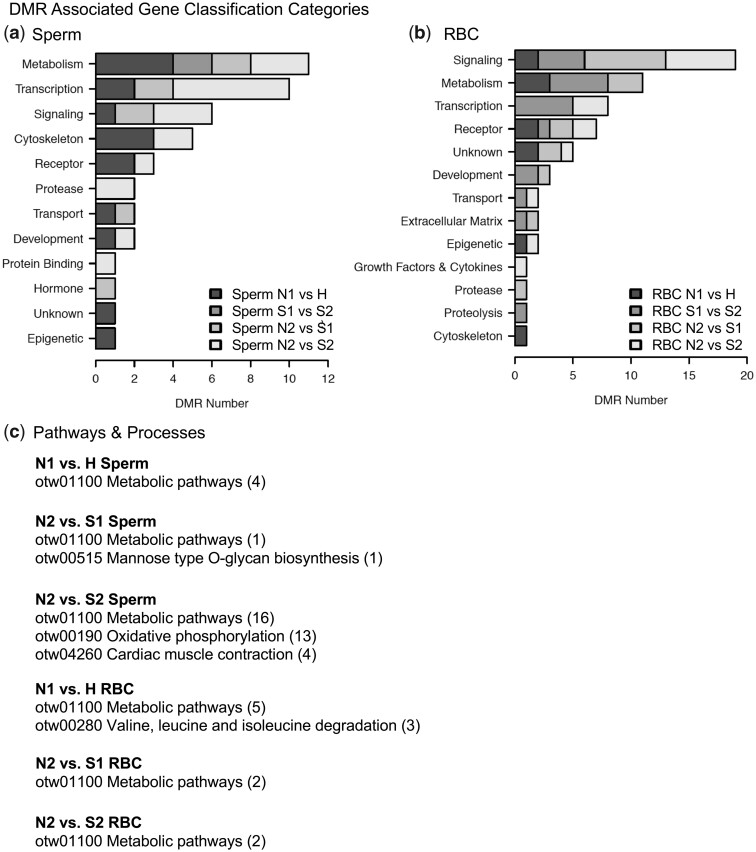
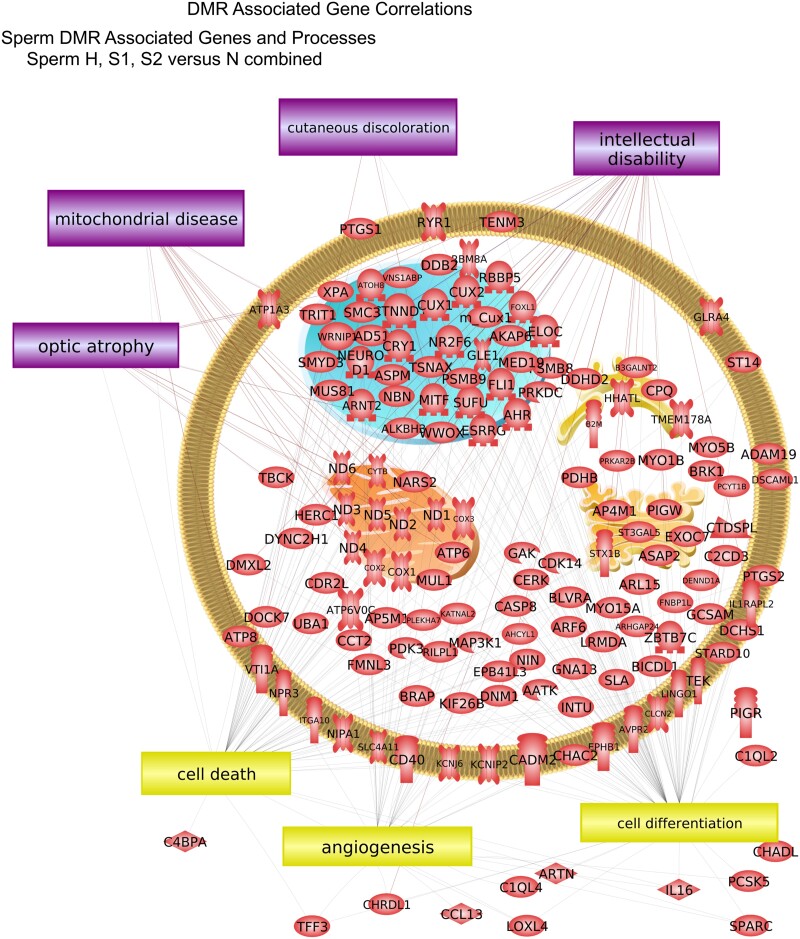
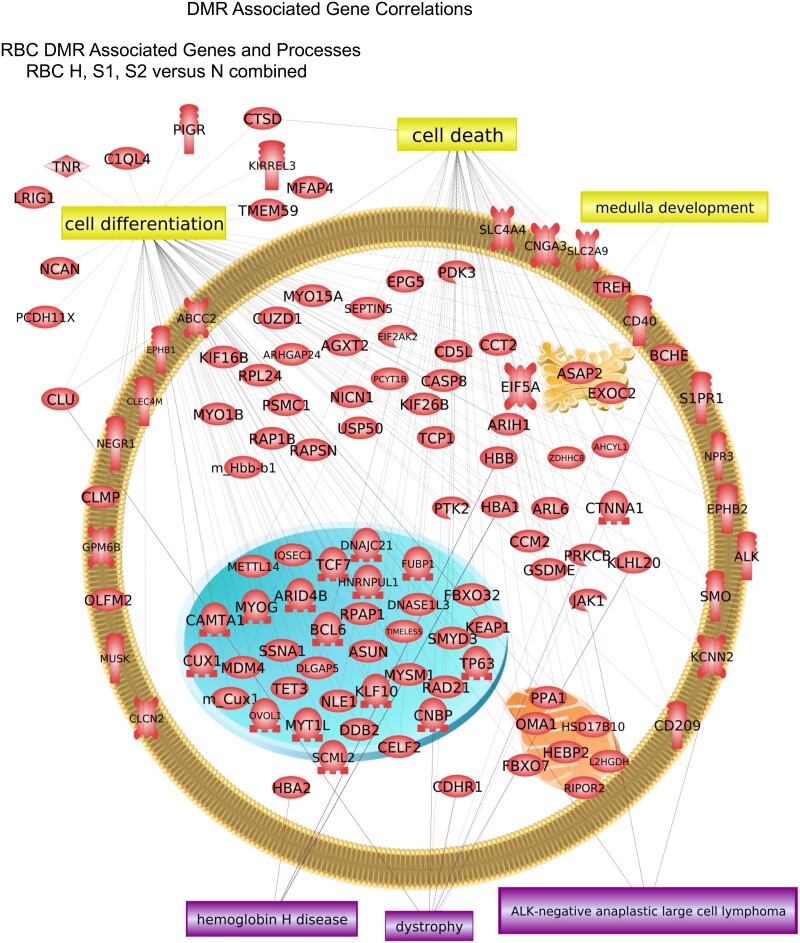
Environmental factors such as nutrition, stress, and toxicants can influence epigenetic programming and phenotypes of a wide variety of species from plants to humans. The current study was designed to investigate the impacts of hatchery spawning and rearing on steelhead trout (Oncorhynchus mykiss) vs the wild fish on a molecular level. Additionally, epigenetic differences between feeding practices that allow slow growth (2 years) and fast growth (1 year) hatchery trout were investigated. The sperm and red blood cells (RBC) from adult male slow growth/maturation hatchery steelhead, fast growth/maturation hatchery steelhead, and wild (natural-origin) steelhead were collected for DNA preparation to investigate potential alterations in differential DNA methylation regions (DMRs) and genetic mutations, involving copy number variations (CNVs). The sperm and RBC DNA both had a large number of DMRs when comparing the hatchery vs wild steelhead trout populations. The DMRs were cell type specific with negligible overlap. Slow growth/maturation compared to fast growth/maturation steelhead also had a larger number of DMRs in the RBC samples. A number of the DMRs had associated genes that were correlated to various biological processes and pathologies. Observations demonstrate a major epigenetic programming difference between the hatchery and wild natural-origin fish populations, but negligible genetic differences. Therefore, hatchery conditions and growth/maturation rate can alter the epigenetic developmental programming of the steelhead trout. Interestingly, epigenetic alterations in the sperm allow for potential epigenetic transgenerational inheritance of phenotypic variation to future generations. The impacts of hatchery exposures are not only important to consider on the fish exposed, but also on future generations and evolutionary trajectory of fish in the river populations.
Keywords: epigenetic inheritance; fish; generational; genomics; hatchery; phenotypic variation; rearing conditions; sperm; steelhead.
© The Author(s) 2021. Published by Oxford University Press.
Figures
Similar articles
-
Characterization of Genetic and Epigenetic Variation in Sperm and Red Blood Cells from Adult Hatchery and Natural-Origin Steelhead, Oncorhynchus mykiss.G3 (Bethesda). 2018 Nov 6;8(11):3723-3736. doi: 10.1534/g3.118.200458. G3 (Bethesda). 2018. PMID: 30275172 Free PMC article.
-
Temporal Dynamics of DNA Methylation Patterns in Response to Rearing Juvenile Steelhead (Oncorhynchus mykiss) in a Hatchery versus Simulated Stream Environment.Genes (Basel). 2019 May 9;10(5):356. doi: 10.3390/genes10050356. Genes (Basel). 2019. PMID: 31075961 Free PMC article.
-
Who are the missing parents? Grandparentage analysis identifies multiple sources of gene flow into a wild population.Mol Ecol. 2011 Mar;20(6):1263-76. doi: 10.1111/j.1365-294X.2010.04994.x. Epub 2011 Jan 19. Mol Ecol. 2011. PMID: 21244538
-
On the reproductive success of early-generation hatchery fish in the wild.Evol Appl. 2014 Sep;7(8):883-96. doi: 10.1111/eva.12183. Epub 2014 Jul 9. Evol Appl. 2014. PMID: 25469167 Free PMC article. Review.
-
Transgenerational inheritance: how impacts to the epigenetic and genetic information of parents affect offspring health.Hum Reprod Update. 2019 Sep 11;25(5):518-540. doi: 10.1093/humupd/dmz017. Hum Reprod Update. 2019. PMID: 31374565
Cited by
-
Genome-wide CpG density and DNA methylation analysis method (MeDIP, RRBS, and WGBS) comparisons.Epigenetics. 2022 May;17(5):518-530. doi: 10.1080/15592294.2021.1924970. Epub 2021 May 11. Epigenetics. 2022. PMID: 33975521 Free PMC article.
-
Genomic Signatures of Domestication in European Seabass (Dicentrarchus labrax L.) Reveal a Potential Role for Epigenetic Regulation in Adaptation to Captivity.Ecol Evol. 2024 Dec 3;14(12):e70512. doi: 10.1002/ece3.70512. eCollection 2024 Dec. Ecol Evol. 2024. PMID: 39629177 Free PMC article.
-
Generational stability of epigenetic transgenerational inheritance facilitates adaptation and evolution.Epigenetics. 2024 Dec;19(1):2380929. doi: 10.1080/15592294.2024.2380929. Epub 2024 Aug 5. Epigenetics. 2024. PMID: 39104183 Free PMC article. Review.
-
Environment-driven reprogramming of gamete DNA methylation occurs during maturation and is transmitted intergenerationally in Atlantic Salmon.G3 (Bethesda). 2021 Dec 8;11(12):jkab353. doi: 10.1093/g3journal/jkab353. G3 (Bethesda). 2021. PMID: 34849830 Free PMC article.
-
An epigenetic toolbox for conservation biologists.Evol Appl. 2024 Jun 3;17(6):e13699. doi: 10.1111/eva.13699. eCollection 2024 Jun. Evol Appl. 2024. PMID: 38832081 Free PMC article.
References
Grants and funding
LinkOut - more resources
Full Text Sources
Other Literature Sources
Molecular Biology Databases
