

Nonlinear X-wave ultrasound imaging of acoustic biomolecules
- PMID: 34040818
- PMCID: PMC8147876
- DOI: 10.1103/physrevx.8.041002
Nonlinear X-wave ultrasound imaging of acoustic biomolecules
Abstract
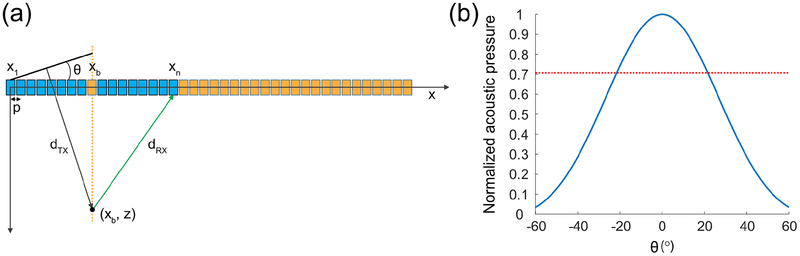
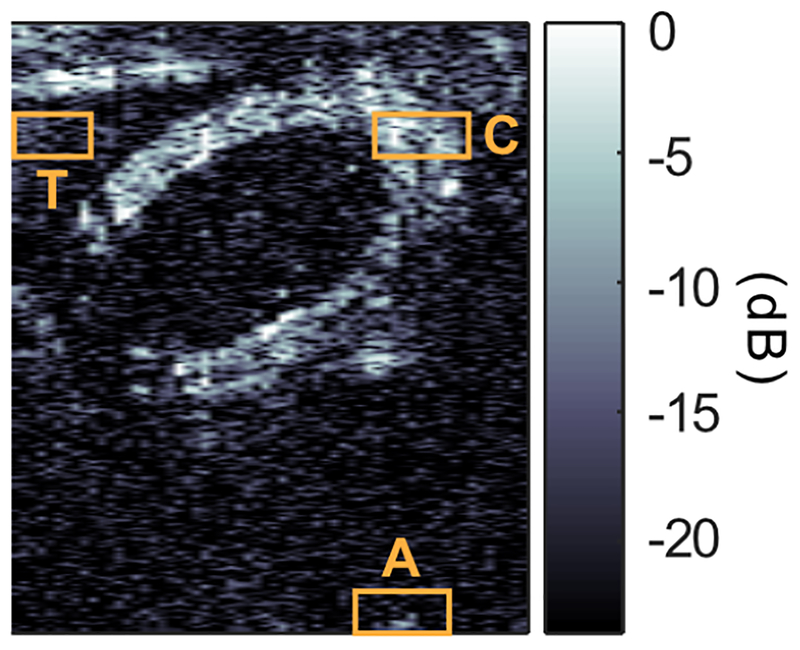
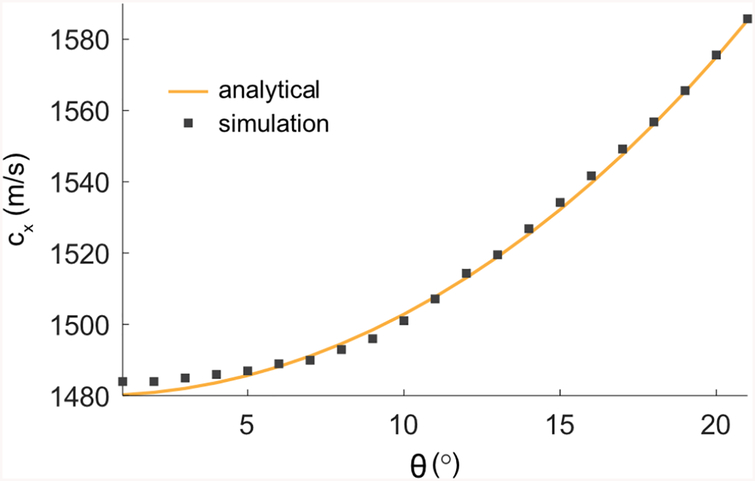
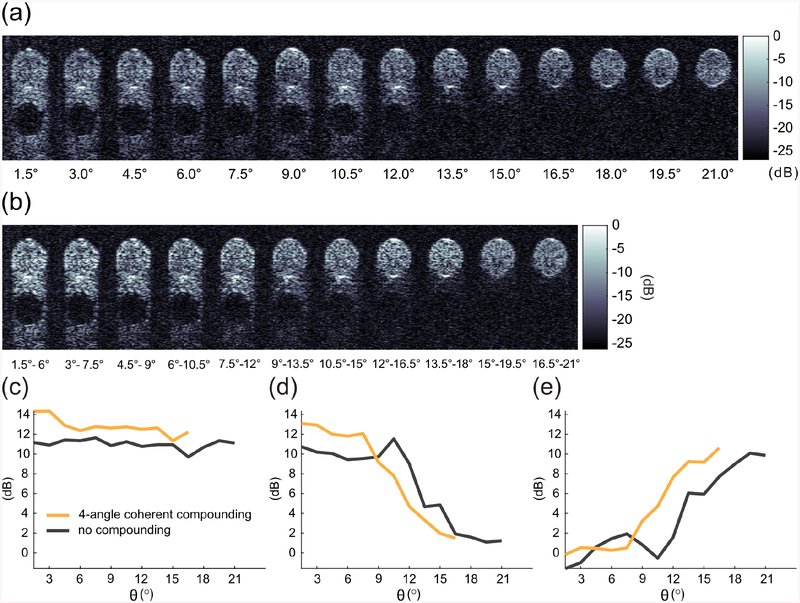
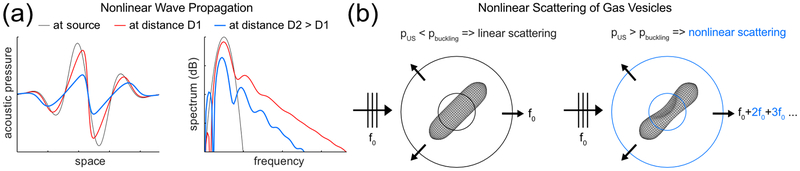
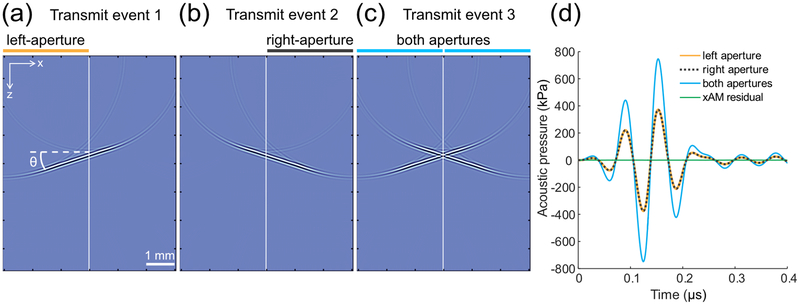
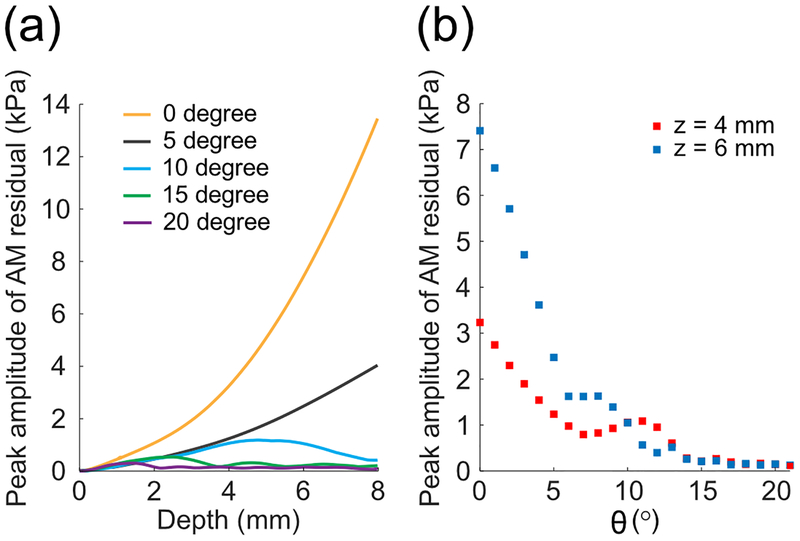
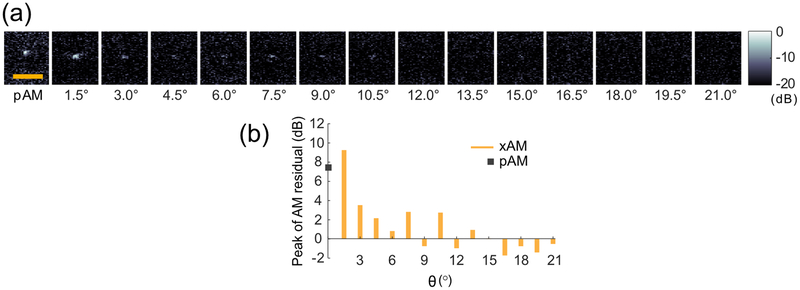
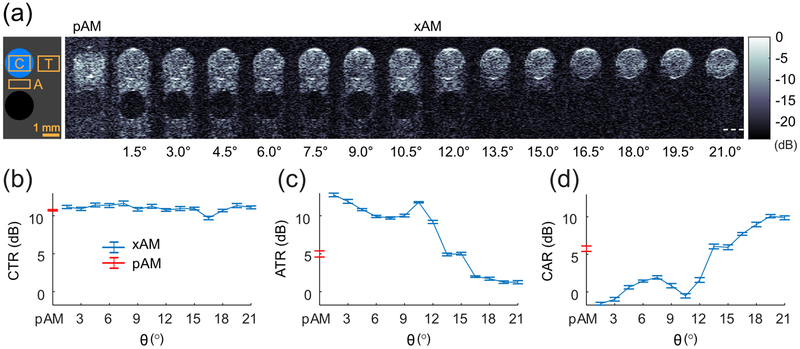
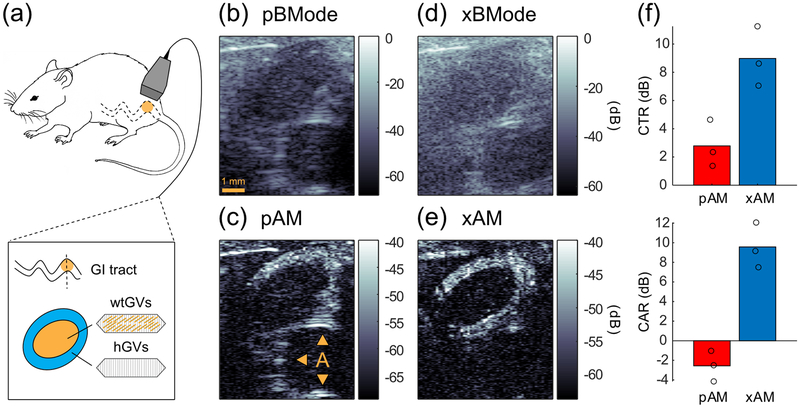
The basic physics of sound waves enables ultrasound to visualize biological tissues with high spatial and temporal resolution. Recently, this capability was enhanced with the development of acoustic biomolecules - proteins with physical properties enabling them to scatter sound. The expression of these unique air-filled proteins, known as gas vesicles (GVs), in cells allows ultrasound to image cellular functions such as gene expression in vivo, providing ultrasound with its analog of optical fluorescent proteins. Acoustical methods for the in vivo detection of GVs are now required to maximize the impact of this technology in biology and medicine. We previously engineered GVs exhibiting a nonlinear scattering behavior in response to acoustic pressures above 300 kPa, and showed that amplitude-modulated (AM) ultrasound pulse sequences that both excite the linear and nonlinear GV scattering regimes were highly effective at distinguishing GVs from linear scatterers like soft biological tissues. Unfortunately, the in vivo specificity of AM ultrasound imaging is systematically compromised by the nonlinearity added by the GVs to propagating waves, resulting in strong image artifacts from linear scatterers downstream of GV inclusions. To address this issue, we present an imaging paradigm, cross-amplitude modulation (xAM), which relies on cross-propagating plane-wave transmissions of finite aperture X-waves to achieve quasi artifact-free in vivo imaging of GVs. The xAM method derives from counter-propagating wave interaction theory which predicts that, in media exhibiting quadratic elastic nonlinearity like biological tissue, the nonlinear interaction of counter-propagating acoustic waves is inefficient. By transmitting cross-propagating plane-waves, we minimize cumulative nonlinear interaction effects due to collinear wave propagation, while generating a transient wave-amplitude modulation at the two plane-waves' intersection. We show in both simulations and experiments that residual xAM nonlinearity due to wave propagation decreases as the plane-wave cross-propagation angle increases. We demonstrate in tissue-mimicking phantoms that imaging artifacts distal to GV inclusions decrease as the plane-wave cross-propagation angle opens, nearing complete extinction at angles above 16.5 degrees. Finally, we demonstrate that xAM enables highly specific in vivo imaging of GVs located in the gastrointestinal tract, a target of prime interest for future cellular imaging. These results advance the physical facet of the emerging field of biomolecular ultrasound, and are also relevant to synthetic ultrasound contrast agents.
Keywords: Acoustics; Biological Physics; Nonlinear Dynamics.
Figures
Similar articles
-
Harmonic imaging for nonlinear detection of acoustic biomolecules.bioRxiv [Preprint]. 2024 Jun 22:2024.06.18.599141. doi: 10.1101/2024.06.18.599141. bioRxiv. 2024. Update in: APL Bioeng. 2024 Nov 12;8(4):046110. doi: 10.1063/5.0214306. PMID: 38948831 Free PMC article. Updated. Preprint.
-
Harmonic imaging for nonlinear detection of acoustic biomolecules.APL Bioeng. 2024 Nov 12;8(4):046110. doi: 10.1063/5.0214306. eCollection 2024 Dec. APL Bioeng. 2024. PMID: 39540107 Free PMC article.
-
Nonlinear ultrasound imaging of nanoscale acoustic biomolecules.Appl Phys Lett. 2017 Feb 13;110(7):073704. doi: 10.1063/1.4976105. Epub 2017 Feb 17. Appl Phys Lett. 2017. PMID: 28289314 Free PMC article.
-
The Advent of Biomolecular Ultrasound Imaging.Neuroscience. 2021 Oct 15;474:122-133. doi: 10.1016/j.neuroscience.2021.03.011. Epub 2021 Mar 13. Neuroscience. 2021. PMID: 33727074 Review.
-
Nonlinear acoustics in diagnostic ultrasound.Ultrasound Med Biol. 2002 Jan;28(1):1-18. doi: 10.1016/s0301-5629(01)00463-x. Ultrasound Med Biol. 2002. PMID: 11879947 Review.
Cited by
-
Molecular Sensing with Host Systems for Hyperpolarized 129Xe.Molecules. 2020 Oct 11;25(20):4627. doi: 10.3390/molecules25204627. Molecules. 2020. PMID: 33050669 Free PMC article. Review.
-
Ultrasound imaging of gene expression in mammalian cells.Science. 2019 Sep 27;365(6460):1469-1475. doi: 10.1126/science.aax4804. Science. 2019. PMID: 31604277 Free PMC article.
-
Transcranial low-intensity ultrasound stimulation for treating central nervous system disorders: A promising therapeutic application.Front Neurol. 2023 Mar 8;14:1117188. doi: 10.3389/fneur.2023.1117188. eCollection 2023. Front Neurol. 2023. PMID: 36970512 Free PMC article. Review.
-
Multiplexed Ultrasound Imaging Using Spectral Analysis on Gas Vesicles.Adv Healthc Mater. 2022 Sep;11(17):e2200568. doi: 10.1002/adhm.202200568. Epub 2022 Jul 12. Adv Healthc Mater. 2022. PMID: 35765741 Free PMC article.
-
3D Ultrasonic Brain Imaging with Deep Learning Based on Fully Convolutional Networks.Sensors (Basel). 2023 Oct 9;23(19):8341. doi: 10.3390/s23198341. Sensors (Basel). 2023. PMID: 37837171 Free PMC article.
References
-
- Tsien RY, The Green Fluorescent Protein, Annual Review of Biochemistry 67, 509(1998). - PubMed
-
- Ntziachristos V, Going deeper than microscopy: the optical imaging frontier in biology, Nature methods 7, 603(2010). - PubMed
-
- Ferrara K, Pollard R, and Borden M, Ultrasound Microbubble Contrast Agents: Fundamentals and Application to Gene and Drug Delivery, Annual Review of Biomedical Engineering 9, 415(2007). - PubMed
Grants and funding
LinkOut - more resources
Full Text Sources
Other Literature Sources