

An Immunometabolic Shift Modulates Cytotoxic Lymphocyte Activation During Melanoma Progression in TRPA1 Channel Null Mice
- PMID: 34041030
- PMCID: PMC8141816
- DOI: 10.3389/fonc.2021.667715
An Immunometabolic Shift Modulates Cytotoxic Lymphocyte Activation During Melanoma Progression in TRPA1 Channel Null Mice
Abstract
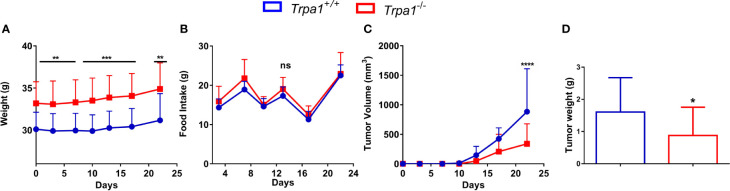
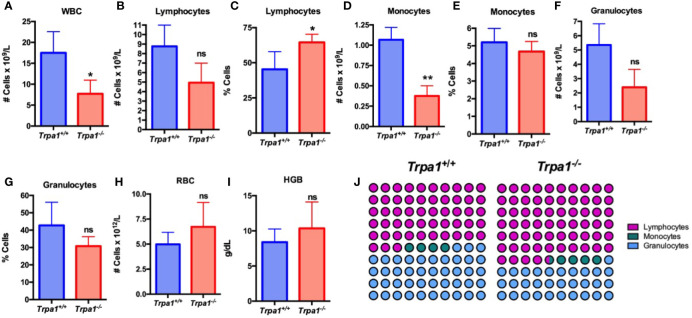
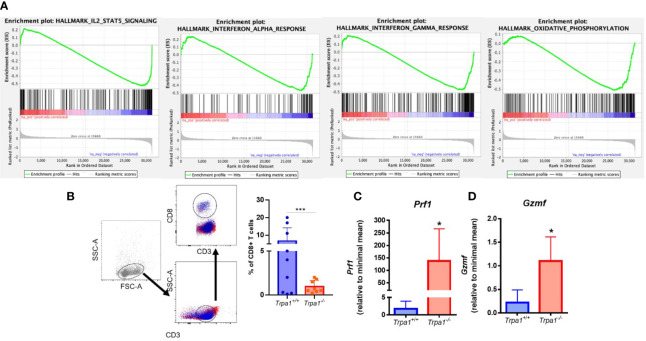
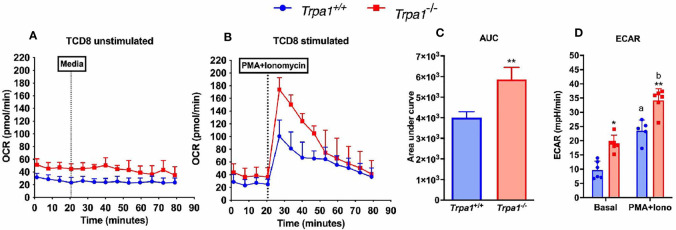
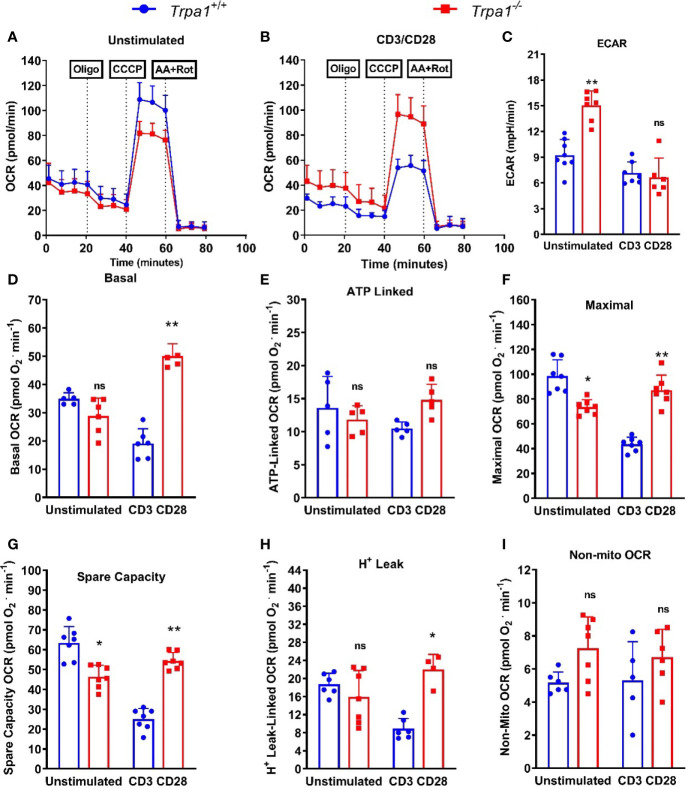
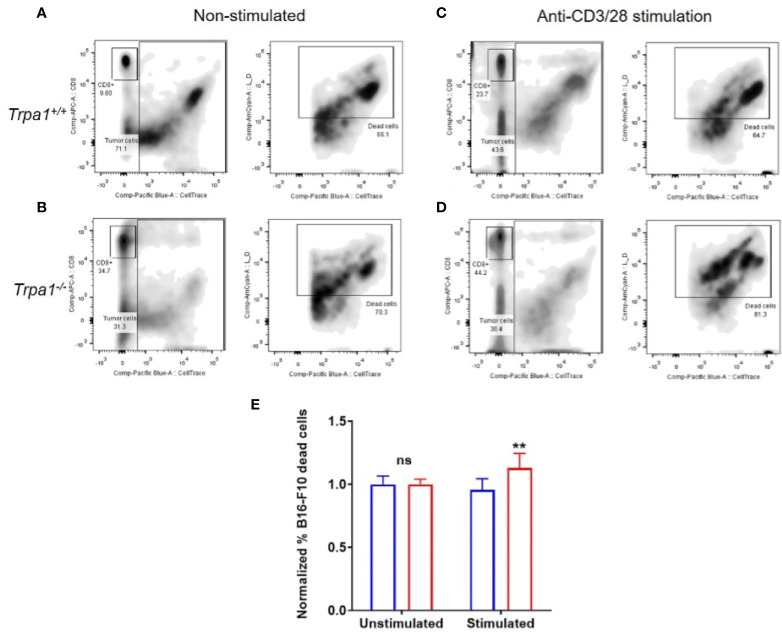
Melanoma skin cancer is extremely aggressive with increasing incidence and mortality. Among the emerging therapeutic targets in the treatment of cancer, the family of transient receptor potential channels (TRPs) has been reported as a possible pharmacological target. Specifically, the ankyrin subfamily, representing TRPA1 channels, can act as a pro-inflammatory hub. These channels have already been implicated in the control of intracellular metabolism in several cell models, but little is known about their role in immune cells, and how it could affect tumor progression in a process known as immune surveillance. Here, we investigated the participation of the TRPA1 channel in the immune response against melanoma tumor progression in a mouse model. Using Trpa1 +/+ and Trpa1 -/- animals, we evaluated tumor progression using murine B16-F10 cells and assessed isolated CD8+ T cells for respiratory and cytotoxic functions. Tumor growth was significantly reduced in Trpa1 -/- animals. We observed an increase in the frequency of circulating lymphocytes. Using a dataset of CD8+ T cells isolated from metastatic melanoma patients, we found that TRPA1 reduction correlates with several immunological pathways. Naïve CD8+ T cells from Trpa1 +/+ and Trpa1 -/- animals showed different mitochondrial respiration and glycolysis profiles. However, under CD3/CD28 costimulatory conditions, the absence of TRPA1 led to an even more extensive metabolic shift, probably linked to a greater in vitro killling ability of Trpa1 -/- CD8+ T cells. Therefore, these data demonstrate an unprecedented role of TRPA1 channel in the metabolism control of the immune system cells during carcinogenesis.
Keywords: CD8+ T cells; TRPA1 channel; immunometabolism; melanoma; metabolic shift.
Copyright © 2021 Forni, Domínguez-Amorocho, de Assis, Kinker, Moraes, Castrucci and Câmara.
Conflict of interest statement
The authors declare that the research was conducted in the absence of any commercial or financial relationships that could be construed as a potential conflict of interest.
Figures
Similar articles
-
Dacarbazine alone or associated with melanoma-bearing cancer pain model induces painful hypersensitivity by TRPA1 activation in mice.Int J Cancer. 2020 May 15;146(10):2797-2809. doi: 10.1002/ijc.32648. Epub 2019 Oct 8. Int J Cancer. 2020. PMID: 31456221
-
Transient receptor potential ankyrin1 channel is endogenously expressed in T cells and is involved in immune functions.Biosci Rep. 2019 Sep 20;39(9):BSR20191437. doi: 10.1042/BSR20191437. Print 2019 Sep 30. Biosci Rep. 2019. PMID: 31488616 Free PMC article.
-
Transient receptor potential ankyrin 1 (TRPA1) plays a critical role in a mouse model of cancer pain.Int J Cancer. 2019 Jan 15;144(2):355-365. doi: 10.1002/ijc.31911. Epub 2018 Oct 30. Int J Cancer. 2019. PMID: 30289972 Free PMC article.
-
Role of transient receptor potential ankyrin 1 channels in Alzheimer's disease.J Neuroinflammation. 2016 Apr 27;13(1):92. doi: 10.1186/s12974-016-0557-z. J Neuroinflammation. 2016. PMID: 27121378 Free PMC article.
-
Transient Receptor Potential Ankyrin Type-1 Channels as a Potential Target for the Treatment of Cardiovascular Diseases.Front Physiol. 2020 Jul 30;11:836. doi: 10.3389/fphys.2020.00836. eCollection 2020. Front Physiol. 2020. PMID: 32903613 Free PMC article. Review.
Cited by
-
Melanopsin (Opn4) is an oncogene in cutaneous melanoma.Commun Biol. 2022 May 13;5(1):461. doi: 10.1038/s42003-022-03425-6. Commun Biol. 2022. PMID: 35562405 Free PMC article.
-
Role of TRP Channels in Cancer-Induced Bone Pain.Int J Mol Sci. 2025 Jan 30;26(3):1229. doi: 10.3390/ijms26031229. Int J Mol Sci. 2025. PMID: 39940997 Free PMC article. Review.
-
Inflammation-the role of TRPA1 channel.Front Physiol. 2023 Feb 16;14:1093925. doi: 10.3389/fphys.2023.1093925. eCollection 2023. Front Physiol. 2023. PMID: 36875034 Free PMC article. Review.
-
Presence of TRPA1 Modifies CD4+/CD8+ T Lymphocyte Ratio and Activation.Pharmaceuticals (Basel). 2022 Jan 1;15(1):57. doi: 10.3390/ph15010057. Pharmaceuticals (Basel). 2022. PMID: 35056114 Free PMC article.
-
Mechanosensitive Ion Channels: Their Physiological Importance and Potential Key Role in Cancer.Int J Mol Sci. 2023 Sep 5;24(18):13710. doi: 10.3390/ijms241813710. Int J Mol Sci. 2023. PMID: 37762011 Free PMC article. Review.
References
-
- Matthews NH, Li WQ, Qureshi AA, Weinstock MA, Cho E. Epidemiology of Melanoma. In: Ward WH, Farma JM, editors. Cutaneous Melanoma: Etiology and Therapy. Brisbane (AU: Codon Publications The Authors; (2017). - PubMed
LinkOut - more resources
Full Text Sources
Other Literature Sources
Research Materials
Miscellaneous