. 2021 May 10:9:641987.
doi: 10.3389/fcell.2021.641987. eCollection 2021.

Timing Does Matter: Nerve-Mediated HDAC1 Paces the Temporal Expression of Morphogenic Genes During Axolotl Limb Regeneration

Affiliations

Timing Does Matter: Nerve-Mediated HDAC1 Paces the Temporal Expression of Morphogenic Genes During Axolotl Limb Regeneration

Mu-Hui Wang et al. Front Cell Dev Biol. .

Abstract

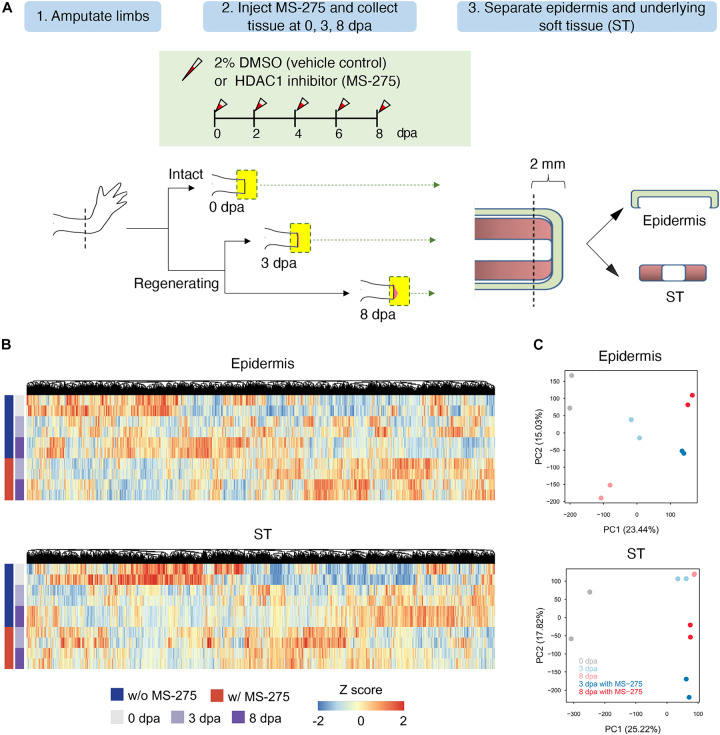
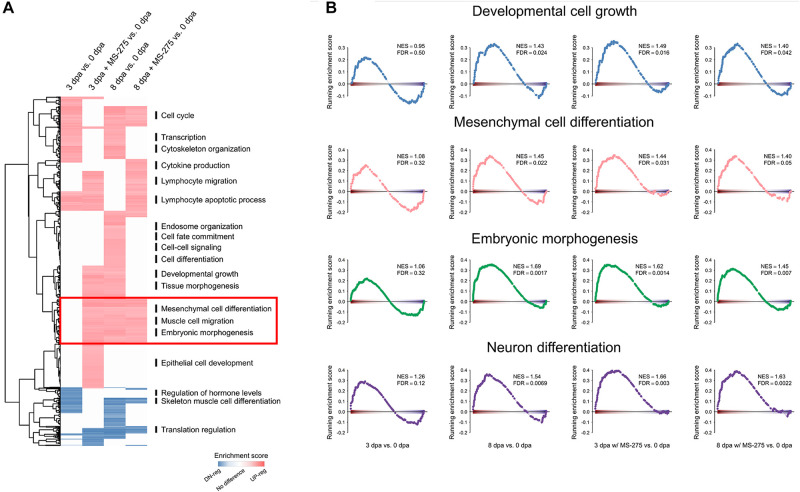
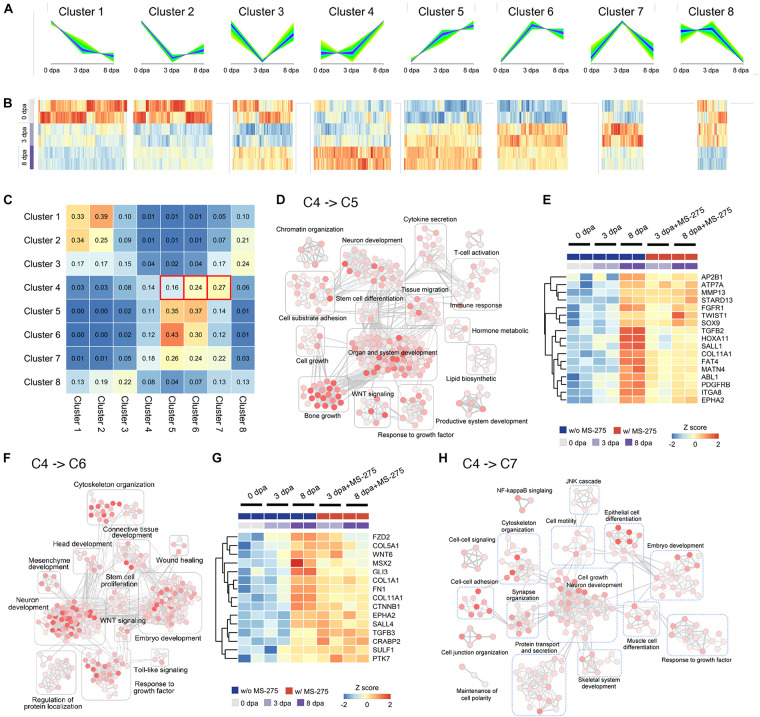
Sophisticated axolotl limb regeneration is a highly orchestrated process that requires highly regulated gene expression and epigenetic modification patterns at precise positions and timings. We previously demonstrated two waves of post-amputation expression of a nerve-mediated repressive epigenetic modulator, histone deacetylase 1 (HDAC1), at the wound healing (3 days post-amputation; 3 dpa) and blastema formation (8 dpa onward) stages in juvenile axolotls. Limb regeneration was profoundly inhibited by local injection of an HDAC inhibitor, MS-275, at the amputation sites. To explore the transcriptional response of post-amputation axolotl limb regeneration in a tissue-specific and time course-dependent manner after MS-275 treatment, we performed transcriptome sequencing of the epidermis and soft tissue (ST) at 0, 3, and 8 dpa with and without MS-275 treatment. Gene Ontology (GO) enrichment analysis of each coregulated gene cluster revealed a complex array of functional pathways in both the epidermis and ST. In particular, HDAC activities were required to inhibit the premature elevation of genes related to tissue development, differentiation, and morphogenesis. Further validation by Q-PCR in independent animals demonstrated that the expression of 5 out of 6 development- and regeneration-relevant genes that should only be elevated at the blastema stage was indeed prematurely upregulated at the wound healing stage when HDAC1 activity was inhibited. WNT pathway-associated genes were also prematurely activated under HDAC1 inhibition. Applying a WNT inhibitor to MS-275-treated amputated limbs partially rescued HDAC1 inhibition, resulting in blastema formation defects. We propose that post-amputation HDAC1 expression is at least partially responsible for pacing the expression timing of morphogenic genes to facilitate proper limb regeneration.

Keywords: axolotl limb regeneration; blastema; histone deacetylase; stage-dependent gene modulation; wound epidermis.


Conflict of interest statement

The authors declare that the research was conducted in the absence of any commercial or financial relationships that could be construed as a potential conflict of interest.

Figures

FIGURE 1
FIGURE 1
The effect of HDAC1 inhibition on the global transcriptome profiles of the epidermis and ST during the early stage of limb regeneration. (A) The HDAC1 inhibitor MS-275 was injected into the amputation site every other day after limb amputation to study the effect of HDAC1 depletion on transcriptome composition during early stage limb regeneration. Two biological replicates each of the epidermis and soft tissue (ST) at 0, 3, and 8 days post-amputation (dpa) were collected from HDAC1 inhibited and vehicle control animals. The epidermis and the underlying soft tissues were separated from the most distal part (2 mm) and then collected from 3 and 8 dpa, corresponding to the wound healing and blastema formation stages, respectively, and compared to the homeostatic control samples collected immediately after amputation. (B) Hierarchical clustering of overall transcripts based on the HDAC1 inhibitor MS-275, treatment and regeneration time course in the epidermis and ST. The expression values were transformed into z-scores for each gene, and a range of colors proportionate to the gene expression level are used (low: blue; high: red). See also supplementary Excel sheet 1. (C) Principal component analysis (PCA) of transcriptome profiles for the epidermis (top) and ST (bottom). The values in parentheses are the percentages of variance explained by each PC axis.
FIGURE 2
FIGURE 2
Premature enrichment of morphogenesis-related genes in the ST of the regenerating limb in the absence of HDAC1 activity. (A) The heatmap shows the results of GSEA at 3 dpa vs. 0 dpa or 8 dpa vs. 0 dpa with or without MS-275 treatment on gene sets defined by Gene Ontology. Red and blue indicate the gene sets significantly and positively (red) or negatively (blue) enriched, respectively, at 3 or 8 dpa (FDR < 0.05), and the intensity is associated with the normalized enrichment score (NES). (B) GSEA plots of the representative gene sets highlighted in (A). NES, normalized enrichment score; FDR, false discovery rate.
FIGURE 3
FIGURE 3
HDAC1 inhibition induced changes in regeneration stage-associated gene expression trends and the associated Gene Ontology terms based on unsupervised transcript clustering. (A) Unsupervised clustering of transcripts based on the trends in their expression patterns during normal regeneration at 0, 3, and 8 dpa. (B) The heatmap of the relative expression level of transcripts associated with each cluster. Transcript datasets from the ST in each stage without MS-275 treatment are shown for comparison. (C) The cluster transition matrix shows the proportion of genes in each given cluster (row) that exhibited changes in their expression pattern to those of other clusters (column) after MS-275 treatment. (D) Enrichment maps of gene sets significantly enriched (FDR < 0.05) by genes whose expression transitioned from cluster 4 to cluster 5 after MS-275 exposure. (E) The heatmap shows the expression values of selected genes whose expression transitioned from cluster 4 to cluster 5 after MS-275 exposure. (F) Enrichment maps of gene sets significantly enriched (FDR < 0.05) by genes whose expression transitions from cluster 4 to cluster 6 after MS-275 exposure. (G) The heatmap shows the expression values of selected genes whose expression transitioned from cluster 4 to cluster 6 after MS-275 exposure. (H) Enrichment maps of gene sets significantly enriched (FDR < 0.05) by genes whose expression transitions from cluster 4 to cluster 7 after MS-275 exposure. The red to white color gradient for each GO node indicates the significance of the enrichment for that particular GO term (red being more significant).

References

    1. Altschul SF., Gish W., Miller W., Myers EW., Lipman DJ. (1990). Basic local alignment search tool. J. Mol. Biol. 215 403–410. - PubMed
    1. Boilly B., Albert P. (1990). In vitro control of blastema cell proliferation by extracts from epidermal cap and mesenchyme of regenerating limbs of axolotls. Roux Arch. Dev. Biol. 198 443–447. 10.1007/bf00399054 - DOI - PubMed
    1. Bryant DM., Johnson K., DiTommaso T., Tickle T., Couger MB., Payzin-Dogru D., et al. (2017). A tissue-mapped axolotl de novo transcriptome enables identification of limb regeneration factors. Cell Rep. 18 762–776. 10.1016/j.celrep.2016.12.063 - DOI - PMC - PubMed
    1. Campbell LJ., Suárez-Castillo EC., Ortiz-Zuazaga H., Knapp D., Tanaka EM., Crews CM., et al. (2011). Gene expression profile of the regeneration epithelium during axolotl limb regeneration. Dev. Dyn. 240 1826–1840. 10.1002/dvdy.22669 - DOI - PMC - PubMed
    1. Carlson BM. (1975). The effects of rotation and positional change of stump tissues upon morphogenesis of the regenerating axolotl limb. Dev. Biol. 47 269–291. 10.1016/0012-1606(75)90282-1 - DOI - PubMed