Linking Lysosomal Enzyme Targeting Genes and Energy Metabolism with Altered Gray Matter Volume in Children with Persistent Stuttering
- PMID: 34041495
- PMCID: PMC8138901
- DOI: 10.1162/nol_a_00017
Linking Lysosomal Enzyme Targeting Genes and Energy Metabolism with Altered Gray Matter Volume in Children with Persistent Stuttering
Abstract
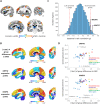
Developmental stuttering is a childhood onset neurodevelopmental disorder with an unclear etiology. Subtle changes in brain structure and function are present in both children and adults who stutter. It is a highly heritable disorder, and 12-20% of stuttering cases may carry a mutation in one of four genes involved in intracellular trafficking. To better understand the relationship between genetics and neuroanatomical changes, we used gene expression data from the Allen Institute for Brain Science and voxel-based morphometry to investigate the spatial correspondence between gene expression patterns and differences in gray matter volume between children with persistent stuttering (n = 26, and 87 scans) and their fluent peers (n = 44, and 139 scans). We found that the expression patterns of two stuttering-related genes (GNPTG and NAGPA) from the Allen Institute data exhibited a strong positive spatial correlation with the magnitude of between-group gray matter volume differences. Additional gene set enrichment analyses revealed that genes whose expression was highly correlated with the gray matter volume differences were enriched for glycolysis and oxidative metabolism in mitochondria. Because our current study did not examine the participants' genomes, these results cannot establish the direct association between genetic mutations and gray matter volume differences in stuttering. However, our results support further study of the involvement of lysosomal enzyme targeting genes, as well as energy metabolism in stuttering. Future studies assessing variations of these genes in the participants' genomes may lead to increased understanding of the biological mechanisms of the observed spatial relationship between gene expression and gray matter volume.
Keywords: longitudinal; lysosome; metabolism; stuttering; voxel-based morphometry.
© 2020 Massachusetts Institute of Technology. Published under a Creative Commons Attribution 4.0 International (CC BY 4.0) license.
Figures

Similar articles
-
Association Between Gray Matter Volume Variations and Energy Utilization in the Brain: Implications for Developmental Stuttering.J Speech Lang Hear Res. 2021 Jun 18;64(6S):2317-2324. doi: 10.1044/2020_JSLHR-20-00325. Epub 2021 Mar 9. J Speech Lang Hear Res. 2021. PMID: 33719533 Free PMC article.
-
Brain developmental trajectories associated with childhood stuttering persistence and recovery.Dev Cogn Neurosci. 2023 Apr;60:101224. doi: 10.1016/j.dcn.2023.101224. Epub 2023 Feb 26. Dev Cogn Neurosci. 2023. PMID: 36863188 Free PMC article.
-
A voxel-based morphometry (VBM) analysis of regional grey and white matter volume abnormalities within the speech production network of children who stutter.Cortex. 2013 Sep;49(8):2151-61. doi: 10.1016/j.cortex.2012.08.013. Epub 2012 Sep 17. Cortex. 2013. PMID: 23140891 Free PMC article.
-
Research updates in neuroimaging studies of children who stutter.Semin Speech Lang. 2014 May;35(2):67-79. doi: 10.1055/s-0034-1382151. Epub 2014 May 29. Semin Speech Lang. 2014. PMID: 24875668 Free PMC article. Review.
-
White matter pathways in persistent developmental stuttering: Lessons from tractography.J Fluency Disord. 2018 Mar;55:68-83. doi: 10.1016/j.jfludis.2017.09.002. Epub 2017 Sep 13. J Fluency Disord. 2018. PMID: 29050641 Review.
Cited by
-
Phenome risk classification enables phenotypic imputation and gene discovery in developmental stuttering.Am J Hum Genet. 2021 Dec 2;108(12):2271-2283. doi: 10.1016/j.ajhg.2021.11.004. Am J Hum Genet. 2021. PMID: 34861174 Free PMC article.
-
Neuroanatomical anomalies associated with rare AP4E1 mutations in people who stutter.Brain Commun. 2021 Nov 13;3(4):fcab266. doi: 10.1093/braincomms/fcab266. eCollection 2021. Brain Commun. 2021. PMID: 34859215 Free PMC article.
-
Stuttering as a spectrum disorder: A hypothesis.Curr Res Neurobiol. 2023 Nov 1;5:100116. doi: 10.1016/j.crneur.2023.100116. eCollection 2023. Curr Res Neurobiol. 2023. PMID: 38020803 Free PMC article. Review.
-
Psychedelics in developmental stuttering to modulate brain functioning: a new therapeutic perspective?Front Hum Neurosci. 2024 Jun 19;18:1402549. doi: 10.3389/fnhum.2024.1402549. eCollection 2024. Front Hum Neurosci. 2024. PMID: 38962146 Free PMC article.
-
Speech Fluency Improvement in Developmental Stuttering Using Non-invasive Brain Stimulation: Insights From Available Evidence.Front Hum Neurosci. 2021 Aug 11;15:662016. doi: 10.3389/fnhum.2021.662016. eCollection 2021. Front Hum Neurosci. 2021. PMID: 34456692 Free PMC article. Review.
References
-
- Abou Jamra, R., Philippe, O., Raas-Rothschild, A., Eck, S. H., Graf, E., Buchert, R., … Colleaux, L. (2011). Adaptor protein complex 4 deficiency causes severe autosomal-recessive intellectual disability, progressive spastic paraplegia, shy character, and short stature. American Journal of Human Genetics, 88(6), 788–795. 10.1016/j.ajhg.2011.04.019 - DOI - PMC - PubMed
-
- Barnes, J., Lim, J. M., Godard, A., Blanchard, F., Wells, L., & Steet, R. (2011). Extensive mannose phosphorylation on leukemia inhibitory factor (LIF) controls its extracellular levels by multiple mechanisms. Journal of Biological Chemistry, 286(28), 24855–24864. 10.1074/jbc.M111.221432 - DOI - PMC - PubMed
Grants and funding
LinkOut - more resources
Full Text Sources
Miscellaneous
