Quantitative Clinical Pharmacology Supports the Bridging From i.v. Dosing and Approval of s.c. Rituximab in B-Cell Hematological Malignancies
- PMID: 34041738
- PMCID: PMC8597022
- DOI: 10.1002/cpt.2308
Quantitative Clinical Pharmacology Supports the Bridging From i.v. Dosing and Approval of s.c. Rituximab in B-Cell Hematological Malignancies
Abstract
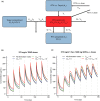
A fixed-dose subcutaneous (s.c.) formulation of the anti-CD20 antibody, rituximab, has been developed to address safety, infusion time, and patient comfort concerns relating to intravenous (i.v.) dosing, and has been approved based upon a pharmacokinetic (PK)-clinical bridging strategy, which demonstrated noninferiority of s.c. vs. i.v. dosing in malignancies, including follicular lymphoma (FL) and chronic lymphocytic leukemia (CLL). A clinical development plan was undertaken to identify rituximab s.c. doses achieving noninferior exposure to rituximab i.v., and to confirm PK-clinical bridging, with the same efficacy and similar safety. This drew upon data from 1,579 patients with FL, CLL, or diffuse large B-cell lymphoma in 5 clinical studies, and showed minimum steady-state serum concentration (Ctrough ) as the most appropriate exposure bridging measure. Population PK models were developed, simulations were run using covariates and PK parameters from clinical studies, and exposure-efficacy and -safety analyses performed. Population PKs showed a two-compartment model with time-dependent and -independent clearances. Clearance and volume were predominantly influenced by body surface area; disposition and elimination were similar for the s.c. and i.v. formulations. After s.c. administration, patients with FL and CLL achieved noninferior exposures to i.v. dosing. Overall, rituximab exposure and route of administration did not influence clinical responses in patients with FL or CLL, and there was no association between exposure and safety events. Ctrough was shown to be an effective pharmacologic-clinical bridging parameter for rituximab in patients with FL or CLL. Clinically effective exposures are achieved with either s.c. or i.v. dosing.
© 2021 Roche. Clinical Pharmacology & Therapeutics published by Wiley Periodicals LLC on behalf of American Society for Clinical Pharmacology and Therapeutics.
Conflict of interest statement
C.J., C.C., P.N.M., C.McI., M.B., L.L., A.Z., A.B., and N.F. are employees of F. Hoffmann‐La Roche Ltd. C.J. and C.C. own stock of F. Hoffmann‐La Roche Ltd. E.G. and L.G. are contractors of F. Hoffmann‐La Roche Ltd.
Figures


Similar articles
-
Population pharmacokinetic and exposure-response analyses of intravenous and subcutaneous rituximab in patients with chronic lymphocytic leukemia.CPT Pharmacometrics Syst Pharmacol. 2021 Aug;10(8):914-927. doi: 10.1002/psp4.12665. Epub 2021 Jul 16. CPT Pharmacometrics Syst Pharmacol. 2021. PMID: 34110098 Free PMC article.
-
Pharmacokinetics, exposure, efficacy and safety of obinutuzumab in rituximab-refractory follicular lymphoma patients in the GADOLIN phase III study.Br J Clin Pharmacol. 2019 Sep;85(9):1935-1945. doi: 10.1111/bcp.13974. Epub 2019 Jul 12. Br J Clin Pharmacol. 2019. PMID: 31050355 Free PMC article. Clinical Trial.
-
Pharmacokinetics and safety of subcutaneous rituximab plus fludarabine and cyclophosphamide for patients with chronic lymphocytic leukaemia.Br J Clin Pharmacol. 2015 Nov;80(5):1001-9. doi: 10.1111/bcp.12662. Epub 2015 Jul 29. Br J Clin Pharmacol. 2015. PMID: 25900065 Free PMC article. Clinical Trial.
-
An Evidence-based Review of Anti-CD20 Antibody-containing Regimens for the Treatment of Patients With Relapsed or Refractory Chronic Lymphocytic Leukemia, Diffuse Large B-cell Lymphoma, or Follicular Lymphoma.Clin Lymphoma Myeloma Leuk. 2018 Aug;18(8):508-518.e14. doi: 10.1016/j.clml.2018.05.009. Epub 2018 May 23. Clin Lymphoma Myeloma Leuk. 2018. PMID: 29934061 Review.
-
Subcutaneous Rituximab for the Treatment of B-Cell Hematologic Malignancies: A Review of the Scientific Rationale and Clinical Development.Adv Ther. 2017 Oct;34(10):2210-2231. doi: 10.1007/s12325-017-0610-z. Epub 2017 Oct 5. Adv Ther. 2017. PMID: 28983819 Free PMC article. Review.
References
-
- Dreyling, M. et al. Newly diagnosed and relapsed follicular lymphoma: ESMO Clinical Practice Guidelines for diagnosis, treatment and follow‐up. Ann. Oncol. 25(Suppl 3), iii76–iii82 (2014). - PubMed
-
- Tilly, H. et al. Diffuse large B‐cell lymphoma (DLBCL): ESMO clinical practice guidelines for diagnosis, treatment and follow‐up. Ann. Oncol. 26(Suppl 5), v116–v125 (2015). - PubMed
Publication types
MeSH terms
Substances
LinkOut - more resources
Full Text Sources
Other Literature Sources
Miscellaneous

