. 2021 May 27;384(21):2014-2027.
doi: 10.1056/NEJMoa2003608.

A Novel Circulating MicroRNA for the Detection of Acute Myocarditis

Affiliations

A Novel Circulating MicroRNA for the Detection of Acute Myocarditis

Rafael Blanco-Domínguez et al. N Engl J Med. .

Erratum in

Abstract

Background: The diagnosis of acute myocarditis typically requires either endomyocardial biopsy (which is invasive) or cardiovascular magnetic resonance imaging (which is not universally available). Additional approaches to diagnosis are desirable. We sought to identify a novel microRNA for the diagnosis of acute myocarditis.

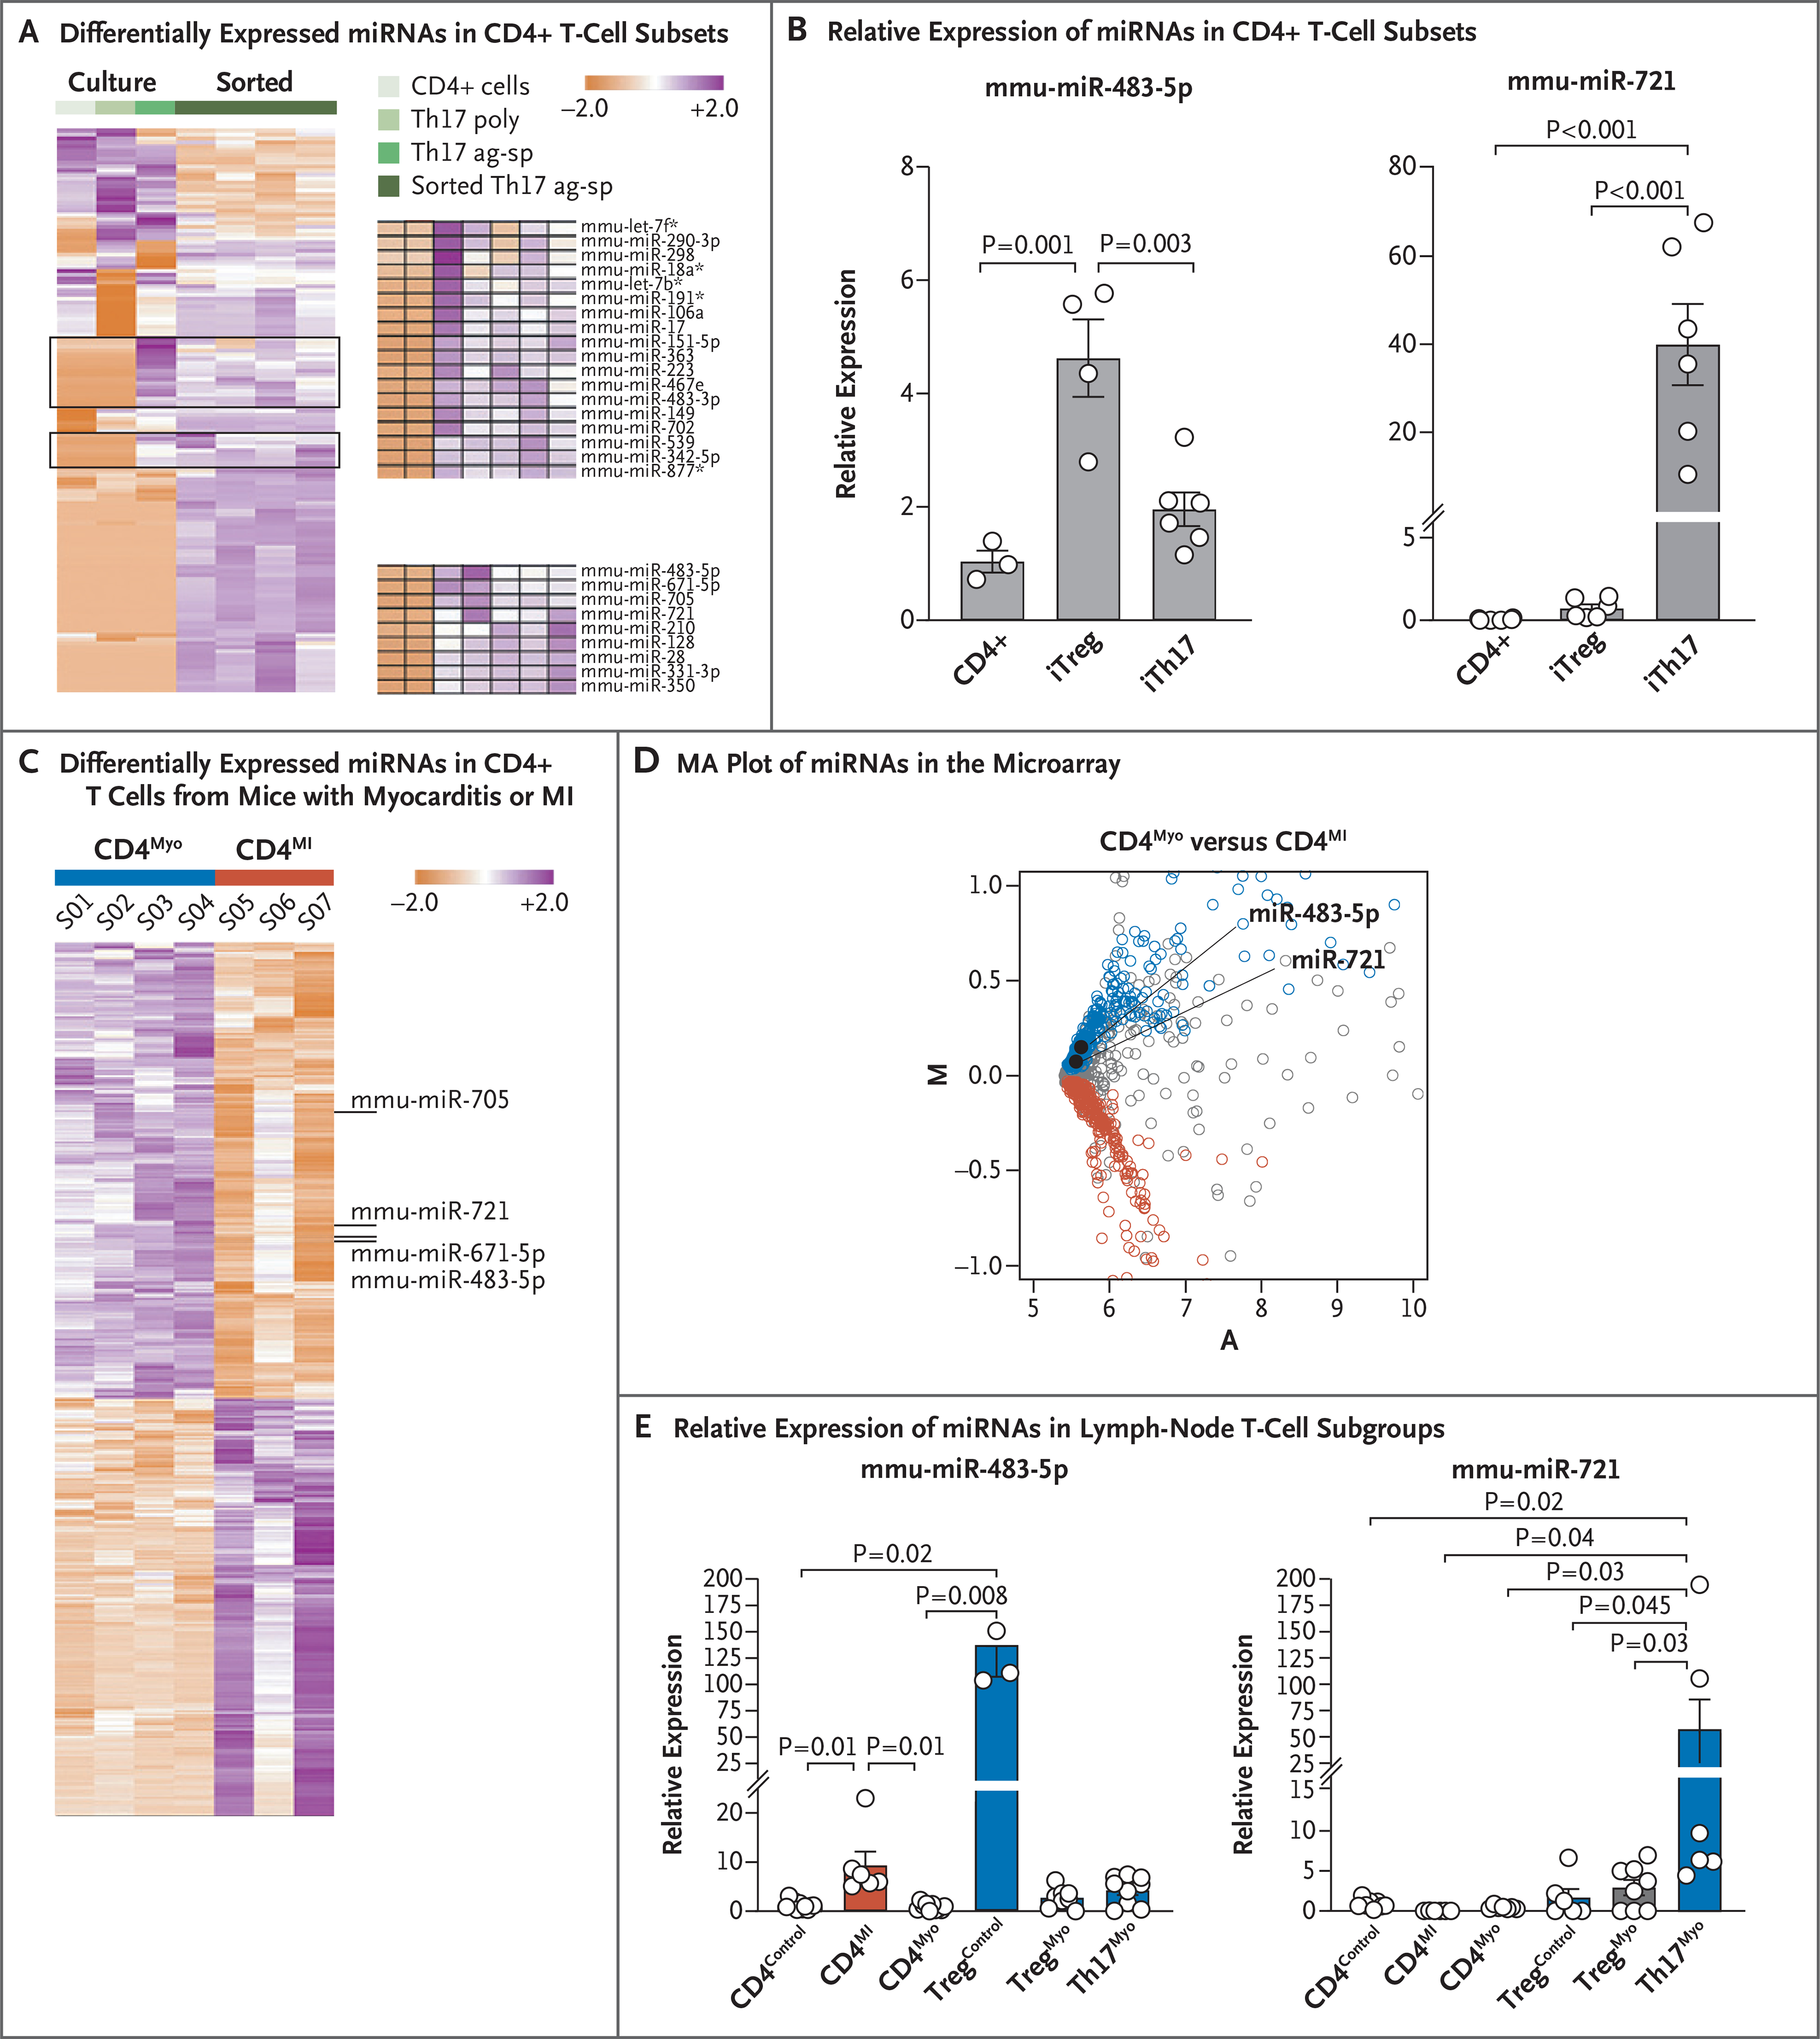
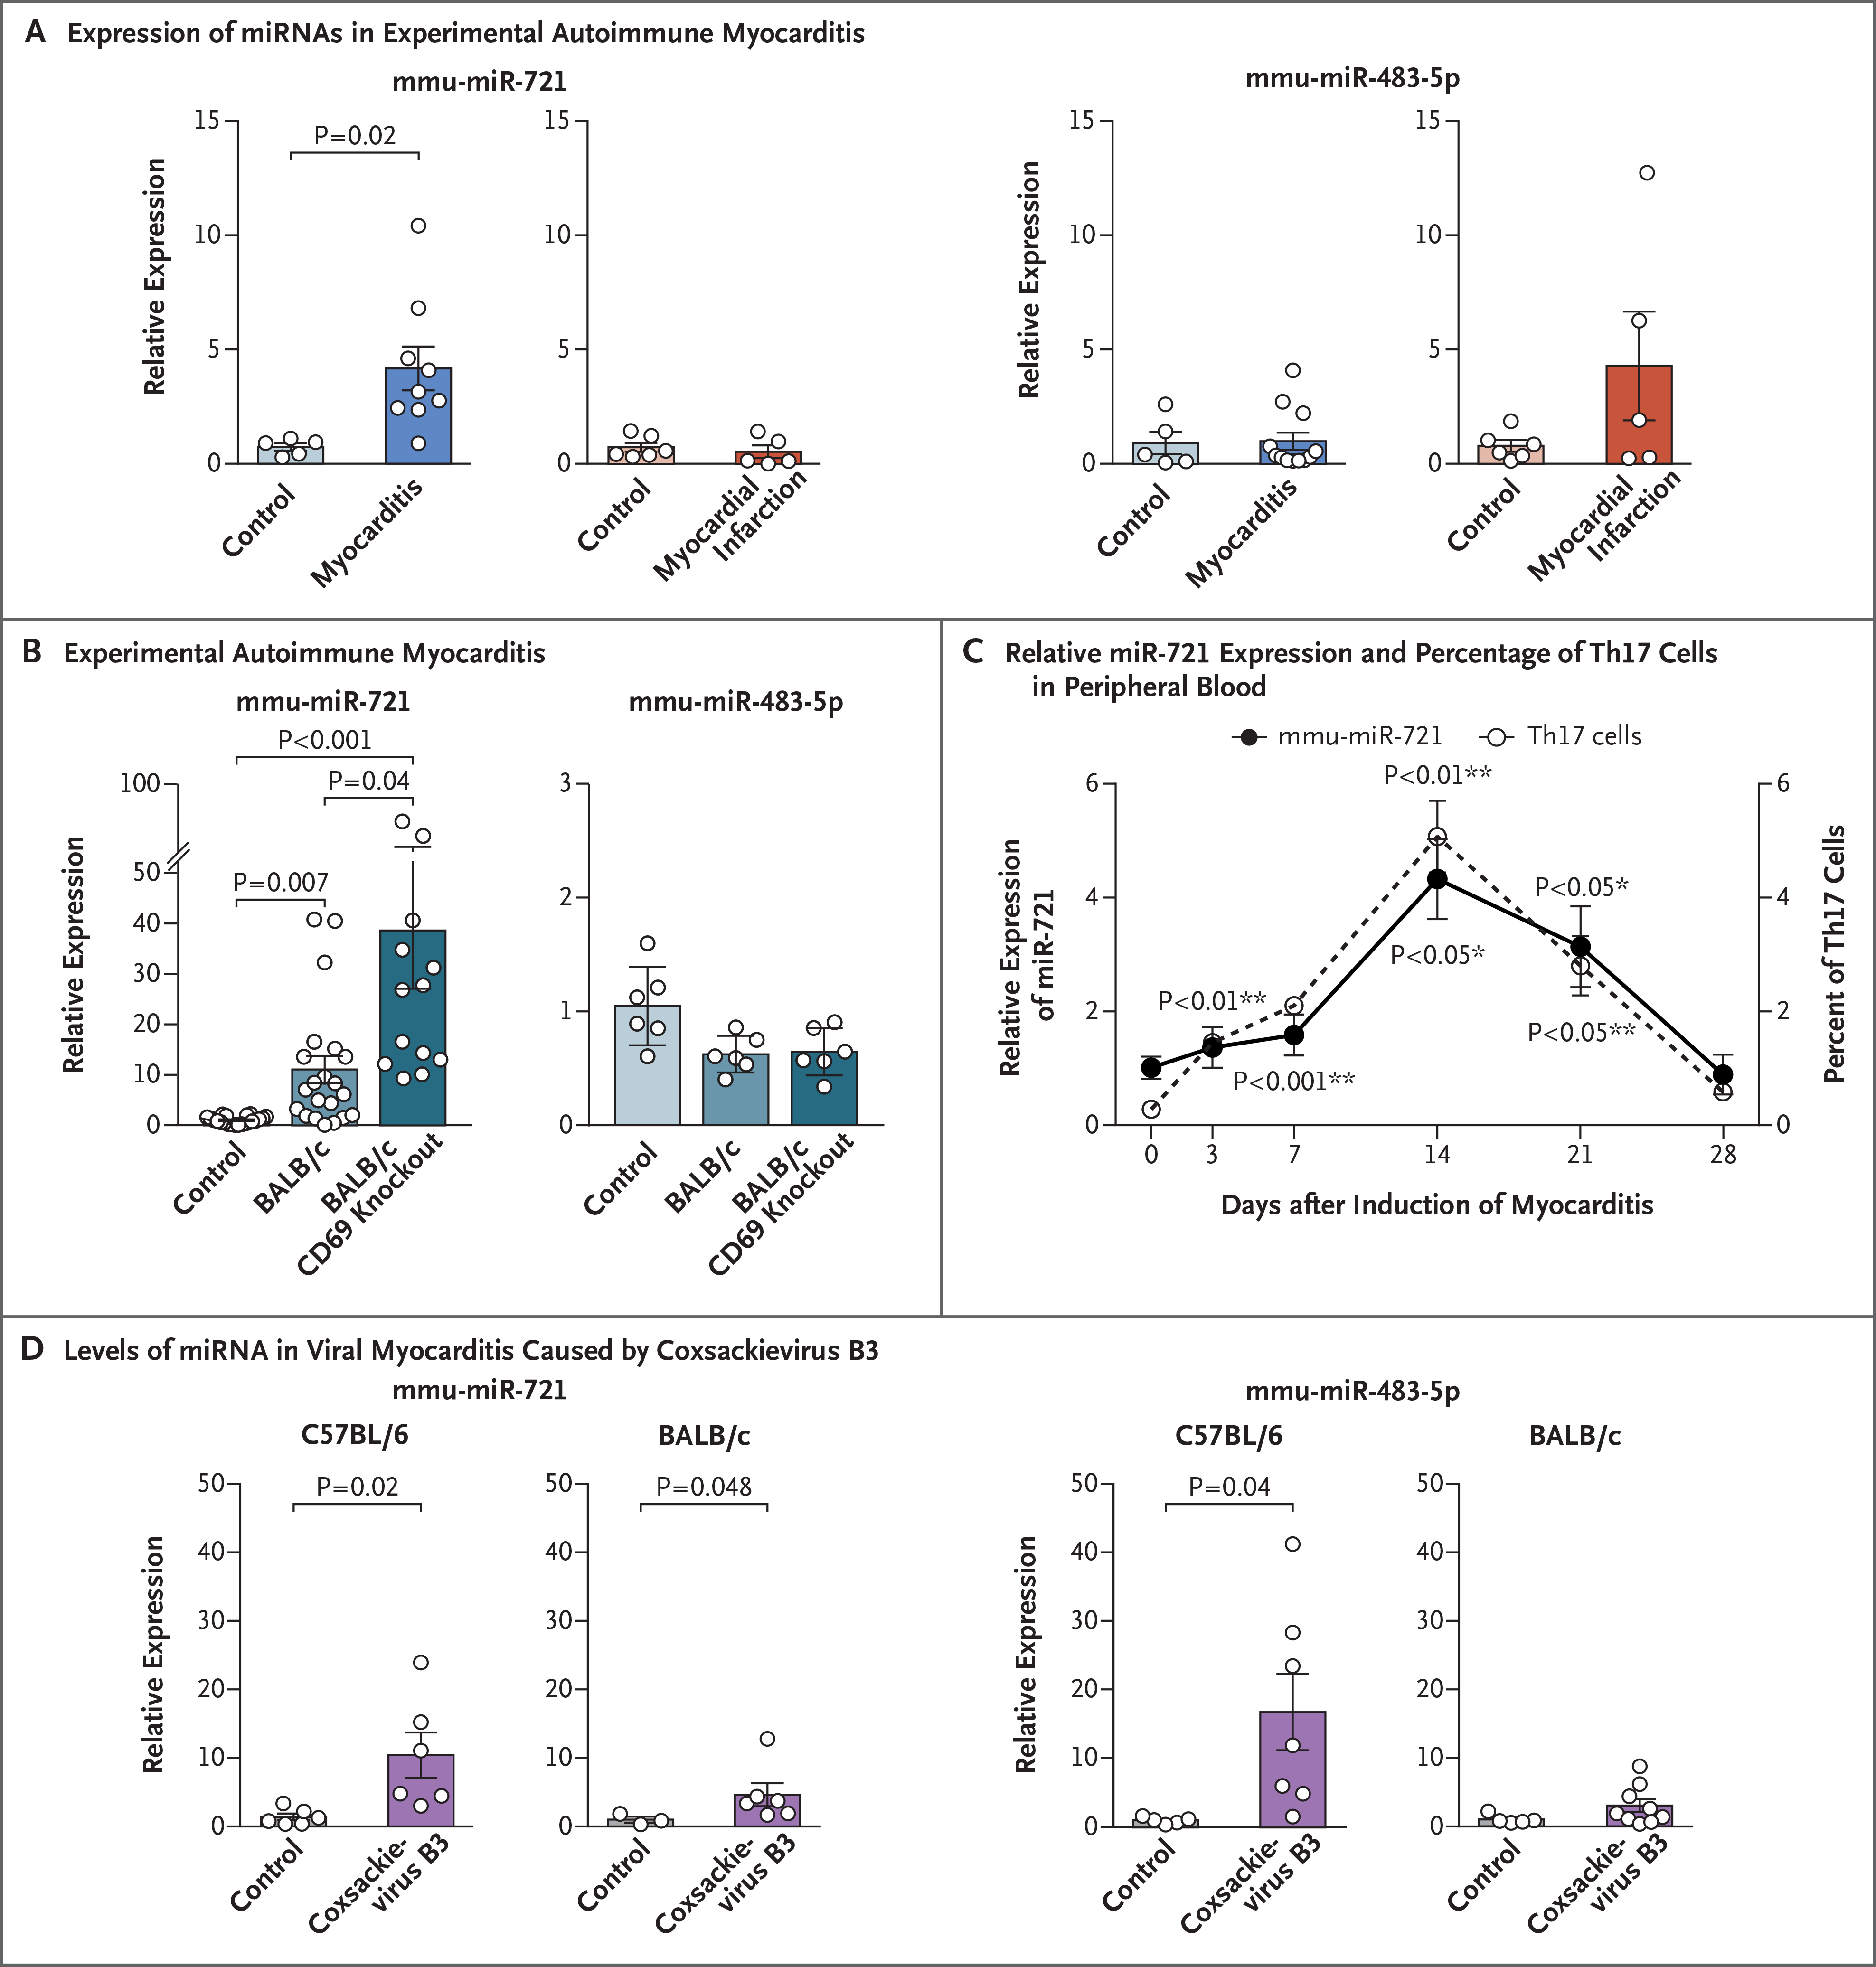
Methods: To identify a microRNA specific for myocarditis, we performed microRNA microarray analyses and quantitative polymerase-chain-reaction (qPCR) assays in sorted CD4+ T cells and type 17 helper T (Th17) cells after inducing experimental autoimmune myocarditis or myocardial infarction in mice. We also performed qPCR in samples from coxsackievirus-induced myocarditis in mice. We then identified the human homologue for this microRNA and compared its expression in plasma obtained from patients with acute myocarditis with the expression in various controls.

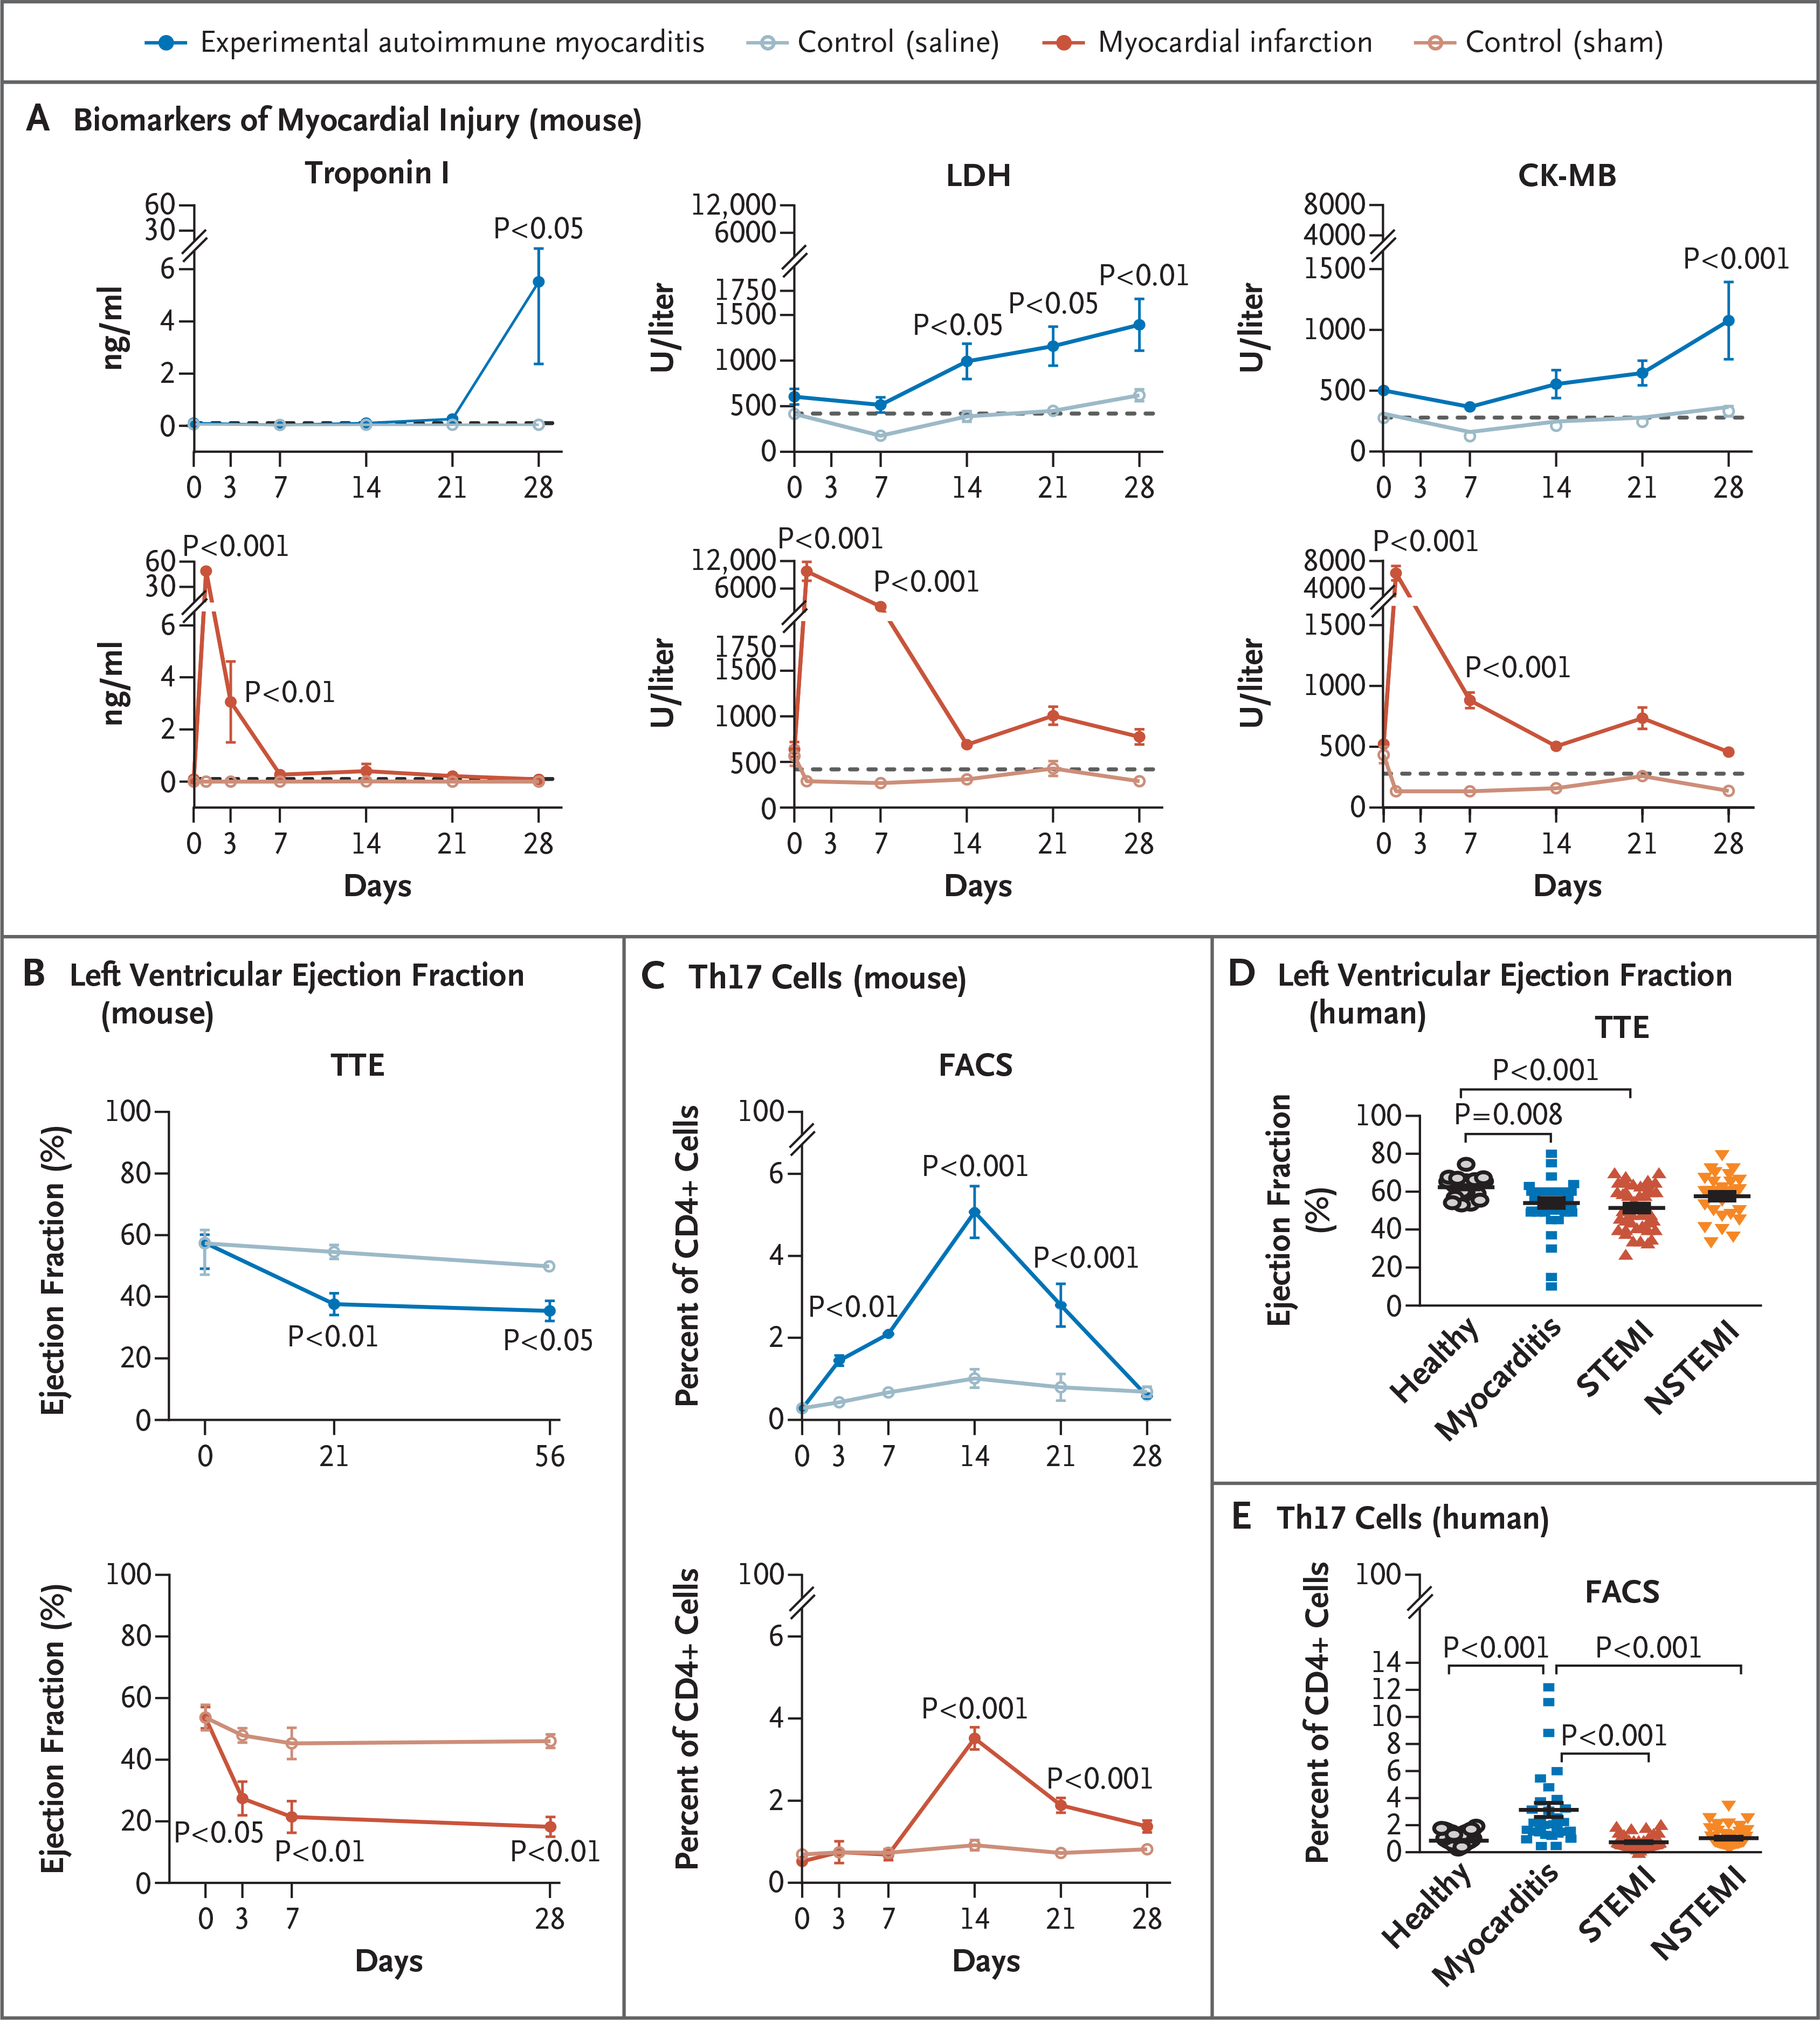
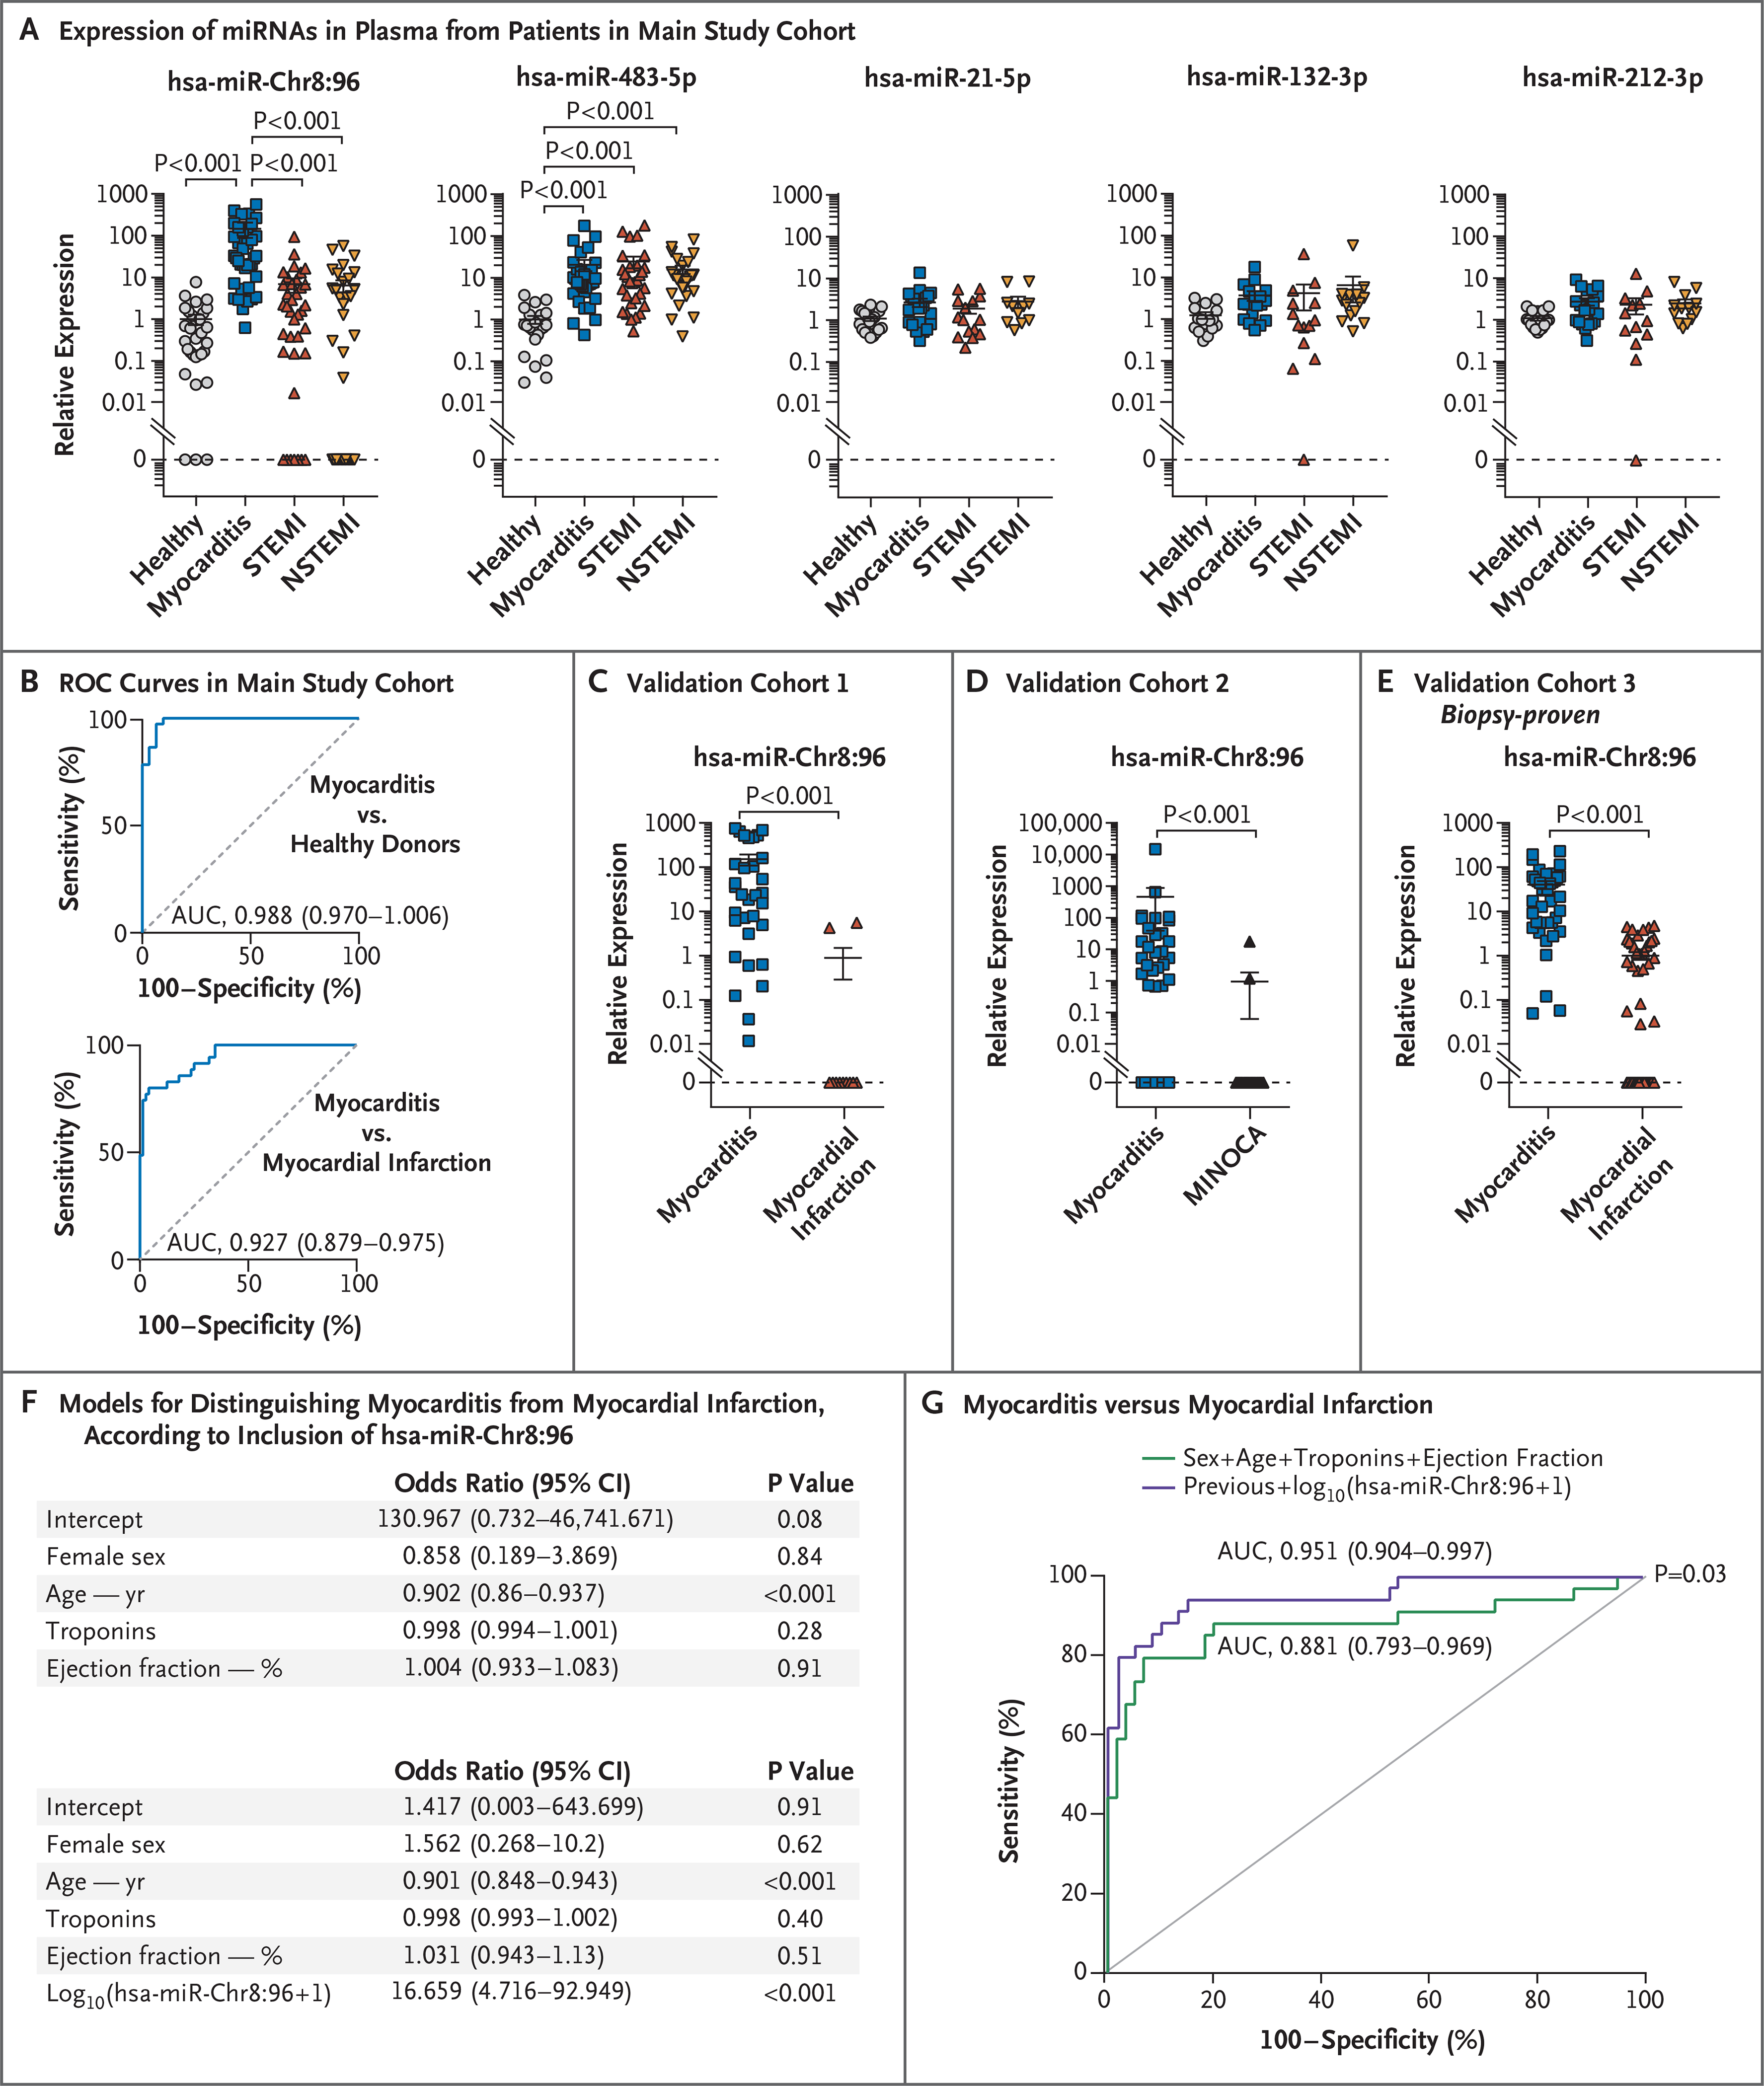
Results: We confirmed that Th17 cells, which are characterized by the production of interleukin-17, are a characteristic feature of myocardial injury in the acute phase of myocarditis. The microRNA mmu-miR-721 was synthesized by Th17 cells and was present in the plasma of mice with acute autoimmune or viral myocarditis but not in those with acute myocardial infarction. The human homologue, designated hsa-miR-Chr8:96, was identified in four independent cohorts of patients with myocarditis. The area under the receiver-operating-characteristic curve for this novel microRNA for distinguishing patients with acute myocarditis from those with myocardial infarction was 0.927 (95% confidence interval, 0.879 to 0.975). The microRNA retained its diagnostic value in models after adjustment for age, sex, ejection fraction, and serum troponin level.

Conclusions: After identifying a novel microRNA in mice and humans with myocarditis, we found that the human homologue (hsa-miR-Chr8:96) could be used to distinguish patients with myocarditis from those with myocardial infarction. (Funded by the Spanish Ministry of Science and Innovation and others.).


Figures

Figure 1 (facing page).
Figure 1 (facing page).. Circulating Th17 Cells in Acute Myocarditis.
Panel A shows the kinetics of biomarkers of myocardial injury — troponin I, lactate dehydrogenase (LDH), and creatine kinase MB (CK-MB) — in the serum of BALB/c mice after induction of experimental autoimmune myocarditis (following immunization with cardiac α-myosin heavy-chain peptide) as compared with control mice (following immunization with phosphate-buffered saline). Also shown are the changes in the same biomarkers after the induction of myocardial infarction (following ligation of the left anterior descending coronary artery) as compared with control mice (following a sham operation). Dashed lines represent basal levels of each biomarker. P values, which are shown for the comparisons with controls, were calculated by two-way analysis of variance with Sidak’s multiple comparisons test. Data are representative of more than three independent experiments in 3 to 10 pools of two mice each. Panel B shows the time course of changes in the left ventricular ejection fraction after the induction of myocarditis or myocardial infarction, as quantified by transthoracic echocardiography (TTE), with 4 to 7 mice per group. Panel C shows the time course of changes in the percentage of type 17 helper T (Th17) cells in CD4+ T cells in the blood of BALB/c mice after myocarditis or myocardial infarction (and respective controls), according to the results of fluorescence-activated cell sorting (FACS) in 6 mice per group. P values were calculated by means of two-way repeated-measures analysis of variance (Sidak’s post hoc test). Data in Panels B and C are representative of more than three independent experiments. Panel D shows the left ventricular ejection fraction, as measured by TTE, in samples obtained from 43 patients with myocarditis, 43 patients with ST-segment elevation myocardial infarction (STEMI), 35 patients with non-STEMI (NSTEMI), and 23 healthy controls. Data were analyzed by means of the Kruskal–Wallis test with Dunn’s multiple comparisons test. Panel E shows the quantification of Th17 cells on FACS as a percentage of all CD4+ T cells in peripheral-blood samples obtained from patients with acute myocarditis, STEMI, or NSTEMI and from healthy controls. P values were calculated by the same method used in Panel D and were performed in the analysis of samples from 33 patients with myocarditis, 45 with STEMI, and 41 with NSTEMI, along with 62 healthy controls. In all five panels, the data are represented as means, with I bars representing standard errors.
Figure 2 (facing page).
Figure 2 (facing page).. Synthesis of miRNAs by Circulating Th17 Cells in Myocarditis.
Panel A shows a heat map representing unsupervised hierarchical clustering for the murine microRNAs (miRNAs) expressed in common among the cell types displayed, as analyzed by means of miRNA microarray. Lymph node CD4+ T cells were activated for 48 hours with monoclonal antibodies against T-cell activation molecules CD3 and CD28 or underwent polyclonal differentiation into Th17 (Th17 poly) cells or ovalbumin antigen-specific Th17 (Th17ag-sp) cells in vitro, before sorting or in parallel with sorted interleukin-17+ cells (sorted Th17ag-sp in 4 samples). All data have been normalized by the median of each miRNA. The color scale indicates the relative expression level of each miRNA, with white indicating 0 expression, purple indicating an expression of more than 0, and orange indicating an expression of less than 0. The two gates include 27 miRNAs that were differentially expressed by Th17ag-sp cells (magnified on the right). Panel B shows the relative expression of mmu-miR-483–5p and mmu-miR-721 in freshly isolated CD4+ T cells and in vitro differentiated Th17ag-sp (iTh17) and regulatory T (Treg) ag-sp (iTreg) cultures analyzed by quantitative polymerase-chain-reaction (qPCR) assay (3 to 6 experiments for each cell type). Data are represented as means (±SE), and P values were calculated by one-way analysis of variance with Tukey’s post hoc test. Panel C shows a heat map for the differentially expressed miRNAs with significant expression variance between sorted CD4+ T cells obtained from axillary lymph nodes 6 days after the induction of experimental autoimmune myocarditis (CD4Myo, in 4 mice) and from mediastinal lymph nodes obtained 3 days after myocardial infarction (MI) following coronary-artery ligation (CD4MI, 3 pools of 2 mice each) in BALB/c mice, after normalization by the median of each miRNA. Individual miRNAs of interest are identified to the right of the heat map. Panel D shows an “MA” plot indicating the average expression (A) versus the log2 of the mean difference (M) of miRNAs detected in the microarray. In the plot, miRNAs that are significantly overrepresented (P<0.1 after adjustment) in CD4Myo cells (blue) and CD4MI cells (red) are indicated. In both these cell populations, miRNAs that are indistinctly represented (P>0.1 after adjustment) are indicated in gray. Panel E shows the relative expression of mmu-miR-483–5p and mmu-miR-721 by qPCR in T-cell subgroups isolated from mediastinal or axillary lymph nodes normalized to CD4+ control cells; CD4Control corresponds to CD4+ T cells isolated from axillary lymph nodes from saline-injected control mice, CD4MI to CD4+ T cells isolated from mediastinal lymph nodes after myocardial infarction, CD4Myo to CD4+ T cells isolated from axillary lymph nodes after the induction of experimental autoimmune myocarditis, TregControl to CD4+Foxp3+ cells isolated from axillary lymph nodes from saline-injected control mice, TregMyo to CD4+Foxp3+ cells isolated from axillary lymph nodes after the induction of experimental autoimmune myocarditis, and Th17Myo to CD4+ interleukin-17 cells sorted from axillary lymph nodes after the induction of experimental autoimmune myocarditis. Histograms indicate the mean relative expression of each miRNA in cells pooled from three independent experiments; I bars indicate standard errors. P values were calculated by one-way analysis of variance with Tukey’s post hoc test (in 5 to 7 pools of 2 mice each for mmu-miR-721) and by the Kruskal–Wallis test with Dunn’s post hoc test (in 3 to 7 pools of 2 mice each for mmu-miR-483–5p).
Figure 3 (facing page).
Figure 3 (facing page).. Circulating miRNAs in Mice with Autoimmune or Viral Myocarditis.
Panel A shows the expression of mmu-miR-721 and mmu-miR-483–5p in an analysis performed by qPCR in plasma obtained from BALB/c mice 21 days after the induction of experimental autoimmune myocarditis (following immunization with cardiac α-myosin heavy-chain peptide) or control mice (following immunization with phosphate-buffered saline), or 3 days after the induction of myocardial infarction (following ligation of the left anterior descending coronary artery) or control mice (following sham operation). Data are represented as means (±SE) from one representative among three independent experiments involving 5 to 9 mice per group. The P value was calculated by the unpaired t-test. Panel B shows the relative expression of mmu-miR-721 and mmu-miR-483–5p in serum obtained from mice with moderate myocarditis (BALB/c background) or severe myocarditis (BALB/c CD69 knockout background), and control mice immunized with saline (with 6 to 21 mice per group), analyzed by qPCR. Histogram values are means (±SE), with calculations performed by one-way analysis of variance with Tukey’s post hoc test. Panel C shows the relative expression of mmu-miR-721 (analyzed by qPCR) and the percentage of Th17 cells in peripheral blood (analyzed by flow cytometry) in samples obtained from mice at different time points after the induction of experimental autoimmune myocarditis in 6 mice. I bars represent standard errors. P values were determined by one-way repeated-measures analysis of variance. Dunnett’s multiple-comparison test was performed between values at day 3 to day 28 as compared with day 0 after induction of myocarditis for mmu-miR-721 relative expression (*) and for the percentage of Th17 cells (**) individually. Panel D shows levels of circulating miRNA that were assessed by qPCR during viral myocarditis at 10 days after infection with coxsackievirus B3. The expression in BALB/c and C57BL/6 mouse strains was analyzed in parallel with uninfected control groups (5 to 7 mice per group). Data that are reported as means (±SE) were analyzed by means of the unpaired t-test (in C57BL/6 mice) and the Mann–Whitney U test (in BALB/c mice).
Figure 4 (facing page).
Figure 4 (facing page).. Cloning and Validation of hsa-miR-Chr8:96.
Panel A shows the results of analyses with the use of polyacrylamide gel electrophoresis (at left) indicating the qPCR product (black arrowhead) in human plasma samples obtained from patients with acute myocarditis or acute myocardial infarction or from healthy controls with the mmu-miR-721 probe. Transfected mmu-miR-721 in human cells was used as a positive control (C+). MW denotes molecular-weight markers. Quantification of the average intensity of the qPCR product (stained with methylene blue and quantified with Image Studio Lite, version 4.0) is shown at right. Data are pooled from two independent gels. Histograms represent the mean values (±SE) and were analyzed by one-way analysis of variance with Tukey’s post hoc test (with 5 patients per group). Panel B shows quantification of pGEM-T cloning efficiency of the qPCR products from human plasma samples. The product obtained from sequencing the colonies included 18 nucleotides (nt) (black) and a polyadenine tail (gray) from the reverse primer poly dT (a short sequence of deoxythymidine nucleotide) used for qPCR, inserted into the vector sequence (green). Panel C shows a diagram of pCDH-CMV-MCS-EF1-copGFP–based lentiviral vector used to express the sequence of Chr8:96405654–96406003, containing 350 nucleotides including the putative primary miRNA pri-hsa-miR-Chr8:96 (at top). Also shown is representative blotting with Argonaute-2 antibody of the RNA–Argonaute-2–IgG1 coimmunoprecipitation fraction (middle graph) and the expression of the indicated miRNAs in the coimmunoprecipitation fractions evaluated by qPCR (lower graph). To quantify the expression of hsa-miR-Chr8:96, a custom-made probe was used to amplify the putative mature hsa-miR-Chr8:96 (TCT TGC AAT TAA AAG GGG GAA). RNU1A1, a small nuclear RNA that is processed independently of Argonaute-2, was used as an endogenous control for miRNA relative expression (1 of 4 independent experiments). Panel D shows a diagram of psiCHECK2-RC-hsa-miR-Chr8:96 luciferase dual reporter vector (at top). The 2-mer insert consists of a tandem repeat of the reverse complementary (RC) sequence to the mature hsa-miR-Chr8:96. Also shown are peripheral-blood leukocytes obtained from patients with acute myocarditis, from those with acute myocardial infarction, and from healthy controls that were cultured overnight, followed by collection of supernatants (bottom graph). Renilla and firefly dual luciferase reporter assays were performed after transiently transfecting HEK293T cells with an empty plasmid (psiCHECK2 Ø) or psiCHECK2-RC-hsa-miR-Chr8:96–expressing plasmid, by adding the supernatant of the different human samples. Firefly luciferase and renilla signals were analyzed (5 supernatants from 5 different study participants from each group). Data are means (±SE) and analyzed by two-way analysis of variance with Sidak’s post hoc test. CMV denotes cytomegalovirus promoter, CopGFP superbright green fluorescent protein, EF1 elongation factor 1 promoter, hLUC+ synthetic firefly luciferase gene, hRLUC synthetic renilla luciferase reporter gene, HSV-TK herpes simplex virus-1 thymidine kinase promoter, MCS multicloning site, Ø empty plasmid, pCDH complementary DNA cloning and expression lentivector, and T7 T7 promoter.
Figure 5 (facing page).
Figure 5 (facing page).. Analysis of Circulating hsa-miR-Chr8:96 for the Detection of Acute Myocarditis.
Panel A shows quantification of miRNAs by qPCR in circulating plasma obtained from 39 patients with acute myocarditis, 39 patients with STEMI, and 38 patients with NSTEMI, along with plasma from 31 healthy controls in the main study cohort in Spain. Data are represented as log10 of miRNA relative expression in plasma. I bars represent standard errors. Data were analyzed by Kruskal–Wallis with Dunn’s post hoc test. Panel B shows receiver-operating-characteristic (ROC) curves of hsa-miR-Chr8:96 determinations in plasma, based on the relative gene-expression values calculated by the delta–delta Ct (cycle threshold) method for the qPCR analysis, which were generated to distinguish patients with acute myocarditis from those with acute myocardial infarction and from healthy controls. Also indicated are the area under the ROC curve (AUC), 95% confidence interval (CI), and P value for each comparison. Panel C shows validation cohort 1 of patients with myocarditis or acute myocardial infarction from the Partners Biobank (Boston) (AUC, 0.952; 95% CI, 0.883 to 1.000). Panel D shows validation cohort 2 of patients with myocarditis, as compared with those with acute myocardial infarction with nonobstructive coronary arteries (MINOCA), from University Hospital Zurich (AUC, 0.831; 95% CI, 0.722 to 0.941). Panel E shows validation cohort 3 of patients with biopsy-proven acute myocarditis from the University of Padua and patients with acute myocardial infarction from the Biobank Regional Platform (Murcia, Spain) (AUC, 0.938; 95% CI, 0.889 to 0.988). In Panels C, D, and E, circulating miRNA levels are represented as means (±SE) and were analyzed by the Mann–Whitney U test. Panel F shows multivariable logistic-regression models with or without inclusion of hsa-miR-Chr8:96 after adjustment for potential confounders (age, sex, serum troponin levels, and left ventricular ejection fraction) to distinguish patients with myocarditis from those with myocardial infarction. Panel G shows ROC curves for the multivariable logistic-regression models with or without hsa-miR-Chr8:96 and the variables of sex, age, serum troponin levels, and left ventricular ejection fraction. DeLong’s test was used for the comparison of the AUC.

Comment in

References

    1. Heymans S, Eriksson U, Lehtonen J, Cooper LT Jr. The quest for new approaches in myocarditis and inflammatory cardiomyopathy. J Am Coll Cardiol 2016;68: 2348–64. - PubMed
    1. Cooper LT Jr. Myocarditis. N Engl J Med 2009;360:1526–38. - PMC - PubMed
    1. Frustaci A, Russo MA, Chimenti C. Randomized study on the efficacy of immunosuppressive therapy in patients with virus-negative inflammatory cardiomyopathy: the TIMIC study. Eur Heart J 2009; 30:1995–2002. - PubMed
    1. Caforio AL, Marcolongo R, Basso C, Iliceto S. Clinical presentation and diagnosis of myocarditis. Heart 2015;101:1332–44. - PubMed
    1. Felker GM, Thompson RE, Hare JM, et al. Underlying causes and long-term survival in patients with initially unexplained cardiomyopathy. N Engl J Med 2000;342:1077–84. - PubMed

Publication types

MeSH terms