Conductance-Based Structural Brain Connectivity in Aging and Dementia
- PMID: 34042511
- PMCID: PMC8558081
- DOI: 10.1089/brain.2020.0903
Conductance-Based Structural Brain Connectivity in Aging and Dementia
Abstract
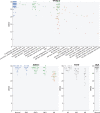
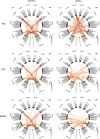
Background: Structural brain connectivity has been shown to be sensitive to the changes that the brain undergoes during Alzheimer's disease (AD) progression. Methods: In this work, we used our recently proposed structural connectivity quantification measure derived from diffusion magnetic resonance imaging, which accounts for both direct and indirect pathways, to quantify brain connectivity in dementia. We analyzed data from the second phase of Alzheimer's Disease Neuroimaging Initiative and third release in the Open Access Series of Imaging Studies data sets to derive relevant information for the study of the changes that the brain undergoes in AD. We also compared these data sets to the Human Connectome Project data set, as a reference, and eventually validated externally on two cohorts of the European DTI Study in Dementia database. Results: Our analysis shows expected trends of mean conductance with respect to age and cognitive scores, significant age prediction values in aging data, and regional effects centered among subcortical regions, and cingulate and temporal cortices. Discussion: Results indicate that the conductance measure has prediction potential, especially for age, that age and cognitive scores largely overlap, and that this measure could be used to study effects such as anticorrelation in structural connections. Impact statement This work presents a methodology and a set of analyses that open new possibilities in the study of healthy and pathological aging. The methodology used here is sensitive to direct and indirect pathways in deriving brain connectivity measures from diffusion-weighted magnetic resonance imaging, and therefore provides information that many state-of-the-art methods do not account for. As a result, this technique may provide the research community with ways to detect subtle effects of healthy aging and Alzheimer's disease.
Keywords: Alzheimer's disease; aging; brain connectivity; conductance; diffusion MRI.
Conflict of interest statement
B.F. has a financial interest in CorticoMetrics, a company whose medical pursuits focus on brain imaging and measurement technologies. D.H.S. has a financial interest in Niji, a company whose medical pursuits focus on brain health technologies. B.F.'s and D.H.S.'s interests were reviewed and are managed by the Massachusetts General Hospital and Mass General Brigham in accordance with their conflict of interest policies. A.F.P., I.A., J.A., D.V., and A.Y. have no conflicts to disclose.
Figures


Similar articles
-
Early brain connectivity alterations and cognitive impairment in a rat model of Alzheimer's disease.Alzheimers Res Ther. 2018 Feb 7;10(1):16. doi: 10.1186/s13195-018-0346-2. Alzheimers Res Ther. 2018. PMID: 29415770 Free PMC article.
-
Quantification of structural brain connectivity via a conductance model.Neuroimage. 2019 Apr 1;189:485-496. doi: 10.1016/j.neuroimage.2019.01.033. Epub 2019 Jan 21. Neuroimage. 2019. PMID: 30677502 Free PMC article.
-
Structural magnetic resonance imaging for the early diagnosis of dementia due to Alzheimer's disease in people with mild cognitive impairment.Cochrane Database Syst Rev. 2020 Mar 2;3(3):CD009628. doi: 10.1002/14651858.CD009628.pub2. Cochrane Database Syst Rev. 2020. PMID: 32119112 Free PMC article.
-
The Added Value of Diffusion-Weighted MRI-Derived Structural Connectome in Evaluating Mild Cognitive Impairment: A Multi-Cohort Validation1.J Alzheimers Dis. 2018;64(1):149-169. doi: 10.3233/JAD-171048. J Alzheimers Dis. 2018. PMID: 29865049 Free PMC article.
-
A survey on applications and analysis methods of functional magnetic resonance imaging for Alzheimer's disease.J Neurosci Methods. 2019 Apr 1;317:121-140. doi: 10.1016/j.jneumeth.2018.12.012. Epub 2018 Dec 26. J Neurosci Methods. 2019. PMID: 30593787 Review.
Cited by
-
Exploratory correlation of the human structural connectome with non-MRI variables in Alzheimer's disease.Alzheimers Dement (Amst). 2023 Dec 17;15(4):e12511. doi: 10.1002/dad2.12511. eCollection 2023 Oct-Dec. Alzheimers Dement (Amst). 2023. PMID: 38111597 Free PMC article.
-
Diffusion-informed spatial smoothing of fMRI data in white matter using spectral graph filters.Neuroimage. 2021 Aug 15;237:118095. doi: 10.1016/j.neuroimage.2021.118095. Epub 2021 May 14. Neuroimage. 2021. PMID: 34000402 Free PMC article.
-
Exploratory Correlation of The Human Structural Connectome with Non-MRI Variables in Alzheimer's Disease.bioRxiv [Preprint]. 2023 Nov 9:2023.06.30.547308. doi: 10.1101/2023.06.30.547308. bioRxiv. 2023. Update in: Alzheimers Dement (Amst). 2023 Dec 17;15(4):e12511. doi: 10.1002/dad2.12511. PMID: 37461543 Free PMC article. Updated. Preprint.
-
Harmonization of Structural Brain Connectivity through Distribution Matching.bioRxiv [Preprint]. 2025 May 8:2024.09.05.611489. doi: 10.1101/2024.09.05.611489. bioRxiv. 2025. Update in: Hum Brain Mapp. 2025 Jun 15;46(9):e70257. doi: 10.1002/hbm.70257. PMID: 39314357 Free PMC article. Updated. Preprint.
-
The Effect of Aging on Brain Glucose Metabolic Connectivity Revealed by [18F]FDG PET-MR and Individual Brain Networks.Front Aging Neurosci. 2022 Feb 9;13:798410. doi: 10.3389/fnagi.2021.798410. eCollection 2021. Front Aging Neurosci. 2022. PMID: 35221983 Free PMC article.
References
-
- Aganj I, Prasad G, Srinivasan P, et al. 2014. Structural brain network augmentation via Kirchhoff's laws. In Joint Annual Meeting of ISMRM-ESMRMB, p. 2665. http://nmr.mgh.harvard.edu/~iman/ConductanceModel_ISMRM14_iman.pdf Last accessed April 30, 2021.
-
- Arendt T. 2009. Synaptic degeneration in Alzheimer's disease. Acta Neuropathol 118:167–179. - PubMed
-
- Basser P, Özarslan E. 2014. Chapter 1-Introduction to Diffusion MR. In: Johansen-Berg H, Behrens TEJ (eds.) Diffusion MRI (Second Edition). Cambridge, MA: Academic Press. pp. 3–9.
Publication types
MeSH terms
Grants and funding
- P41 EB027061/EB/NIBIB NIH HHS/United States
- R21 EB018907/EB/NIBIB NIH HHS/United States
- R01 AG016495/AG/NIA NIH HHS/United States
- R56 AG068261/AG/NIA NIH HHS/United States
- R21 DK108277/DK/NIDDK NIH HHS/United States
- U01 AG024904/AG/NIA NIH HHS/United States
- R01 EB021265/EB/NIBIB NIH HHS/United States
- R01 NS052585/NS/NINDS NIH HHS/United States
- R01 AG008122/AG/NIA NIH HHS/United States
- RC1 AT005728/AT/NCCIH NIH HHS/United States
- R01 EB019956/EB/NIBIB NIH HHS/United States
- R56 AG064027/AG/NIA NIH HHS/United States
- R01 EB006758/EB/NIBIB NIH HHS/United States
- U01 MH093765/MH/NIMH NIH HHS/United States
- R01 NS070963/NS/NINDS NIH HHS/United States
- U01 NS086625/NS/NINDS NIH HHS/United States
- S10 RR019307/RR/NCRR NIH HHS/United States
- P01 AG003991/AG/NIA NIH HHS/United States
- U19 AG024904/AG/NIA NIH HHS/United States
- R01 NS105820/NS/NINDS NIH HHS/United States
- P30 AG066546/AG/NIA NIH HHS/United States
- RF1 AG068261/AG/NIA NIH HHS/United States
- U01 MH117023/MH/NIMH NIH HHS/United States
- R21 NS072652/NS/NINDS NIH HHS/United States
- S10 RR023043/RR/NCRR NIH HHS/United States
- K01 DK101631/DK/NIDDK NIH HHS/United States
- P41 EB015896/EB/NIBIB NIH HHS/United States
- R01 NS083534/NS/NINDS NIH HHS/United States
- S10 RR023401/RR/NCRR NIH HHS/United States
- R01 AG022381/AG/NIA NIH HHS/United States
- R01 AG050595/AG/NIA NIH HHS/United States
LinkOut - more resources
Full Text Sources
Other Literature Sources
Medical
Research Materials

