. 2021 Aug 2;220(8):e202008062.
doi: 10.1083/jcb.202008062. Epub 2021 May 27.

Cell influx and contractile actomyosin force drive mammary bud growth and invagination

Affiliations

Cell influx and contractile actomyosin force drive mammary bud growth and invagination

Ewelina Trela et al. J Cell Biol. .

Abstract

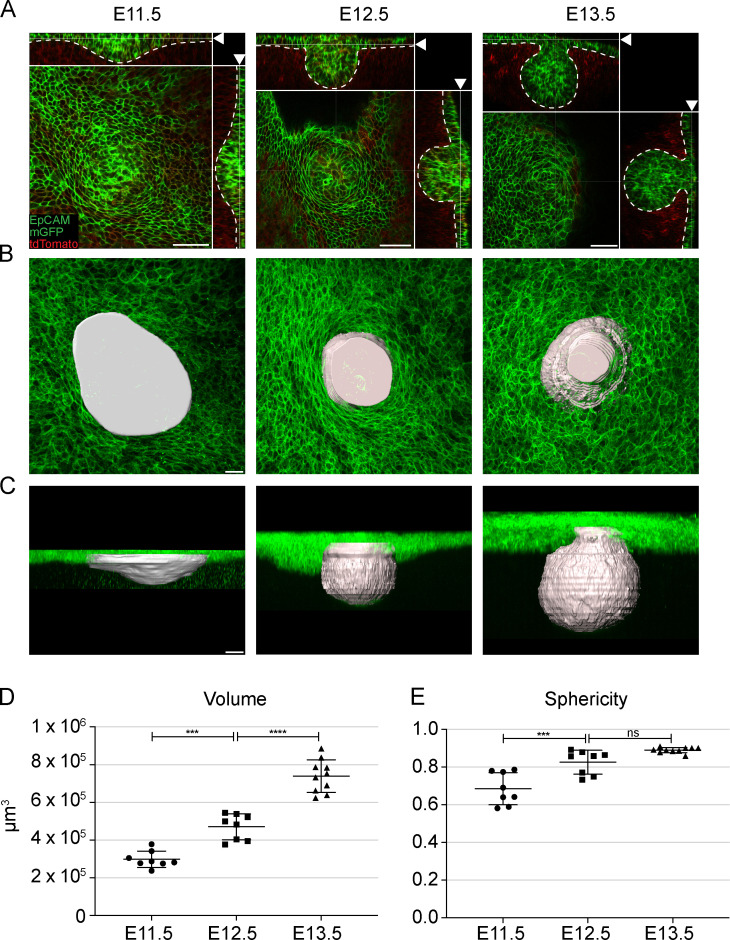
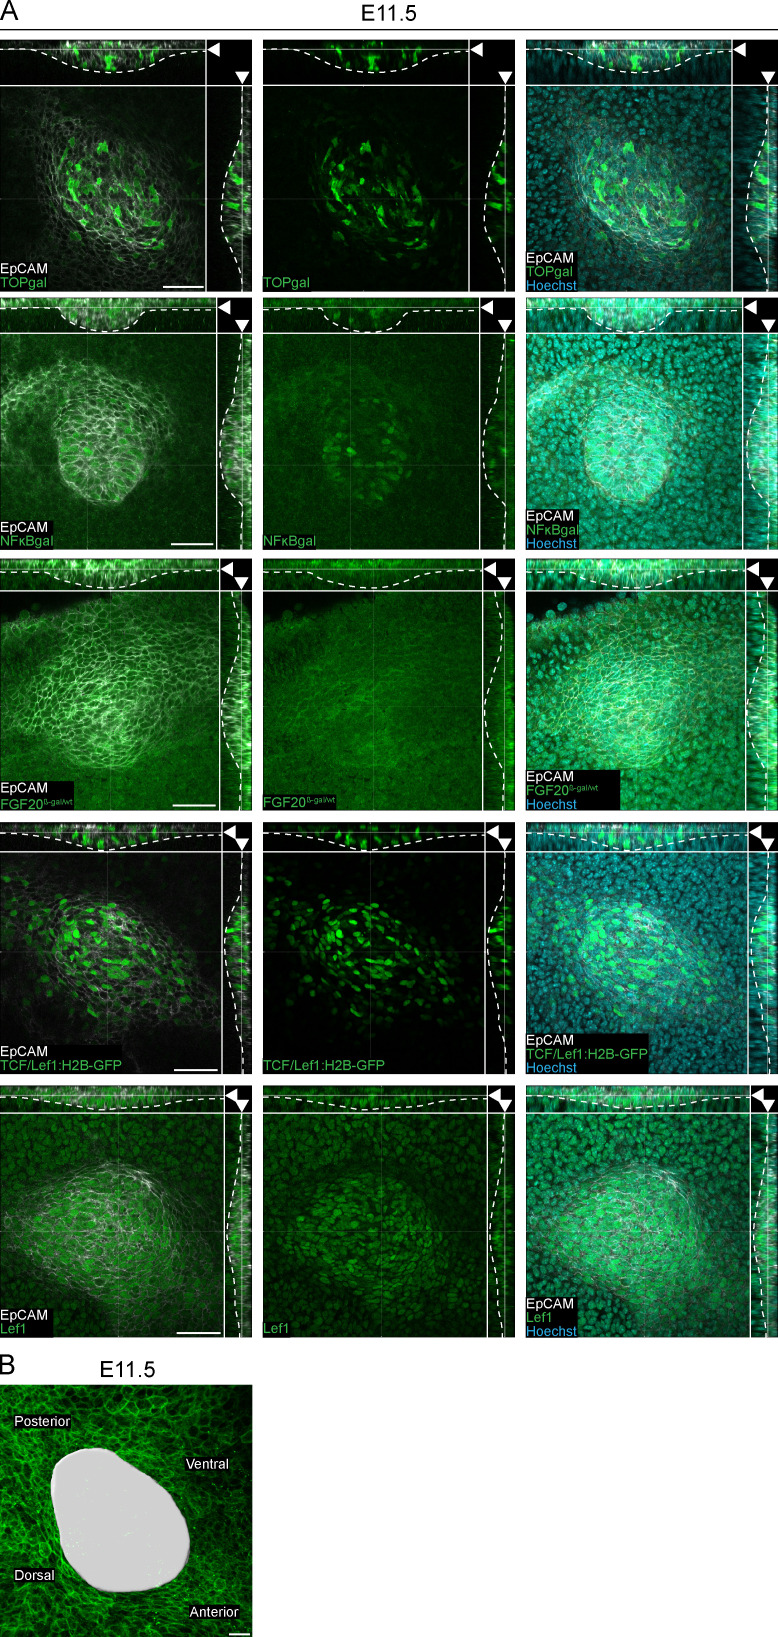
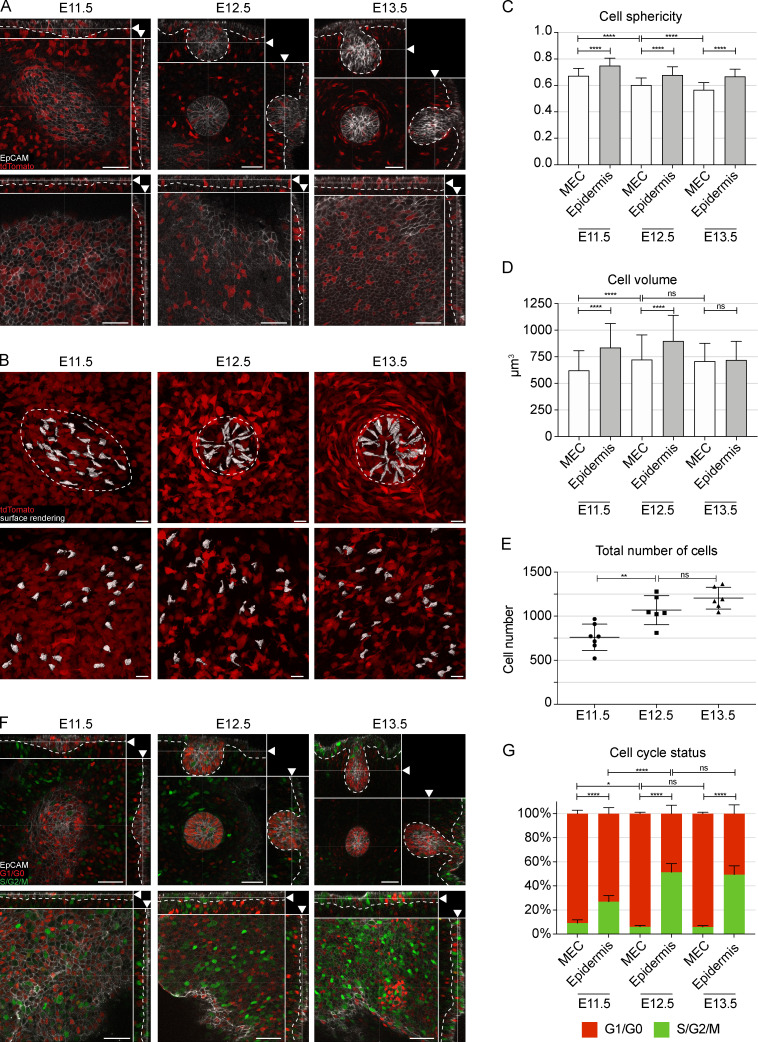
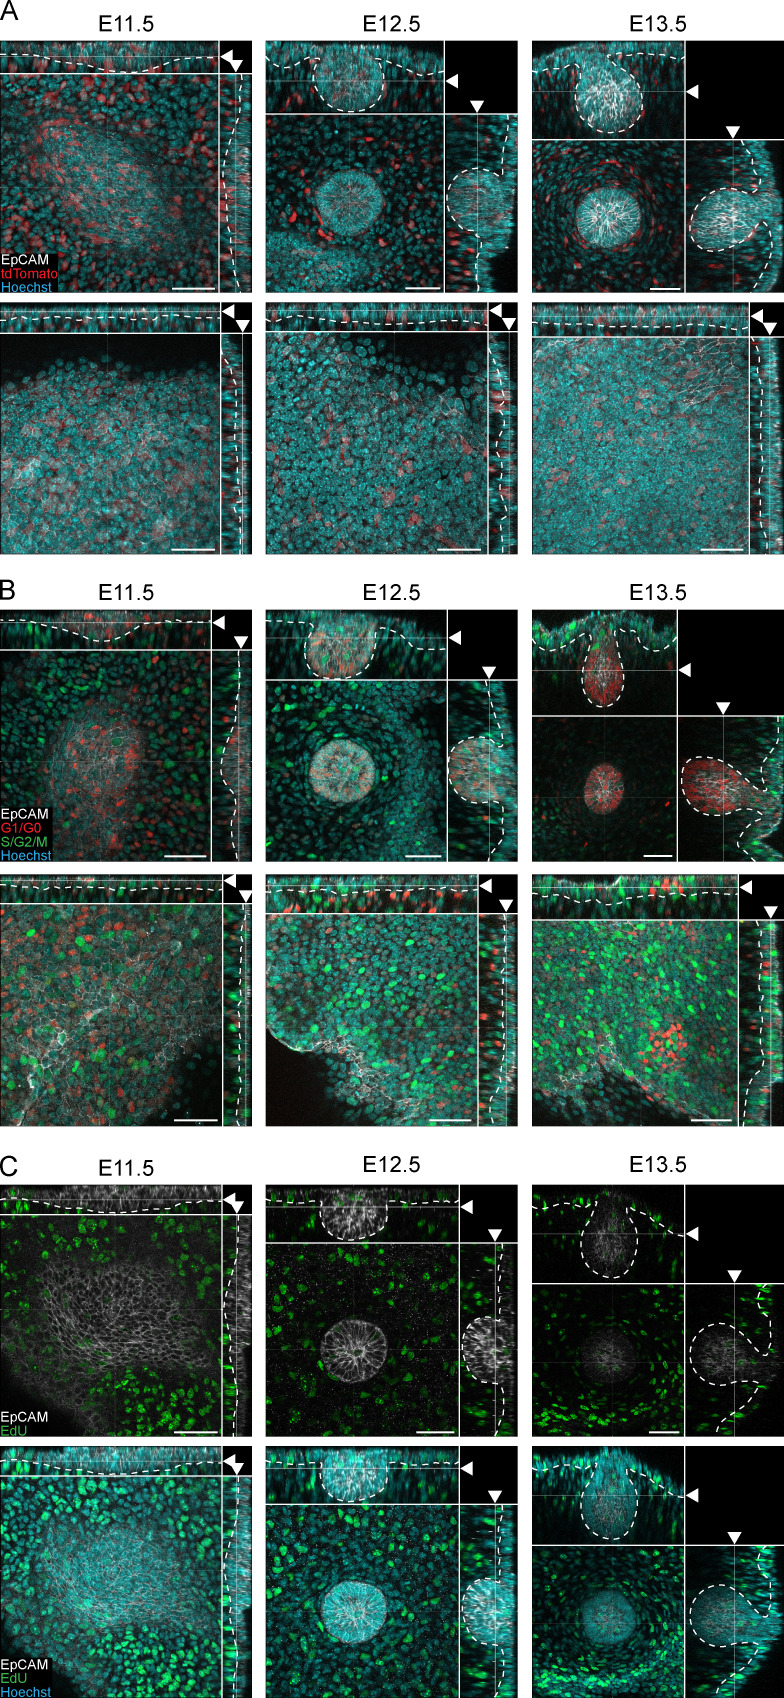
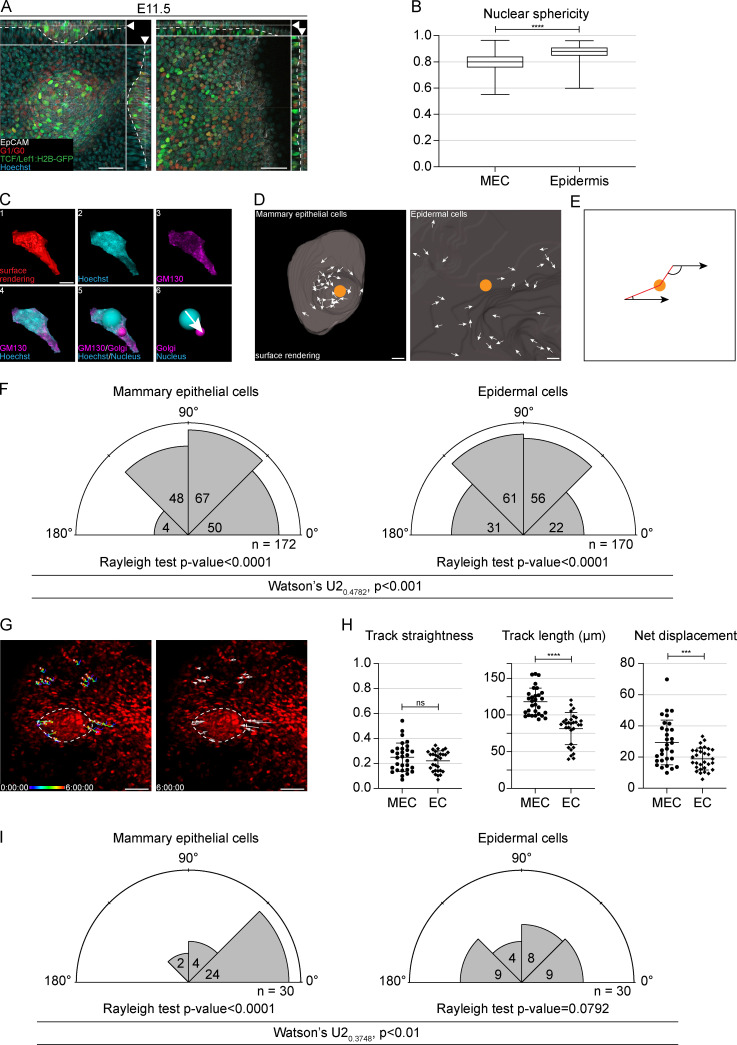
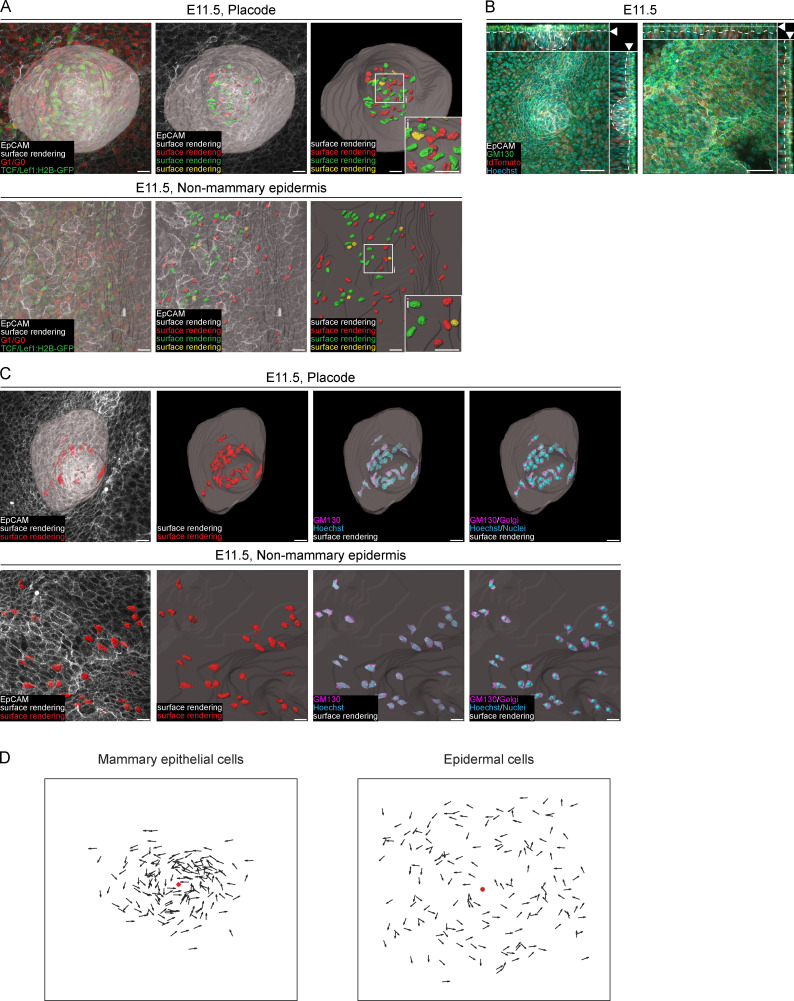
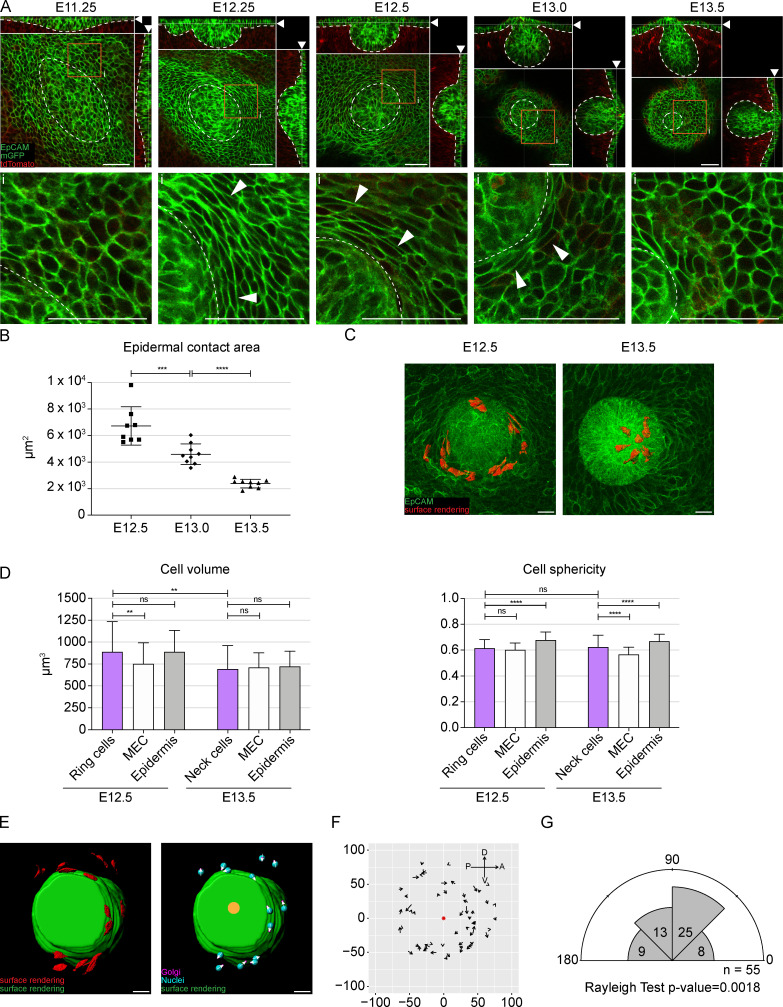
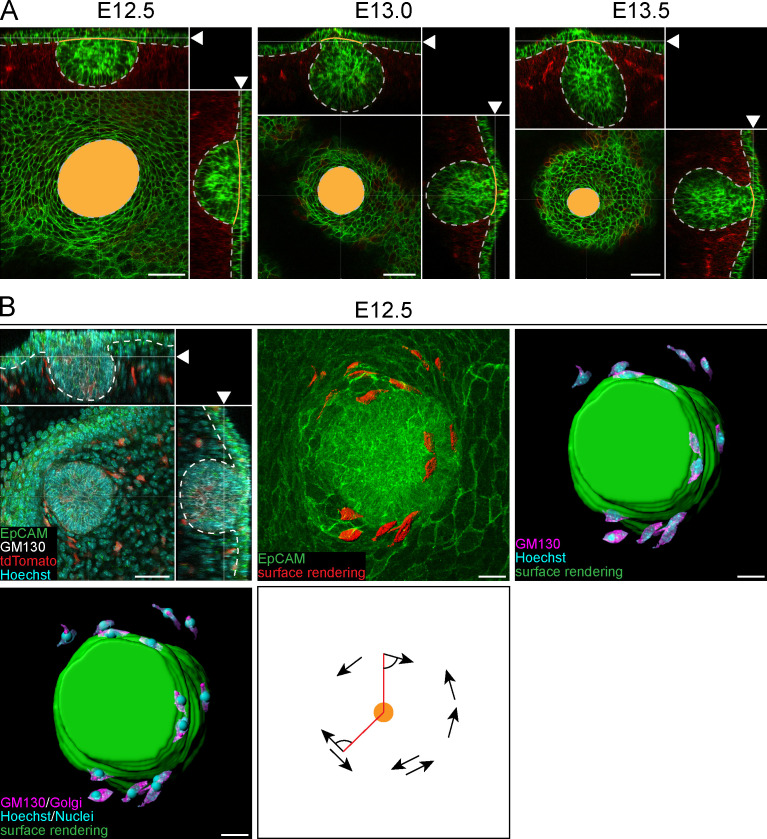
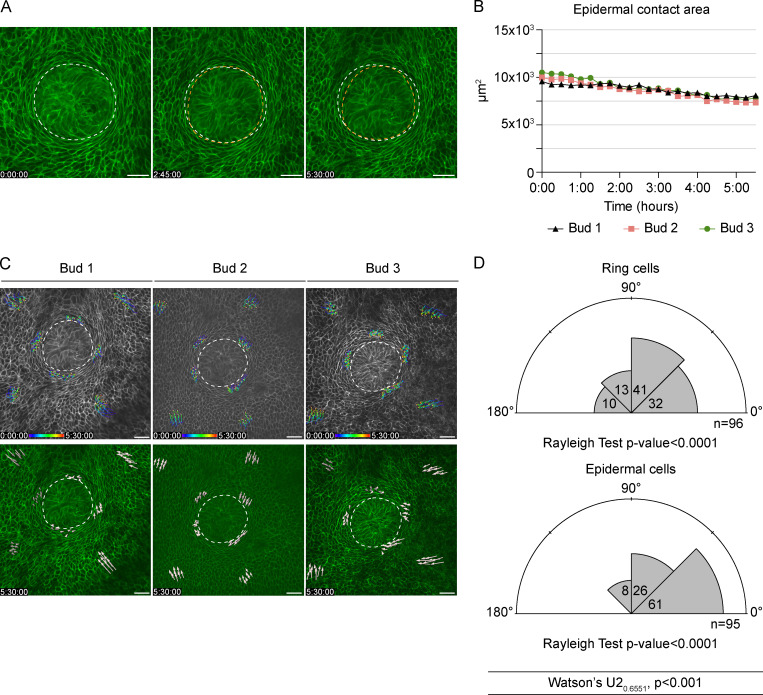
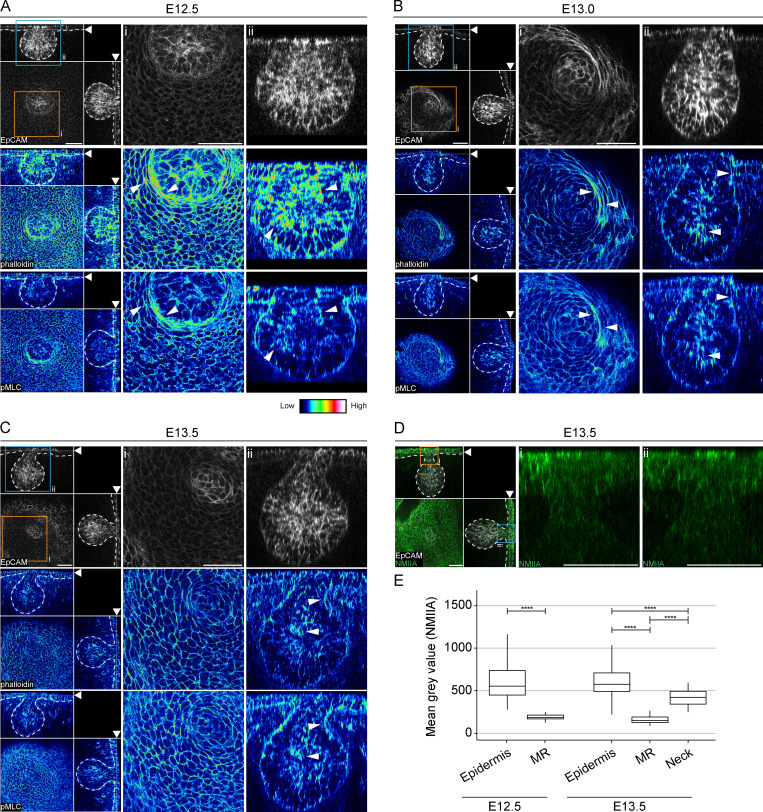
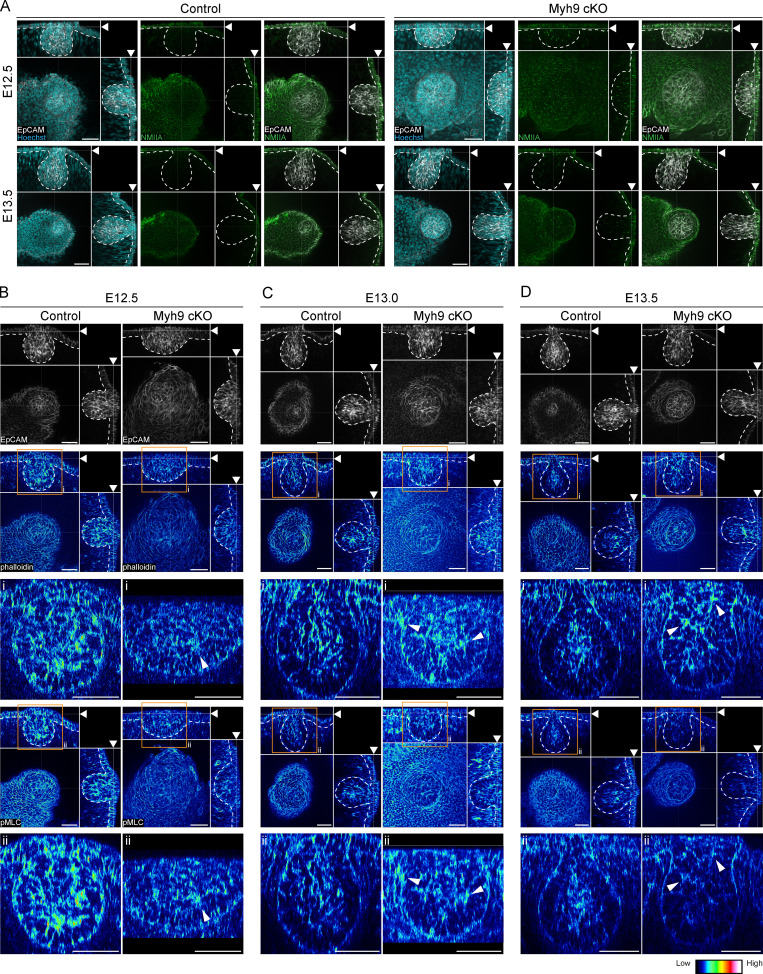
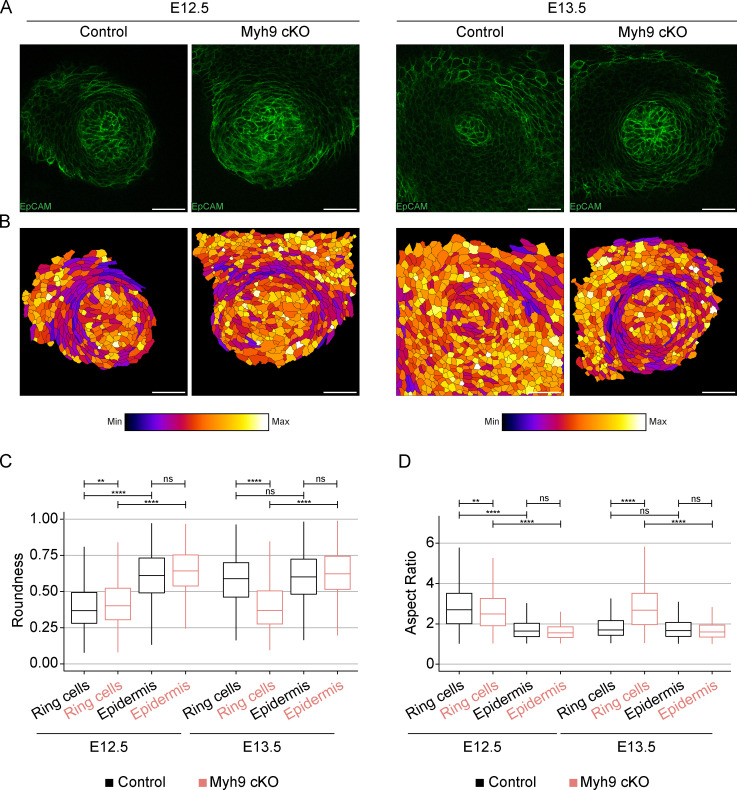
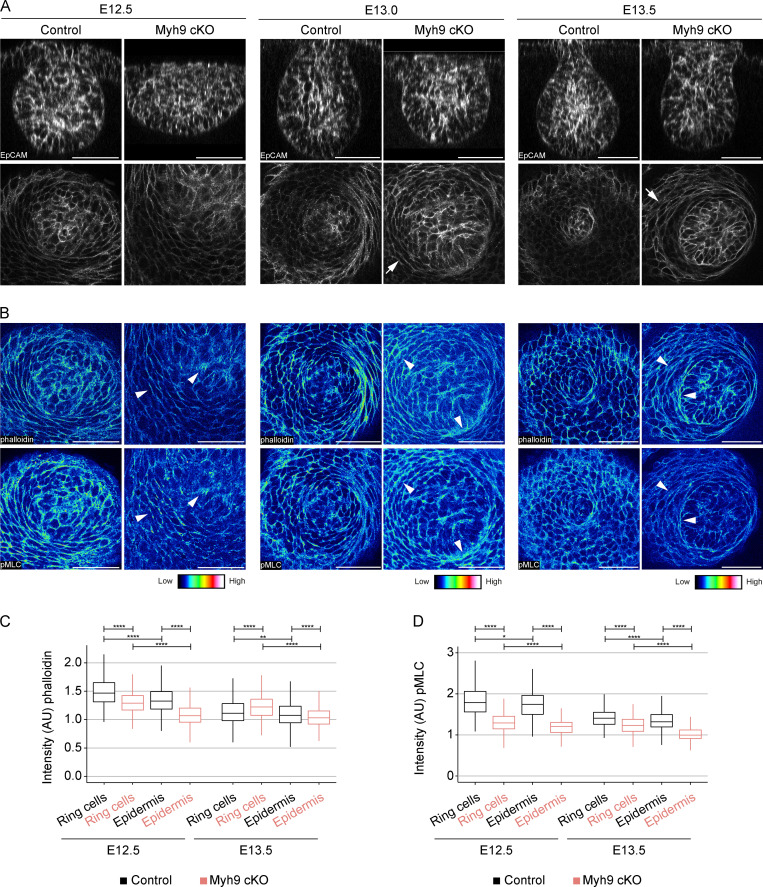
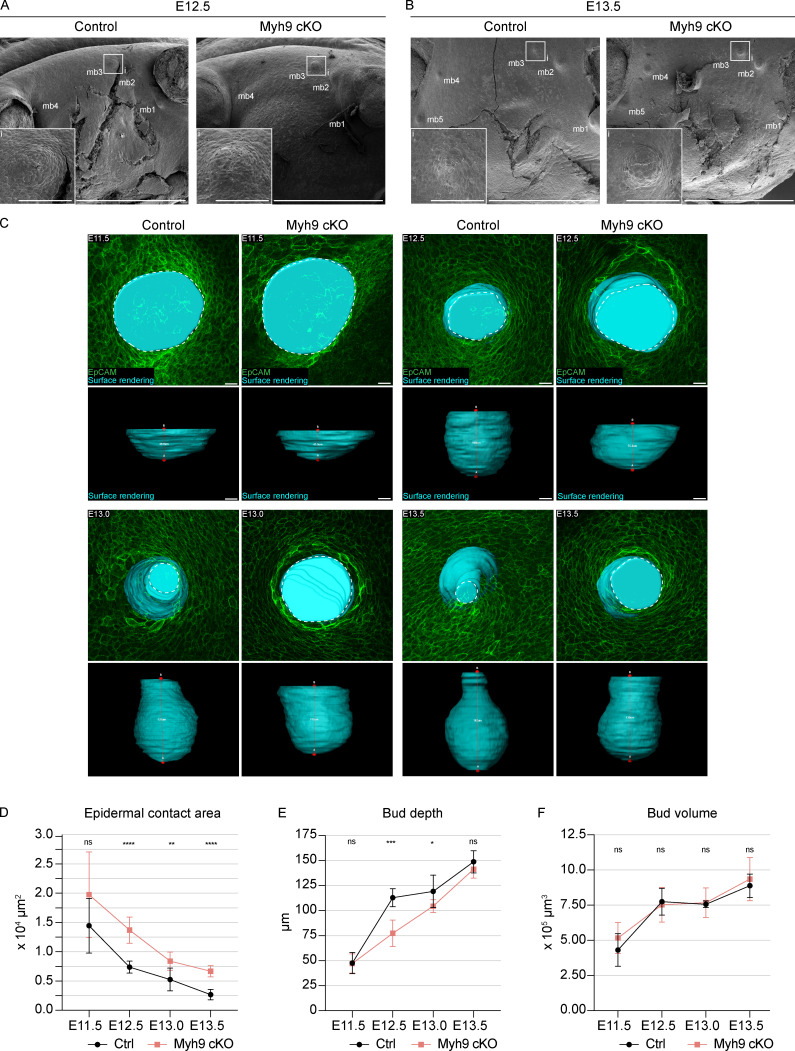
The mammary gland develops from the surface ectoderm during embryogenesis and proceeds through morphological phases defined as placode, hillock, bud, and bulb stages followed by branching morphogenesis. During this early morphogenesis, the mammary bud undergoes an invagination process where the thickened bud initially protrudes above the surface epithelium and then transforms to a bulb and sinks into the underlying mesenchyme. The signaling pathways regulating the early morphogenetic steps have been identified to some extent, but the underlying cellular mechanisms remain ill defined. Here, we use 3D and 4D confocal microscopy to show that the early growth of the mammary rudiment is accomplished by migration-driven cell influx, with minor contributions of cell hypertrophy and proliferation. We delineate a hitherto undescribed invagination mechanism driven by thin, elongated keratinocytes-ring cells-that form a contractile rim around the mammary bud and likely exert force via the actomyosin network. Furthermore, we show that conditional deletion of nonmuscle myosin IIA (NMIIA) impairs invagination, resulting in abnormal mammary bud shape.


Figures

Figure 1.
Figure 1.
Growth of the mammary rudiment during early developmental stages. (A) Optical sections (planar and sagittal views; arrowhead indicates section plane) of confocal microscopy images from K14-Cre/mTmG mouse mammary rudiments at placode (E11.5), hillock (E12.5), and bulb (E13.5) stages; epithelium in green (membrane-bound GFP and EpCAM) and mesenchyme in red. Dashed line marks the epithelial-mesenchymal border. Scale bar, 50 µm. (B and C) Planar and sagittal views of maximum intensity projections of epithelial tissue; rendered surfaces of mammary rudiments in white. Scale bar, 20 µm. (D and E) Quantification of volume (D) and sphericity (E) of mammary rudiments using rendered surfaces. One-way ANOVA with Šidák’s post hoc comparison; ***, P ≤ 0.001; ****, P ≤ 0.0001; nE11.5 = 8; nE12.5 = 8; nE13.5 = 10. Data are presented as mean ± SD.
Figure S1.
Figure S1.
Expression of mammary fate markers at placode stage. (A) Planar and sagittal views of confocal whole-mount images of samples from TOP-gal, NF-κB-gal, FGF20β-gal/wt, and TCF/Lef1:H2B-GFP reporter mouse models or wild-type mouse at E11.5 (arrowhead indicates section plane). Expression of β-galactosidase or Lef1 was detected by the immunofluorescent staining (green) in the β-gal reporter or wild-type samples, respectively. All samples were stained with epithelial marker EpCAM (white) and nuclear marker Hoechst (cyan). Dashed line marks the epithelial-mesenchymal border. Scale bar, 50 µm. (B) Planar view showing maximum intensity projections of epithelial tissue (K14-Cre; mTmG) at E11.5. Surface rendering (white) of mammary placode 3 in respect to body axes. Scale bar, 20 µm.
Figure 2.
Figure 2.
Mammary rudiments are characterized by low level of cell proliferation. (A) Optical sections (planar and sagittal views; arrowhead indicates section plane) of confocal microscopy images from R26-CreERT/tdTomato mouse embryos at placode (E11.5), hillock (E12.5), and bulb (E13.5) stages stained with EpCAM (white). Cells were sparsely labeled (cytoplasmic tdTomato, red) with low dosage of tamoxifen 24 h earlier. Scale bar, 50 µm. Dashed line marks the epithelial-mesenchymal border. (B) Planar views of maximum intensity projections of tdTomato-expressing epithelial cells. Cell surface rendering was performed on randomly selected cells (white); dashed line marks the border of the mammary rudiment. Scale bar, 20 µm. (C and D) Quantification of cell sphericity (C) and volume (D) at E11.5, E12.5, and E13.5 (six biological replicates for each stage). nE11.5 = 172 MECs and 170 epidermal cells; nE12.5 = 142 MECs and 136 epidermal cells; nE13.5 = 175 MECs and 175 epidermal cells. (E) Quantification of the total cell number in the mammary rudiment (nE11.5 = 7; nE12.5 = 6; nE13.5 = 6). (F) Optical sections (planar and sagittal views; arrowhead indicates section plane) of confocal images of mammary rudiments from Fucci embryos stained with EpCAM (white); nuclei in G1/G0 in red and in S/G2/M in green. Scale bar, 50 µm. Dashed line marks the epithelial-mesenchymal border. (G) Quantification of the proportions of cells in G1/G0 and S/G2/M in MECs and epidermis (nE11.5 = 7; nE12.5 = 6; nE13.5 = 6). Statistical significances were calculated by Student’s t test to compare mammary rudiment and epidermis at the same developmental stage or one-way ANOVA with Šidák’s post hoc comparison to compare mammary rudiments from three developmental stages. *, P ≤ 0.05; **, P ≤ 0.01; ****, P ≤ 0.0001. Data are shown as mean ± SD.
Figure S2.
Figure S2.
Analysis of cell size and proliferation in early mammary morphogenesis. (A) Optical sections (planar and sagittal views) of confocal microscopy images from sparsely labeled R26-CreERT/tdTomato reporter embryos at placode (E11.5), hillock (E12.5), and bulb (E13.5) stages showing cytoplasmic expression of the reporter (tdTomato, red). Samples were stained with epithelial marker EpCAM (white) and nuclear marker Hoechst (cyan). (B) Optical sections (planar and sagittal views) of confocal images from transgenic Fucci cell cycle mouse model at placode (E11.5), hillock (E12.5), and bulb (E13.5) stages. Epithelial cells and nuclei have been stained with EpCAM (white) and Hoechst (cyan), respectively. The majority of the MECs are nonproliferative (G1/G0 phase, red), and only rare proliferative cells (S/G2/M phases, green) could be observed in the mammary bud. (C) Optical sections (planar and sagittal views) of confocal images of the mammary gland area from wild-type embryos at mammary gland placode (E11.5), hillock (E12.5), and bulb (E13.5) stages. Embryos were collected 2 h after EdU injection followed by whole-mount staining of EdU (S phase, green), epithelial marker EpCAM (white), and nuclear marker Hoechst (cyan). (A–C) Dashed line marks the epithelial-mesenchymal border, and arrowheads indicate the plane of the optical section. Scale bar, 50 µm.
Figure 3.
Figure 3.
Cell influx drives mammary placode formation. (A) Optical section (planar and sagittal views; arrowhead shows section plane) of a mammary placode (left) and nonmammary epidermis (right) from E11.5 Fucci, mKO2;TCF/Lef1:H2B-GFP embryos. Cells in G1/G0 express nuclear mKO2 (red), while Wnt reporter active cells express nuclear GFP (green); Hoechst staining for nuclei (cyan) and EpCAM for epithelial cells (white). Dashed line marks the epithelial-mesenchymal border. Scale bar, 50 µm. (B) Quantification of nuclear sphericity of MECs and epidermal cells at E11.5. Student’s t test; ****, P ≤ 0.0001; n = 652 MECs and 882 epidermal cells from 14 biological replicates. Data shown represent median (line) with 25th and 75th percentiles (hinges) plus min to max ranges (whiskers). (C) Cells in E11.5 R26-CreERT/tdTomato embryos were sparsely labeled by low dosage of tamoxifen 24 h earlier and stained with EpCAM (white), GM130 (magenta), and Hoechst (cyan) to mark epithelial cells, Golgi, and nuclei, respectively. Figure shows planar views of a representative masked single cell (1–6) to define cell polarity. The surface-rendered cell (red; 1), nucleus (cyan; 2), Golgi (magenta; 3), overlay of both nucleus and Golgi (4), overlay of nucleus (cyan) and Golgi (magenta) with reference points for both (5), and cell vector (white arrow) from nuclear reference point (cyan) to Golgi reference point (magenta) (6). Scale bar, 5 µm. (D) Cell vectors (white arrows) show the polarity of MECs and epidermal cells at E11.5. Center of the placode or the control epidermal region is indicated by the orange spot. Scale bar, 20 µm. (E) Schematic image showing two examples of the angle between the cell vector and center of the placode (orange spot). (F) Rose plots showing the angles between cell vectors and the center of a mammary placode or image center of a corresponding epidermal region. Rayleigh test for nonuniformity, H0 = random. Watson’s U2 test revealed a significant difference between MEC and epidermal cell plots. n = 172 MECs and 170 epidermal cells from six biological replicates. (G) Confocal time-lapse 3D imaging of a forming mammary placode. Images show tracks of representative individual MECs and epidermal cells expressing Fucci, mKO transgene (nuclear red) on the left and track direction (arrows) on the right. Dashed line demarcates the mammary placode. Scale bar, 50 µm. See also Video 1. (H) Quantification of track straightness, length, and net displacement of MECs (n = 30) and epidermal cells (EC, n = 30) from three biological replicates. Statistical significance was tested with Mann-Whitney U test and Student’s t test; ***, P ≤ 0.001; ****, P ≤ 0.0001. (I) Rose plots of the escape angles (the angle between cell trajectories at the beginning and end of the time lapse with respect to the center of the placode or a corresponding epidermal region). Rayleigh test for nonuniformity, H0 = random. Watson’s U2 test revealed a significant difference between mammary placode cell and epidermal cell plots.
Figure S3.
Figure S3.
Analysis of nuclear shape and cell polarity in forming mammary placodes. (A) Representative images showing surface rendering of randomly selected nuclei based on the expression of nuclear mKO2 (G1/G0 marker of the Fucci cell cycle reporter, red) and nuclear GFP (TCF/Lef:H2B-GFP Wnt reporter, green) in a mammary placode (left) and epidermis (right) at E11.5; double positive mKO2 and GFP nuclei in yellow. Epithelial cells were stained with EpCAM (white). Gray area in the upper picture delineates the placode. Insets are close-ups of the indicated areas. Scale bar, 20 µm. (B) Optical sections (planar and sagittal views; arrowheads indicate the section plane) of confocal microscopy images from E11.5 R26-CreERT/tdTomato mouse embryos. Cells were sparsely labeled with low dosage of tamoxifen 24 h before to induce the expression of cytoplasmic tdTomato (red). The cells were stained with EpCAM (white), GM130 (green), and Hoechst (cyan) to mark epithelial cells, Golgi, and nuclei, respectively. Dashed line marks the epithelial-mesenchymal border. Scale bar, 50 µm. (C) Planar views of representative images showing the process of creating reference points using nuclear marker (Hoechst, cyan) and Golgi marker (GM130, green) of mammary placode (upper panel) and epidermis (lower panel) at mammary placode stage (E11.5) that are required for cell angle analysis shown in Fig. 3, C–F. Epithelial cells are further stained with EpCAM (white). First column shows overlay of maximum intensity projection of confocal image and surface rendering of randomly selected cells expressing tdTomato (from R26-CreERT/tdTomato, red). Second column shows surface rendering (white) of mammary placode or epidermis together with surface rendering of randomly selected tdTomato+ epithelial cells (red). Third column shows the nucleus (cyan) and GM130 (Golgi marker, magenta) staining in masked tdTomato+ epithelial cells from the mammary placode and epidermis. Fourth column shows surface rendering of the mammary placode and epidermis with reference points for nuclei (Hoechst, cyan; reference point, cyan) and Golgi marker (GM130, magenta; reference point, magenta) in masked tdTomato+ epithelial cells from the mammary placode and epidermis. Scale bar, 20 µm. (D) Summary of all the relative cell orientations in 2D of MECs (left, n = 172 from six biological replicates) and epidermal cells (right, n = 170 from six biological replicates) at E11.5. Each arrow represents one cell. Red star marks the mammary placode center (left) or image center of the epidermis (right).
Figure 4.
Figure 4.
A rim of thin keratinocytes encircles the invaginating mammary bud. (A) Optical sections (planar and sagittal views; arrowheads show the section plane) of confocal whole-mount microscopy images from K14-Cre/mTmG mouse mammary primordia at placode (E11.25), hillock (E12.25 and E12.5), bud (E13.0), and bulb (E13.5) stages; epithelium in green (cell-membrane localized GFP and EpCAM staining) and mesenchyme in red. Dashed line marks the epithelial-mesenchymal border. Lower panel: inserts (i) are close-ups of planar views marked in orange boxes in the upper panel. Arrowheads indicate ring cells. Scale bar, 50 µm. (B) Quantification of epidermal contact area of the mammary rudiment. One-way ANOVA with Šidák’s post hoc comparison; ***, P ≤ 0.001; ****, P ≤ 0.0001; nE12.5 = 8; nE13.0 = 9; nE13.5 = 9. Data are shown as mean ± SD. (C) Planar views of maximum intensity projections showing epithelial tissue (cell-membrane localized GFP) at E12.5 and E13.5. Surface rendering of the keratinocytes (ring cells, red) surrounding the mammary bud at E12.5 and cells in the neck at E13.5. Scale bar, 20 µm. See also Video 2. (D) Quantification of the volume and sphericity of mammary epithelial, ring, neck, and epidermal cells (EC) before (E12.5) and after (E13.5) invagination; six biological replicates for both stages. nE12.5 ring = 86 ring cells, 142 MECs, and 136 ECs; nE13.5 = 38 neck cells, 175 MECs, and 175 ECs. Data are shown as mean ± SD. Statistical significance was calculated by Student’s t test to compare ring and neck cells or one-way ANOVA with Šidák’s post hoc comparison or Kruskal-Wallis test to compare ring cells, MECs, and ECs at the same developmental stage; **, P ≤ 0.01; ****, P ≤ 0.0001. (E) Planar views of surface rendering of ring cells (red) and mammary bud (green) at the hillock (E12.5) stage. Cell vectors (white arrowheads) show the polarity of ring cells as defined by the nucleus (cyan) to Golgi (magenta) vector. Orange spot marks the center of the bud’s top surface. Scale bar, 20 µm. (F) Coordinate system showing ring cells’ vectors (arrows) and their opposing directionality at E12.5. Red dot marks the center of the hillock’s top domain. A, anterior; D, dorsal; P, posterior; V, central (nE12.5 = 55 ring cells from four biological replicates). (G) Rose plot representing the angles between the cell vector and the center of mammary bud’s top domain. Rayleigh test for nonuniformity, H0 = random.
Figure S4.
Figure S4.
A rim of thin keratinocytes forms around the invaginating mammary rudiment. (A) Optical sections (planar and sagittal views; arrowheads indicate the section plane) of a confocal image from K14-Cre/mTmG mouse embryos at hillock (E12.5), bud (E13.0), and bulb (E13.5) stages. Epithelial tissue labeled with membrane-bound GFP and epithelial marker EpCAM (green). Mesenchymal tissue labeled with membrane-bound tdTomato (red). Yellow area in the planar and yellow line in the sagittal views show how epidermal contact area was defined. Dashed line marks epithelial-mesenchymal border. Scale bar, 50 µm. (B) Representative images showing the procedure determining the relative orientation of ring cells at the mammary hillock (E12.5) stage from R26-CreERT/tdTomato embryos. Upper left: Optical section (planar and sagittal views; arrowheads indicate the section plane) of the confocal image of the sparsely labeled tdTomato+ (red) cells with epithelial marker EpCAM (green), Golgi marker GM130 (white), and Hoechst (cyan). Dashed line marks epithelial-mesenchymal border. Scale bar, 50 µm. Upper middle: Planar view of the maximum intensity projection showing epithelial cells (EpCAM, green) and surface rendering of randomly selected tdTomato+ ring cells (red). Scale bar, 20 mm. Upper right: Planar view of surface rendering of the mammary primordium (green) and the staining for nuclei (Hoechst, cyan) and Golgi (GM130, magenta) in masked ring cells. Scale bar, 20 mm. Lower left: Planar view of the surface rendering of the mammary primordium (green) with reference points for nuclei (Hoechst, cyan) and Golgi marker (GM130, magenta) in masked tdTomato+ ring cells. Scale bar, 20 µm. Lower right: An example of the relative angles between cell vector (black arrow) and center of the bud’s top domain (red line toward orange dot).
Figure 5.
Figure 5.
Confocal time-lapse 3D imaging of ring cells at E12.5. (A) A representative mammary bud from a K14-Cre/mTmG embryo at the beginning, at 2 h 45 min, and at the end of the imaging (5 h 30 min). White and orange dashed line mark the perimeter of the invaginating mammary bud in the beginning and at the indicated time point, respectively. Scale bar, 30 µm. (B) Quantification of the epidermal contact area of individual mammary buds during imaging. (C) Individual ring and epidermal cell tracks in three mammary buds. Dashed line marks the perimeter of the invaginating mammary bud. Scale bar, 30 µm. See also Video 3. (D) Rose plots of the escape angles (the angle between cell trajectories at the beginning and end of the time lapse in respect to the center of the mammary bud). Rayleigh test for nonuniformity, H0 = random; n = 96 ring cells and 95 epidermal cells from three biological replicates. Statistical significance was assessed with Watson’s U2 test.
Figure 6.
Figure 6.
Ring cells display high actomyosin contractility. (A–C) Optical sections (planar and sagittal views; arrowheads indicate the section plane) of confocal images from wild-type embryos labeled with epithelial marker EpCAM (white), F-actin (phalloidin, represented in LUT, middle panel), and pMLC, represented in LUT, lower panel) at hillock (E12.5; A), bud (E13.0; B), and bulb (E13.5; C) stages. Scale bar, 50 µm. Dashed line marks the epithelial-mesenchymal border. Arrowheads highlight high-intensity levels, i and ii (insert). Scale bar, 50 µm. (D) Optical sections (planar and sagittal views; arrowheads indicate the section plane) of confocal images from a wild-type embryo stained with EpCAM (white) and NMIIA (green) at the bulb (E13.5) stage. Dashed line marks the epithelial-mesenchymal border. Inserts (i and ii) are close-ups of sagittal views marked in orange and blue boxes. Scale bar, 50 µm. (E) Quantification of NMIIA intensities in cells of the epidermis (EC), mammary rudiment (MR), and neck region from five different embryos per stage (nE12.5 EC = 1,292; nE12.5 MR = 485; nE13.5 EC = 1,889; nE13.5 MR = 533; and nE13.5 Neck = 119). Data shown represent the median (line) with 25th and 75th percentiles (hinges) plus 1.5× interquartile ranges (whiskers). Statistical significance was assessed with the Mann-Whitney U test with Bonferroni correction. ****, P ≤ 0.0001.
Figure S5.
Figure S5.
Expression of NMIIA, F-actin, and pMLC in control and Myh9 deficient embryos. (A) Optical sections (planar and sagittal views) of confocal images from Myh9 cKO embryos and their control littermates stained with NMIIA (green) at hillock (E12.5) and bulb (E13.5) stages. Epithelium was stained with EpCAM (white) and nuclei with Hoechst (cyan). Dashed line marks the epithelial-mesenchymal border, and arrowheads mark the plane of optical section. Scale bar, 50 µm. (B–D) Optical sections (planar and sagittal views) of confocal images from Myh9 cKO and control littermate embryos stained with epithelial marker (EpCAM, white in the upper panel), F-actin (phalloidin, represented in LUT depicted in the middle panel), pMLC (represented in LUT depicted in the lower panel) at hillock (E12.5; B), bud (E13.0; C), and bulb (E13.5; D) stages. Scale bar, 50 µm. Dashed line marks the epithelial-mesenchymal border, and arrowheads mark the plane of the optical section. i and ii are close-ups of the regions indicated by orange boxes.
Figure 7.
Figure 7.
Epithelial NMIIA deficiency leads to persistence of the contractile epidermal ring. (A) Optical sections (planar views) of confocal images of representative Myh9 cKO and control littermate embryos labeled with EpCAM (green) at hillock (E12.5) and bulb (E13.5) stages. Scale bar, 50 µm. (B) Heatmap of cell roundness in the planar images shown in A. (C and D) Quantification of cell roundness (C) and aspect ratio (D) of cells adjacent to the bud (0–30 µm ∼ ring cells) and those farther away from the bud (70–100 µm, control epidermal cells [EC]) in 6 or 7 control and 7–11 Myh9 cKO embryos per stage (Control: nE12.5 Ring cells = 931, nE12.5 EC = 448, nE13.5 Ring cells = 697, nE13.5 EC= 921; Myh9 cKO: nE12.5 Ring cells = 886, nE12.5 EC = 219, nE13.5 Ring cells = 1,174, nE13.5 EC = 1,201). Data shown represent median (line) with 25th and 75th percentiles (hinges) plus 1.5× interquartile ranges (whiskers). Statistical significance was assessed with the Mann-Whitney U test with Bonferroni correction. **, P ≤ 0.01; ****, P ≤ 0.0001.
Figure 8.
Figure 8.
Epithelial NMIIA deficiency impairs ring cell function. (A and B) Optical sections (planar and sagittal views) of confocal images from Myh9 cKO and control littermate embryos labeled with EpCAM (white; A), F-actin (phalloidin, represented in LUT depicted in the middle panel), and pMLC (represented in LUT depicted in the right panel) (B) at hillock (E12.5), bud (E13.0), and bulb (E13.5) stages. Scale bar, 50 µm. Arrowheads mark the increased intensity. Arrows mark ring cells still present at E13.0. (C and D) Quantification of F-actin (C) and pMLC (D) intensity in ring cells (0–30 µm from the bud) and epidermal cells (EC; 70–100 µm away from the bud) of four to seven control and four to six Myh9 cKO embryos per stage (Controls: nE12.5 Ring cells = 621, nE12.5 EC = 252, nE13.5 Ring cells = 648, nE13.5 EC= 787; Myh9 cKO: nE12.5 Ring cells = 568, nE12.5 EC = 108, nE13.5 Ring cells = 495, nE13.5 EC = 652). Data shown represent median (line) with 25th and 75th percentiles (hinges) plus 1.5× interquartile ranges (whiskers). Statistical significance within each stage was assessed with the Mann-Whitney U test with Bonferroni correction. AU, arbitrary units. *, P ≤ 0.05; **, P ≤ 0.01; ****, P ≤ 0.0001.
Figure 9.
Figure 9.
Impaired invagination and neck formation in Myh9 cKO embryos.(A and B) Scanning electron microscopy images of Myh9 cKO embryos and control littermates at E12.5 (A) and E13.5 (B) with close-ups of mammary primordium 3. Scale bar, 1 mm. i, insert; scale bar, 100 µm. mb, mammary bud. (C) Planar and sagittal views of maximum intensity projections showing surface rendering (cyan) of mammary rudiments of Myh9 cKO embryos and control littermates at E11.5, E12.5, E13.0, and E13.5. Dashed line marks the epidermal contact area. Red line connects top and bottom domains of mammary primordium showing the depth of the rudiment. Scale bar, 20 µm. See also Video 4. (D–F) Quantification of epidermal contact area (D), bud depth (E), and bud volume (F). Statistical significances were calculated with Student’s t test to controls and Myh9 cKO embryos at each developmental stage. nE11.5 = 6 (Ctrl) and 7 (Myh9 cKO), nE12.5 = 6 (Ctrl) and 7 (Myh9 cKO), nE13.0 = 10 (Ctrl) and 8 (Myh9 cKO), nE13.5 = 8 (Ctrl) and 13 (Myh9 cKO). Data are shown as mean ± SD. *, P ≤ 0.05; **, P ≤ 0.01; ***, P ≤ 0.001; ****, P ≤ 0.0001.

Similar articles

Cited by

References

    1. Agostinelli, C., and Lund U.. 2017. R package ‘circular’: Circular Statistics (version 0.4-93). https://r-forge.r-project.org/projects/circular/ (accessed March 13, 2021)
    1. Ahtiainen, L., Lefebvre S., Lindfors P.H., Renvoisé E., Shirokova V., Vartiainen M.K., Thesleff I., and Mikkola M.L.. 2014. Directional cell migration, but not proliferation, drives hair placode morphogenesis. Dev. Cell. 28:588–602. 10.1016/j.devcel.2014.02.003 - DOI - PubMed
    1. Ahtiainen, L., Uski I., Thesleff I., and Mikkola M.L.. 2016. Early epithelial signaling center governs tooth budding morphogenesis. J. Cell Biol. 214:753–767. 10.1083/jcb.201512074 - DOI - PMC - PubMed
    1. Aigouy, B., Umetsu D., and Eaton S.. 2016. Segmentation and Quantitative Analysis of Epithelial Tissues. Methods Mol. Biol. 1478:227–239. 10.1007/978-1-4939-6371-3_13 - DOI - PubMed
    1. Andl, T., Ahn K., Kairo A., Chu E.Y., Wine-Lee L., Reddy S.T., Croft N.J., Cebra-Thomas J.A., Metzger D., Chambon P., et al. . 2004. Epithelial Bmpr1a regulates differentiation and proliferation in postnatal hair follicles and is essential for tooth development. Development. 131:2257–2268. 10.1242/dev.01125 - DOI - PubMed

Publication types

MeSH terms