. 2021 Oct 1;23(10):1693-1708.
doi: 10.1093/neuonc/noab126.

Spliceosome-regulated RSRP1-dependent NF-κB activation promotes the glioblastoma mesenchymal phenotype

Affiliations

Spliceosome-regulated RSRP1-dependent NF-κB activation promotes the glioblastoma mesenchymal phenotype

Yaomin Li et al. Neuro Oncol. .

Abstract

Background: The glioblastoma (GBM) mesenchymal (MES) phenotype, induced by NF-κB activation, is characterized by aggressive tumor progression and poor clinical outcomes. Our previous analysis indicated that MES GBM has a unique alternative splicing (AS) pattern; however, the underlying mechanism remains obscure. We aimed to reveal how splicing regulation contributes to MES phenotype promotion in GBM.

Methods: We screened novel candidate splicing factors that participate in NF-κB activation and MES phenotype promotion in GBM. In vitro and in vivo assays were used to explore the function of RSRP1 in MES GBM.

Results: Here, we identified that arginine/serine-rich protein 1 (RSRP1) promotes the MES phenotype by facilitating GBM cell invasion and apoptosis resistance. Proteomic, transcriptomic, and functional analyses confirmed that RSRP1 regulates AS in MES GBM through mediating spliceosome assembly. One RSRP1-regulated AS event resulted in skipping PARP6 exon 18 to form truncated, oncogenic PARP6-s. This isoform was unable to effectively suppress NF-κB. Cotreatment of cultured GBM cells and GBM tumor-bearing mice with spliceosome and NF-κB inhibitors exerted a synergistic effect on MES GBM growth.

Conclusion: We identified a novel mechanism through which RSRP1-dependent splicing promotes the GBM MES phenotype. Targeting AS via RSRP1-related spliceosomal factors might constitute a promising treatment for GBM.

Keywords: NF-κB; RSRP1; glioblastoma; mesenchymal phenotype; spliceosome.


Figures

Fig. 1
Fig. 1
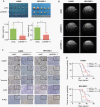
Increased RSRP1 expression is related to a more malignant glioblastoma (GBM) phenotype. (A) Venn diagram showing the upregulated genes in GBM samples from The Cancer Genome Atlas (TCGA) database. Green circle: upregulated genes in samples with activated NF-κB. Red circle: upregulated genes in spliceosome-enriched samples. Purple circle: genes upregulated in MES GBM samples compared to PN GBM samples. (B) Heatmap showing differentially expressed subtype signatures and expression levels of RSRP1 in 3 PN glioblastoma cell lines versus 5 MES GBM cell lines. (C) Representative hematoxylin and eosin (HE) staining and immunohistochemistry (IHC) staining for RSRP1 and CD44 in normal brain (NB), low-grade glioma (LGG), and GBM samples. Scale bars = 100 μm (main images) and 10 μm (insets). (D) Comparison of RSRP1 IHC staining scores among NB and different grade glioma samples. Mann–Whitney U tests were used for statistical analysis. (E) Left: Western blotting (WB) of RSRP1 and CD44 in glioma samples. Middle: Relative RSRP1 expression level in 1p/19q noncodeletion versus codeletion samples. Student’s t test was used for statistical analysis. Right: Correlation between RSRP1 and CD44 expression based on WB results. Pearson correlation analysis was used for statistical analysis. (F) WB analysis of RSRP1 in the indicated GBM cell lines. β-Actin was used for normalization. (G) Survival curves of glioma patients stratified by RSRP1 expression. An IHC staining score of 6 was regarded as the threshold for “high expression” and “low expression” of RSRP1. Left: GBM patients; Right: LGG patients. Log-rank tests were used for survival analysis. *P < .05, **P < .01, ***P < .001.
Fig. 2
Fig. 2
In vitro assays revealed that RSRP1 is essential for GBM tumorigenesis and progression. (A) WB analysis of RSRP1, CD44, p-p65, apoptosis-related markers (cleaved caspase-3, cleaved PARP), and invasion-related markers (N-cadherin, E-cadherin, ZEB1, vimentin, and MMP-9) in the LN229, T98G, and NFH-GSC1 cell lines after transfection with the indicated siRNA. β-Actin was used for normalization. (B) Cell counts of surviving LN229, T98G, or NFH-GSC1 cells 7 days after the indicated siRNA transfection. Five technical replicates were performed for each group. Student’s t test was used for statistical analysis. (C–D) Representative FACS plots of cell cycle analysis (C) and cell apoptosis analysis (D) in LN229, T98G, and NFH-GSC1 cell lines after the indicated siRNA transfection. Three technical replicates were performed for each group. Student’s t test was used for statistical analysis. (E) Transwell assays of LN229, T98G, and NFH-GSC1 cell lines after transfection with the indicated siRNA. Original magnification, 400×. Five random fields of view were captured for each group. Student’s t test was used for statistical analysis. Five technical replicates were performed for each group. One-way ANOVA was used for statistical analysis. *P < .05. **P < .01. ***P < .001. NS, not significant.
Fig. 3
Fig. 3
In vivo assays reveal that RSRP1 is essential for glioblastoma tumorigenesis and progression. (A) Top: Images of subcutaneous xenograft tumors of stable shRNA-transfected LN229 or NFH-GSC1 cells collected from nude mice. Bottom: The mean weights of xenograft tumors in the shRNA groups. Five technical replicates were performed for each group. Student’s t test was used for statistical analysis. (B) Representative cranial MRI T2 sequence images of intracranial tumor-bearing mice 3 weeks after transplantation for each shRNA group. (C) HE staining and IHC staining of xenograft tumors in different shRNA groups. Scale bars = 100 μm and 10 μm. (D) Survival curves of intracranial tumor-bearing mice in each shRNA group. Ten technical replicates were performed for each group. **P < .01. ***P < .001.
Fig. 4
Fig. 4
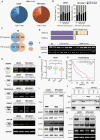
RSRP1 is associated with various spliceosome-related factors. (A) Schematic diagram of RSRP1-associated spliceosome factors in the splicing cycle based on mass spectrometry assays. Spliceosomal snRNPs (red circle) and proteins (red) interacting with RSRP1 are marked. (B) RSRP1-Flag Co-IP of core spliceosomal factors. (C) Representative immunofluorescence (IF) staining showing the colocalization of RSRP1 and core spliceosomal factors in LN229 cells. (D) Left: Schematic of the wild-type RSRP1 (RSRP1-WT) amino acid sequence. Right: Schematics of truncated RSRP1 mutants (RSRP1-Δ1-60aa, RSRP1-Δ60-160aa, RSRP1-Δ160-240aa, and RSRP1-Δ240-290aa). (E) Left: WB analysis of exogenous RSRP1-WT and RSRP1 mutant expression. Right: RSRP1 mutant coimmunoprecipitation (Co-IP) with core spliceosomal factors.
Fig. 4
Fig. 4
RSRP1 is associated with various spliceosome-related factors. (A) Schematic diagram of RSRP1-associated spliceosome factors in the splicing cycle based on mass spectrometry assays. Spliceosomal snRNPs (red circle) and proteins (red) interacting with RSRP1 are marked. (B) RSRP1-Flag Co-IP of core spliceosomal factors. (C) Representative immunofluorescence (IF) staining showing the colocalization of RSRP1 and core spliceosomal factors in LN229 cells. (D) Left: Schematic of the wild-type RSRP1 (RSRP1-WT) amino acid sequence. Right: Schematics of truncated RSRP1 mutants (RSRP1-Δ1-60aa, RSRP1-Δ60-160aa, RSRP1-Δ160-240aa, and RSRP1-Δ240-290aa). (E) Left: WB analysis of exogenous RSRP1-WT and RSRP1 mutant expression. Right: RSRP1 mutant coimmunoprecipitation (Co-IP) with core spliceosomal factors.
Fig. 5
Fig. 5
RSRP1 participates in NF-κB activation through splicing regulation. (A) RSRP1-regulated AS in LN229 and NFH-GSC1 cells. SE: skipped exon, RI: retained intron, A5SS: alternative 5′ splice site, A3SS: alternative 3′ splice site, MXE: mutually exclusive exon. (B) Alterations in percent spliced-in index (PSI) values in different splicing categories after RSRP1 overexpression in LN229 or NFH-GSC1 cells. (C) Venn diagrams showing AS events with increased PSI and decreased PSI values after RSRP1 overexpression in LN229 or NFH-GSC1 cells. (D) Representative validation of RSRP1-regulated AS. (E) Schematic of the PARP-fl and PARP-s isoforms. Red lines represent the “HYI” triad. (F) RT-PCR analysis of the PARP-fl and PARP-s isoform levels in NB, LGG, and GBM tissues. (G) PSI values of PARP6 exon 18 in NB, LGG, and GBM tissues. (H) Survival curves of glioma patients in TCGA datasets. The median PSI value was regarded as the cutoff between high and low levels of PARP6 exon 18. The log-rank test was used to calculate the P-value. (I) WB analysis of downstream NF-κB pathway components after RSRP1 overexpression in LN229 or NFH-GSC1 cells. (J) PARP6-fl and PARP6-s Co-IP with p47 and NEMO. (K) WB analysis of SF3B1 and PARP6 isoform expression levels after SF3B1 knockdown. GAPDH was used for normalization. *P < .05. ***P < .001.
Fig. 6
Fig. 6
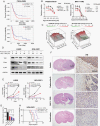
Targeting spliceosomes and the NF-κB pathway is a feasible treatment for MES GBM. (A) Survival curve analysis of GBM patients in the CGGA database stratified by the expression of SF3B1 and CLK2. Log-rank tests were used for survival analysis. (B) The concentration-response curves and half-maximal effective concentration (EC50) values of pladienolide B or BAY11-7082 in the LN229, NFH-GSC1, and corresponding RSRP1-KO cell lines (LN229-KO and NFH-GSC1-KO). Three technical replicates were performed for each group. (C) The synergy scores for the pladienolide B and BAY11-7082 combinations in LN229 (left) and NFH-GSC1 (right) cell lines were calculated by using the SynergyFinder platform (https://synergyfinder.fimm.fi/). (D) WB analysis of vimentin, CD44, and p-p65 in LN229 and NFH-GSC1 cell lines after treatment with pladienolide B (1 nM), BAY11-7082 (20 μM), or both. GAPDH was used for normalization. (E) Relative survival of LN229 and NFH-GSC1 cells after treatment with the indicated concentrations of pladienolide B (3 nM), BAY11-7082 (20 μM), or both. (F) HE staining and IHC staining of xenograft tumors treated with vehicle, 10 mg/kg pladienolide B, 2.5 mg/kg BAY11-7082, or both. Scale bar = 1 mm and 100 μm. (G) Graphic analysis of (F) shows the relative vimentin density in different cells as indicated. (H) Survival curves of intracranial tumor-bearing mice treated with vehicle, 10 mg/kg pladienolide B, 2.5 mg/kg BAY11-7082, or both. Technical replicates were performed for each group as indicated. The log-rank test was used for statistical analysis. *P < .05; **P < .01; ***P < .001.

Similar articles

Cited by

References

    1. Lapointe S, Perry A, Butowski NA. Primary brain tumours in adults. Lancet. 2018;392(10145):432–446. - PubMed
    1. Patel AP, Tirosh I, Trombetta JJ, et al. . Single-cell RNA-seq highlights intratumoral heterogeneity in primary glioblastoma. Science. 2014;344(6190):1396–1401. - PMC - PubMed
    1. Wang Q, Hu B, Hu X, et al. . Tumor evolution of glioma-intrinsic gene expression subtypes associates with immunological changes in the microenvironment. Cancer Cell. 2017;32(1):42–56.e6. - PMC - PubMed
    1. Yuan J, Levitin HM, Frattini V, et al. . Single-cell transcriptome analysis of lineage diversity in high-grade glioma. Genome Med. 2018;10(1):57. - PMC - PubMed
    1. Verhaak RG, Hoadley KA, Purdom E, et al. ; Cancer Genome Atlas Research Network . Integrated genomic analysis identifies clinically relevant subtypes of glioblastoma characterized by abnormalities in PDGFRA, IDH1, EGFR, and NF1. Cancer Cell. 2010;17(1):98–110. - PMC - PubMed

Publication types