. 2021 Sep 1;23(9):1523-1536.
doi: 10.1093/neuonc/noab131.

Metformin effects on brain development following cranial irradiation in a mouse model

Affiliations

Metformin effects on brain development following cranial irradiation in a mouse model

Nili Yuen et al. Neuro Oncol. .

Abstract

Background: Cranial radiation therapy (CRT) is a mainstay of treatment for malignant pediatric brain tumors and high-risk leukemia. Although CRT improves survival, it has been shown to disrupt normal brain development and result in cognitive impairments in cancer survivors. Animal studies suggest that there is potential to promote brain recovery after injury using metformin. Our aim was to evaluate whether metformin can restore brain volume outcomes in a mouse model of CRT.

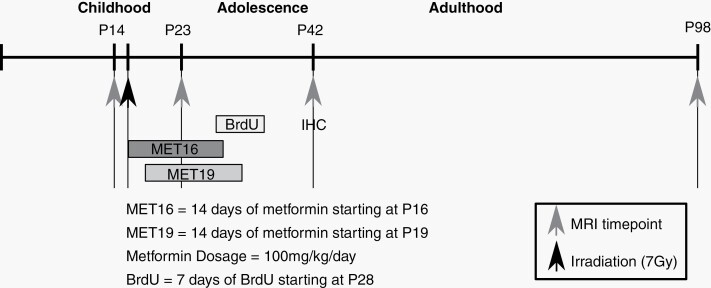
Methods: C57BL/6J mice were irradiated with a whole-brain radiation dose of 7 Gy during infancy. Two weeks of metformin treatment started either on the day of or 3 days after irradiation. In vivo magnetic resonance imaging was performed prior to irradiation and at 3 subsequent time points to evaluate the effects of radiation and metformin on brain development.

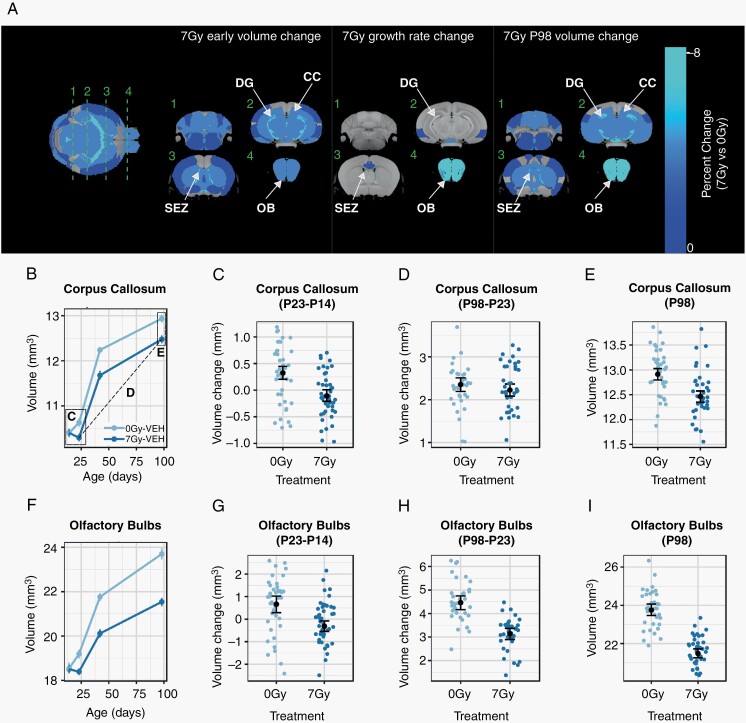
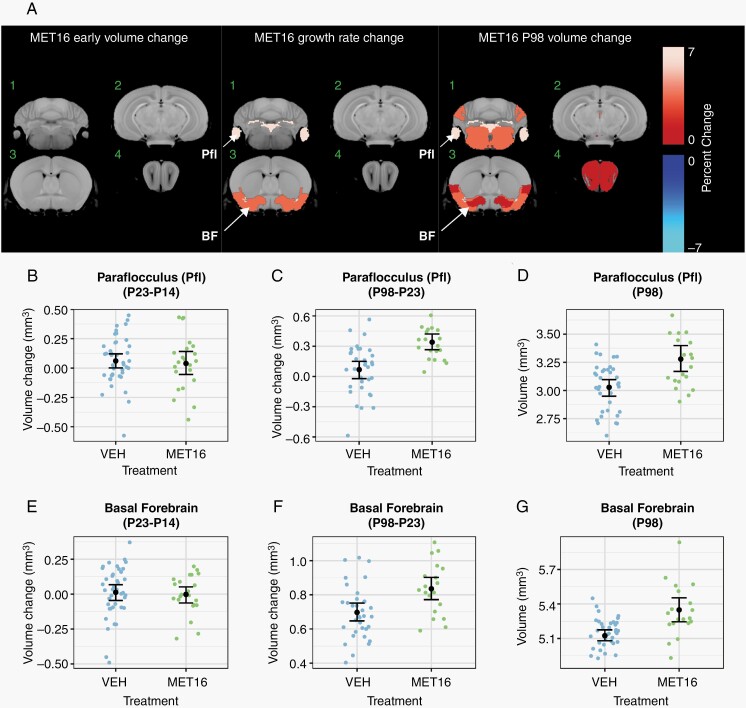
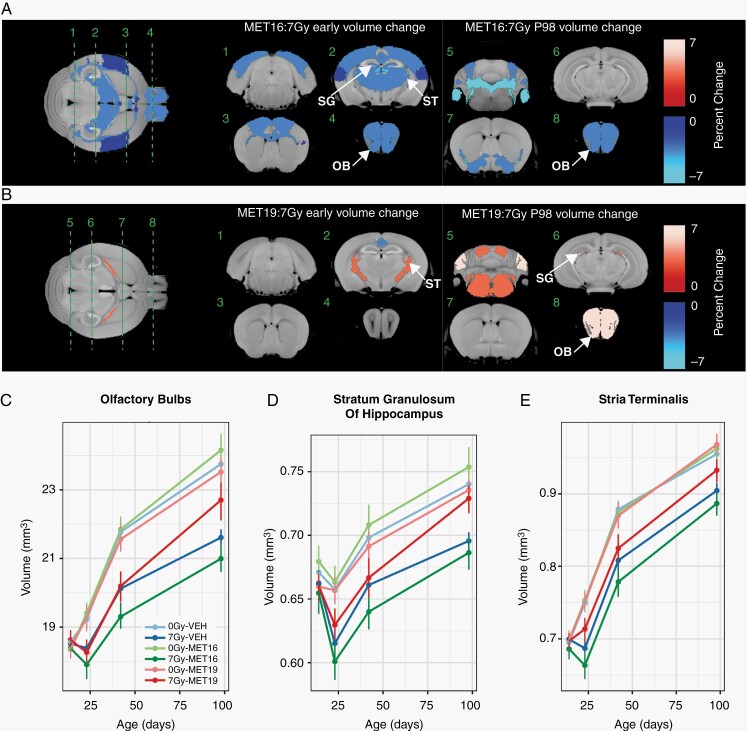
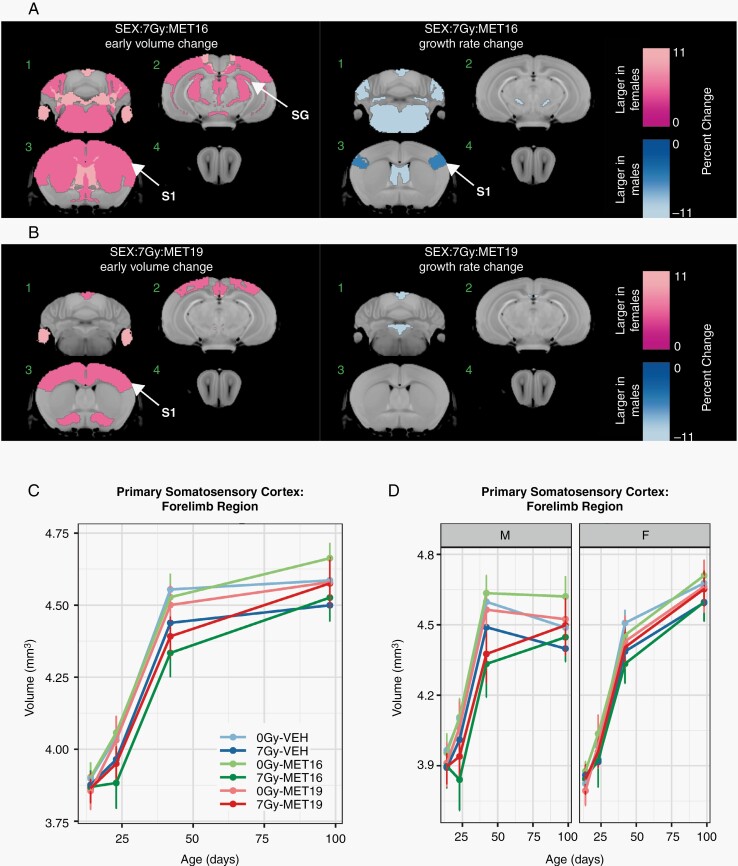
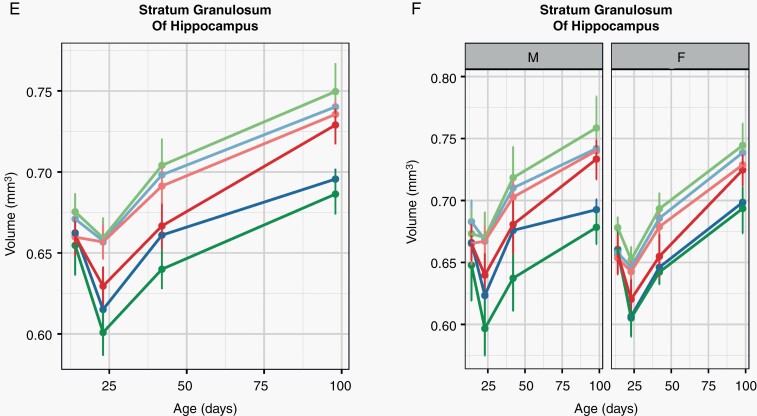
Results: Widespread volume loss in the irradiated brain appeared within 1 week of irradiation with limited subsequent recovery in volume outcomes. In many structures, metformin administration starting on the day of irradiation exacerbated radiation-induced injury, particularly in male mice. Metformin treatment starting 3 days after irradiation improved brain volume outcomes in subcortical regions, the olfactory bulbs, and structures of the brainstem and cerebellum.

Conclusions: Our results show that metformin treatment has the potential to improve neuroanatomical outcomes after CRT. However, both timing of metformin administration and subject sex affect structure outcomes, and metformin may also be deleterious. Our results highlight important considerations in determining the potential benefits of metformin treatment after CRT and emphasize the need for caution in repurposing metformin in clinical studies.

Keywords: MRI; metformin; neurodevelopment; neurogenesis; radiation.


Figures

Fig. 1
Fig. 1
Timeline for studying the effect of radiation and metformin-induced neuroanatomical changes. Approximate human-equivalent ages are depicted above the timeline. Mice were irradiated at P16. Metformin MET16 or MET19 was administered for 14 days, starting on P16 or P19, respectively. In vivo MRI was performed on P14, P23, P42, and P98. BrdU was administered for 7 days, starting on P28, and mice were perfused on P42 in preparation for immunohistochemistry (IHC). Abbreviations: MET16, treated with metformin starting at P16; MET19, treated with metformin starting at P19; MRI, magnetic resonance imaging.
Fig. 2
Fig. 2
Widespread volume reduction in the mouse brain after irradiation at P16. In (A), an average in vivo MRI image is shown at left, with a color overlay indicating the early volume change (ie, the volume difference between 7 Gy and 0 Gy observed at P23) in all regions considered statistically significant (FDR <10%). Green lines indicate the location of orthogonal slices shown in the subsequent columns, which show the early volume change, the total change in growth rate over the post-irradiation (75-day) period, and the P98 change (ie, the difference between 7 Gy and 0 Gy observed at P98). Individual plots show the volume of the corpus callosum and olfactory bulbs over time (B, F), along with plots likewise demonstrating the early volume change as the volume change between P23 and P14 (C, G) and long-term volume change as the volume change between P98 and P23 (D, H). To visualize the endpoint volume outcomes, the final P98 volumes were plotted (E, I). Annotations in B indicate the relationships between the plots. The individual points in (B, F) and black means in (C–E, G–I) represent averages across sex. Points and error bars represent the mean volume and bootstrapped 95% confidence intervals. Smaller colored dots (C–E, G–I) represent structure volumes from individual mice. Abbreviations: 0 Gy, sham-treated; 7 Gy, irradiated; CC, corpus callosum; DG, dentate gyrus; OB, olfactory bulbs; SEZ, subependymal zone; VEH, vehicle-treated mice (ie, no metformin treatment).
Fig. 3
Fig. 3
Increased growth during brain development due to metformin in unirradiated mice. In (A), a color map overlay shows all structures that had a significant volume difference in MET16-treated mice compared to vehicle-treated mice (FDR <10%). Slice positions in (A) match those in Figure 2. There was no effect of MET16 on the brain in 0-Gy mice at P23 (early). Subsequently, enhanced growth rate was observed in regions of the cerebellum, basal forebrain, and piriform cortex, leading to increased volumes by P98 (A). Representative plots of the paraflocculus (B–D) and basal forebrain (E–G) show no significant early volume change as visualized by the P23-P14 volume difference in (B, E). Growth rate and P98 change (A) is significantly increased in both structures, as shown by the P98-P23 volume differences (C, F). This results in increased volume by the final P98 time point (D, G). Treatment effects within the fitted model are represented as the average of males and females. Black points and error bars represent the mean volume and bootstrapped 95% confidence intervals. Smaller colored dots represent structure volumes from individual mice. Abbreviations: BF, basal forebrain; MET16, treated with metformin starting at P16, for 14 days; Pfl, paraflocculus.
Fig. 4
Fig. 4
Metformin treatment effects in the irradiated brain depend on timing of administration. Early (P23) and late (P98) outcomes of MET16 (A) and MET19 (B) metformin treatments were assessed. Metformin-radiation interaction terms in the linear mixed-effects model were used to identify significantly altered regions (with interaction coefficients denoted as MET16:7 Gy and MET19:7 Gy). In (A), the color map shows all structures that had a significant volume difference in (A) irradiated MET16-treated mice or (B) irradiated MET19-treated mice (MET19:7 Gy), compared to controls (FDR of 10%). In (C, D, E), plots depict volumes of the olfactory bulbs, stratum granulosum, and stria terminalis, over time in unirradiated vehicle-treated mice (0 Gy-VEH), irradiated vehicle-treated mice (7 Gy-VEH), unirradiated MET16- or MET19-treated mice (0 Gy-MET16 or 0 Gy-MET19), and irradiated MET16 or MET19-treated mice (7 Gy-MET16 or 7 Gy-MET19). An exacerbation of radiation-induced volume loss was observed in 7 Gy-MET16 mice. In contrast, a partial mitigation of radiation-induced volume loss was observed in 7 Gy-MET19 mice. Points and error bars represent the mean volume and bootstrapped 95% confidence intervals. Abbreviations: 0 Gy, unirradiated; 7 Gy, irradiated with a 7 Gy dose; MET16, treated with metformin starting at P16; MET19, treated with metformin starting at P19; OB, olfactory bulbs; SG, stratum granulosum of hippocampus; ST, stria terminalis.
Fig. 5
Fig. 5
Sex modulates the effects of metformin in the irradiated brain. We tested for the impact of biological sex on the MET16 and MET19 interactions with radiation treatment by evaluating the 3-way interaction term of sex, radiation condition, and metformin treatment (denoted as SEX:7Gy:MET16 and SEX:7Gy:MET19). In (A, B), the color map shows all structures that had a significant difference in the radiation-metformin interaction between males and females (FDR of 10%). Slice positions in (A) match those in Figure 2. Many regions were relatively larger in the early (P23) irradiated metformin-treated female brain compared to the irradiated metformin-treated male brain. However, a greater growth rate was observed in metformin-treated irradiated males compared to metformin-treated irradiated females, particularly for MET16. In (C, E), representative plots averaged over males and females show the time course of structure volumes for the primary somatosensory cortex (forelimb region) and stratum granulosum of the hippocampus in unirradiated vehicle-treated mice (0 Gy-VEH), irradiated vehicle-treated mice (7 Gy-VEH), unirradiated MET16- or MET19-treated mice (0 Gy-MET16 or 0 Gy-MET19) and irradiated MET16- or MET19-treated mice (7 Gy-MET16 or 7 Gy-MET19). The plots are repeated in (D, F), with panels separated by sex to show sex-dependent differences. Points and error bars represent the mean volume and bootstrapped 95% confidence intervals. Abbreviations: 0 Gy, unirradiated; 7 Gy, irradiated with a 7-Gy dose; MET16, treated with metformin starting at P16; MET19, treated with metformin starting at P19; S1, primary somatosensory cortex (forelimb region); SG, stratum granulosum of hippocampus.
Fig. 5
Fig. 5
Sex modulates the effects of metformin in the irradiated brain. We tested for the impact of biological sex on the MET16 and MET19 interactions with radiation treatment by evaluating the 3-way interaction term of sex, radiation condition, and metformin treatment (denoted as SEX:7Gy:MET16 and SEX:7Gy:MET19). In (A, B), the color map shows all structures that had a significant difference in the radiation-metformin interaction between males and females (FDR of 10%). Slice positions in (A) match those in Figure 2. Many regions were relatively larger in the early (P23) irradiated metformin-treated female brain compared to the irradiated metformin-treated male brain. However, a greater growth rate was observed in metformin-treated irradiated males compared to metformin-treated irradiated females, particularly for MET16. In (C, E), representative plots averaged over males and females show the time course of structure volumes for the primary somatosensory cortex (forelimb region) and stratum granulosum of the hippocampus in unirradiated vehicle-treated mice (0 Gy-VEH), irradiated vehicle-treated mice (7 Gy-VEH), unirradiated MET16- or MET19-treated mice (0 Gy-MET16 or 0 Gy-MET19) and irradiated MET16- or MET19-treated mice (7 Gy-MET16 or 7 Gy-MET19). The plots are repeated in (D, F), with panels separated by sex to show sex-dependent differences. Points and error bars represent the mean volume and bootstrapped 95% confidence intervals. Abbreviations: 0 Gy, unirradiated; 7 Gy, irradiated with a 7-Gy dose; MET16, treated with metformin starting at P16; MET19, treated with metformin starting at P19; S1, primary somatosensory cortex (forelimb region); SG, stratum granulosum of hippocampus.
Fig. 6
Fig. 6
Metformin enhances neurogenesis and proliferation in the unirradiated brain. Representative confocal images (A–F) of BrdU, NeuN, and DAPI immunostaining in the dentate gyrus of the hippocampus for unirradiated (VEH-0 Gy, n = 9; MET16-0 Gy, n = 3, MET19-0 Gy, n = 4) or irradiated (VEH-7 Gy, n = 8; MET16-7 Gy, n = 4, MET19-7 Gy, n = 4) mice at P42 (after BrdU labeling from P28-P35). Confocal images show cells with immunoreactivity for BrdU (first column), NeuN (second column), DAPI (third column), and merged (fourth column). Arrows indicate BrdU-positive, NeuN-positive cells and arrowheads indicate BrdU-positive and NeuN-negative cells (G). Scale bars represent 100 and 10 µm (A–F and G, respectively). BrdU- and BrdU/NeuN-positive cell counts within the dentate gyrus (H, I) demonstrate a significant radiation-induced loss in proliferative cells and new neurons at 42 days of age (P < .05, 2-way ANOVA; H, I). In unirradiated mice, an increase in the number of BrdU- and BrdU/NeuN-positive cells is observed with MET16 treatment compared with VEH controls. In irradiated mice, a significant decrease in double BrdU/NeuN-positive cells is observed with MET16 treatment compared to VEH controls (I). MET19 treatment, on the other hand, was not different from VEH in either irradiated or unirradiated mice for any cell counts. Colored bars represent means, whereas small black circles and triangles represent individual male or female mice, respectively. Error bars are SEM. Abbreviations: 0 Gy, unirradiated; 7 Gy, irradiated with a 7-Gy dose; MET16, treated with metformin starting at P16; MET19, treated with metformin starting at P19; VEH, vehicle-treated mice. *P < .05, **P < .01, Student t test.
Fig. 6
Fig. 6
Metformin enhances neurogenesis and proliferation in the unirradiated brain. Representative confocal images (A–F) of BrdU, NeuN, and DAPI immunostaining in the dentate gyrus of the hippocampus for unirradiated (VEH-0 Gy, n = 9; MET16-0 Gy, n = 3, MET19-0 Gy, n = 4) or irradiated (VEH-7 Gy, n = 8; MET16-7 Gy, n = 4, MET19-7 Gy, n = 4) mice at P42 (after BrdU labeling from P28-P35). Confocal images show cells with immunoreactivity for BrdU (first column), NeuN (second column), DAPI (third column), and merged (fourth column). Arrows indicate BrdU-positive, NeuN-positive cells and arrowheads indicate BrdU-positive and NeuN-negative cells (G). Scale bars represent 100 and 10 µm (A–F and G, respectively). BrdU- and BrdU/NeuN-positive cell counts within the dentate gyrus (H, I) demonstrate a significant radiation-induced loss in proliferative cells and new neurons at 42 days of age (P < .05, 2-way ANOVA; H, I). In unirradiated mice, an increase in the number of BrdU- and BrdU/NeuN-positive cells is observed with MET16 treatment compared with VEH controls. In irradiated mice, a significant decrease in double BrdU/NeuN-positive cells is observed with MET16 treatment compared to VEH controls (I). MET19 treatment, on the other hand, was not different from VEH in either irradiated or unirradiated mice for any cell counts. Colored bars represent means, whereas small black circles and triangles represent individual male or female mice, respectively. Error bars are SEM. Abbreviations: 0 Gy, unirradiated; 7 Gy, irradiated with a 7-Gy dose; MET16, treated with metformin starting at P16; MET19, treated with metformin starting at P19; VEH, vehicle-treated mice. *P < .05, **P < .01, Student t test.

Similar articles

Cited by

References

    1. Spiegler BJ, Bouffet E, Greenberg ML, Rutka JT, Mabbott DJ. Change in neurocognitive functioning after treatment with cranial radiation in childhood. J Clin Oncol. 2004;22(4):706–713. - PubMed
    1. Scantlebury N, Bouffet E, Laughlin S, et al. . White matter and information processing speed following treatment with cranial-spinal radiation for pediatric brain tumor. Neuropsychology. 2016;30(4):425–438. - PubMed
    1. Brinkman TM, Krasin MJ, Liu W, et al. . Long-term neurocognitive functioning and social attainment in adult survivors of pediatric CNS tumors: results from the St Jude Lifetime Cohort Study. J Clin Oncol. 2016;34(12):1358–1367. - PMC - PubMed
    1. Reddick WE, Taghipour DJ, Glass JO, et al. . Prognostic factors that increase the risk for reduced white matter volumes and deficits in attention and learning for survivors of childhood cancers. Pediatr Blood Cancer. 2014;61(6):1074–1079. - PMC - PubMed
    1. Padovani L, André N, Constine LS, Muracciole X. Neurocognitive function after radiotherapy for paediatric brain tumours. Nat Rev Neurol. 2012;8(10):578–588. - PubMed

Publication types

Grants and funding