. 2021 Jul 26;60(31):17102-17107.
doi: 10.1002/anie.202104453. Epub 2021 Jun 29.

Infrared Based Saliva Screening Test for COVID-19

Affiliations

Infrared Based Saliva Screening Test for COVID-19

Bayden R Wood et al. Angew Chem Int Ed Engl. .

Abstract

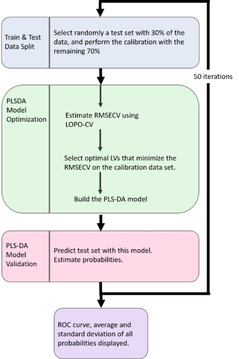
Severe acute respiratory syndrome coronavirus 2 (SARS-CoV-2) has resulted in an unprecedented need for diagnostic testing that is critical in controlling the spread of COVID-19. We propose a portable infrared spectrometer with purpose-built transflection accessory for rapid point-of-care detection of COVID-19 markers in saliva. Initially, purified virion particles were characterized with Raman spectroscopy, synchrotron infrared (IR) and AFM-IR. A data set comprising 171 transflection infrared spectra from 29 subjects testing positive for SARS-CoV-2 by RT-qPCR and 28 testing negative, was modeled using Monte Carlo Double Cross Validation with 50 randomized test and model sets. The testing sensitivity was 93 % (27/29) with a specificity of 82 % (23/28) that included positive samples on the limit of detection for RT-qPCR. Herein, we demonstrate a proof-of-concept high throughput infrared COVID-19 test that is rapid, inexpensive, portable and utilizes sample self-collection thus minimizing the risk to healthcare workers and ideally suited to mass screening.

Keywords: COVID-19 diagnostic; Fourier transform infrared (FTIR) spectroscopy; Raman spectroscopy; SARS-CoV-2; saliva.


Conflict of interest statement

The authors declare no conflict of interest.

Figures

Figure 1
Figure 1
Schematic diagram of an infrared saliva‐based test for COVID‐19. A–E) A) Subject presents with COVID‐19 symptoms. B) The subject dribbles into a container containing Viral Transport Medium (VTM). C) The saliva, which contains a range of COVID‐19 biomarkers including ACE2, adenosine deaminase, immunoglobulin G, immunoglobulin M, RNA and secretory immunoglobulin A is deposited onto an infrared transflection substrate and dried (10 mins). D) The spectra were acquired in triplicate (5 minutes) using a PerkinElmer Spectrum Two spectrometer with a modified PerkinElmer® reflective accessory optimized for transflection slides (insert). E) The spectra, which represent a chemical snapshot of the entire saliva chemistry, including COVID‐19 markers. F) A Monte Carlo double cross validation model is used to predict COVID‐19 based on spectral markers. G) The results are presented as PLS‐DA prediction plots and Receiver Operating Curves.
Figure 2
Figure 2
AFM, TEM, synchrotron FTIR and Raman characterization of SARS‐CoV‐2 virus. A–E) A) TEM image of SARS‐CoV‐2 sample with single virion marked by black square. B) Magnification of the area marked by the black square in (A), showing a single SARS‐CoV‐2 particle with its characteristic morphological appearance. C) AFM height and D) AFM deflection images of SARS‐CoV‐2 sample, demonstrating multiple round structures. E) Synchrotron FTIR spectrum and its 2nd derivative transform with the most prominent bands marked. The bands are color‐coded as follows: lipids (blue), proteins (green) and nucleic acids (orange). F) Raman spectrum (532 nm) of SARS‐CoV‐2 virions (red) compared to spectrum of purified RNA (black) with labelled bands.
Figure 3
Figure 3
A) Comparison of transflection spectra recorded using a PerkinElmer Spectrum Two FT‐IR spectrometer by depositing and drying the saliva samples (5 volunteers in triplicate) directly onto the ATR internal reflection element (red) and using the new transfection accessory with infrared transflection slides. B) Signal‐to‐noise noise comparison between the two techniques showing standard deviation error bars for saliva spectra from the 5 volunteers.
Figure 4
Figure 4
Patient modelling (A–E) A) FTIR averaged spectra (bottom) and corresponding second derivative transformed spectra (top) from 87 spectra from 29 COVID‐19 positive subjects (red) and 84 spectra from 28 COVID‐19 negative subjects (blue) with important bands labelled. B) Principal Component Analysis (PCA) scores plot showing PC1 (54 % explained variance) and PC8 (2 % explained variance) with each spectrum plotted as a single point in multidimensional space with red dots associated with positive and blue dots negative spectra. The red and blue shading shows the general separation of the positive from negative spectra, which occurs along the diagonal. C) PC1 and PC8 loading plots showing the important bands discriminating the positive from negative sample spectra along each PC. The positive scores are associated with negative loadings and vice versa because the modelling was based on the second derivative spectra. D) Receiver Operating Characteristic (ROC) Curve showing the false‐positive rate versus the true positive rate for the MCDCV model. E) Probability diagram showing the averaged sample spectra plotted as points in multi‐dimensional space. The threshold value of 0.6 is shown by the dotted line, which is optimized to minimize the number of false positives classified by the spectroscopic model. The error bars represent the standard deviation for the 50 randomized test and model sets.
Figure 5
Figure 5
MCDCV flow chart showing model architecture with inner cross validation and outer prediction loops.

References

    1. World Health Organisation Coronavirus Disease (COVID-19) Dashboard, W.H.O., https://covid19.who.int/ 2020.
    1. Czumbel L. M., Kiss S., Farkas N., Mandel I., Hegyi A., Nagy A., Lohinai Z., Szakacs Z., Hegyi P., Steward M. C., Varga G., Front. Med. 2020, 7, 465. - PMC - PubMed
    1. Walters W., Collins T., Evans A., Br. J. Oral Maxillofac. Surg. 2020, 58, e320–e322. - PMC - PubMed
    1. Ali F., Sweeney D. A., Clin. Infect. Dis. 2021, 72, e357–e358. - PMC - PubMed
    1. Williams E., Bond K., Zhang B., Putland M., Williamson D. A., J. Clin. Microbiol. 2020, 58, e00776-20. - PMC - PubMed

Publication types