. 2021 Jul 7;32(7):1659-1670.
doi: 10.1021/jasms.1c00026. Epub 2021 May 27.

New Interface for Faster Proteoform Analysis: Immunoprecipitation Coupled with SampleStream-Mass Spectrometry

Affiliations

New Interface for Faster Proteoform Analysis: Immunoprecipitation Coupled with SampleStream-Mass Spectrometry

Henrique Dos Santos Seckler et al. J Am Soc Mass Spectrom. .

Abstract

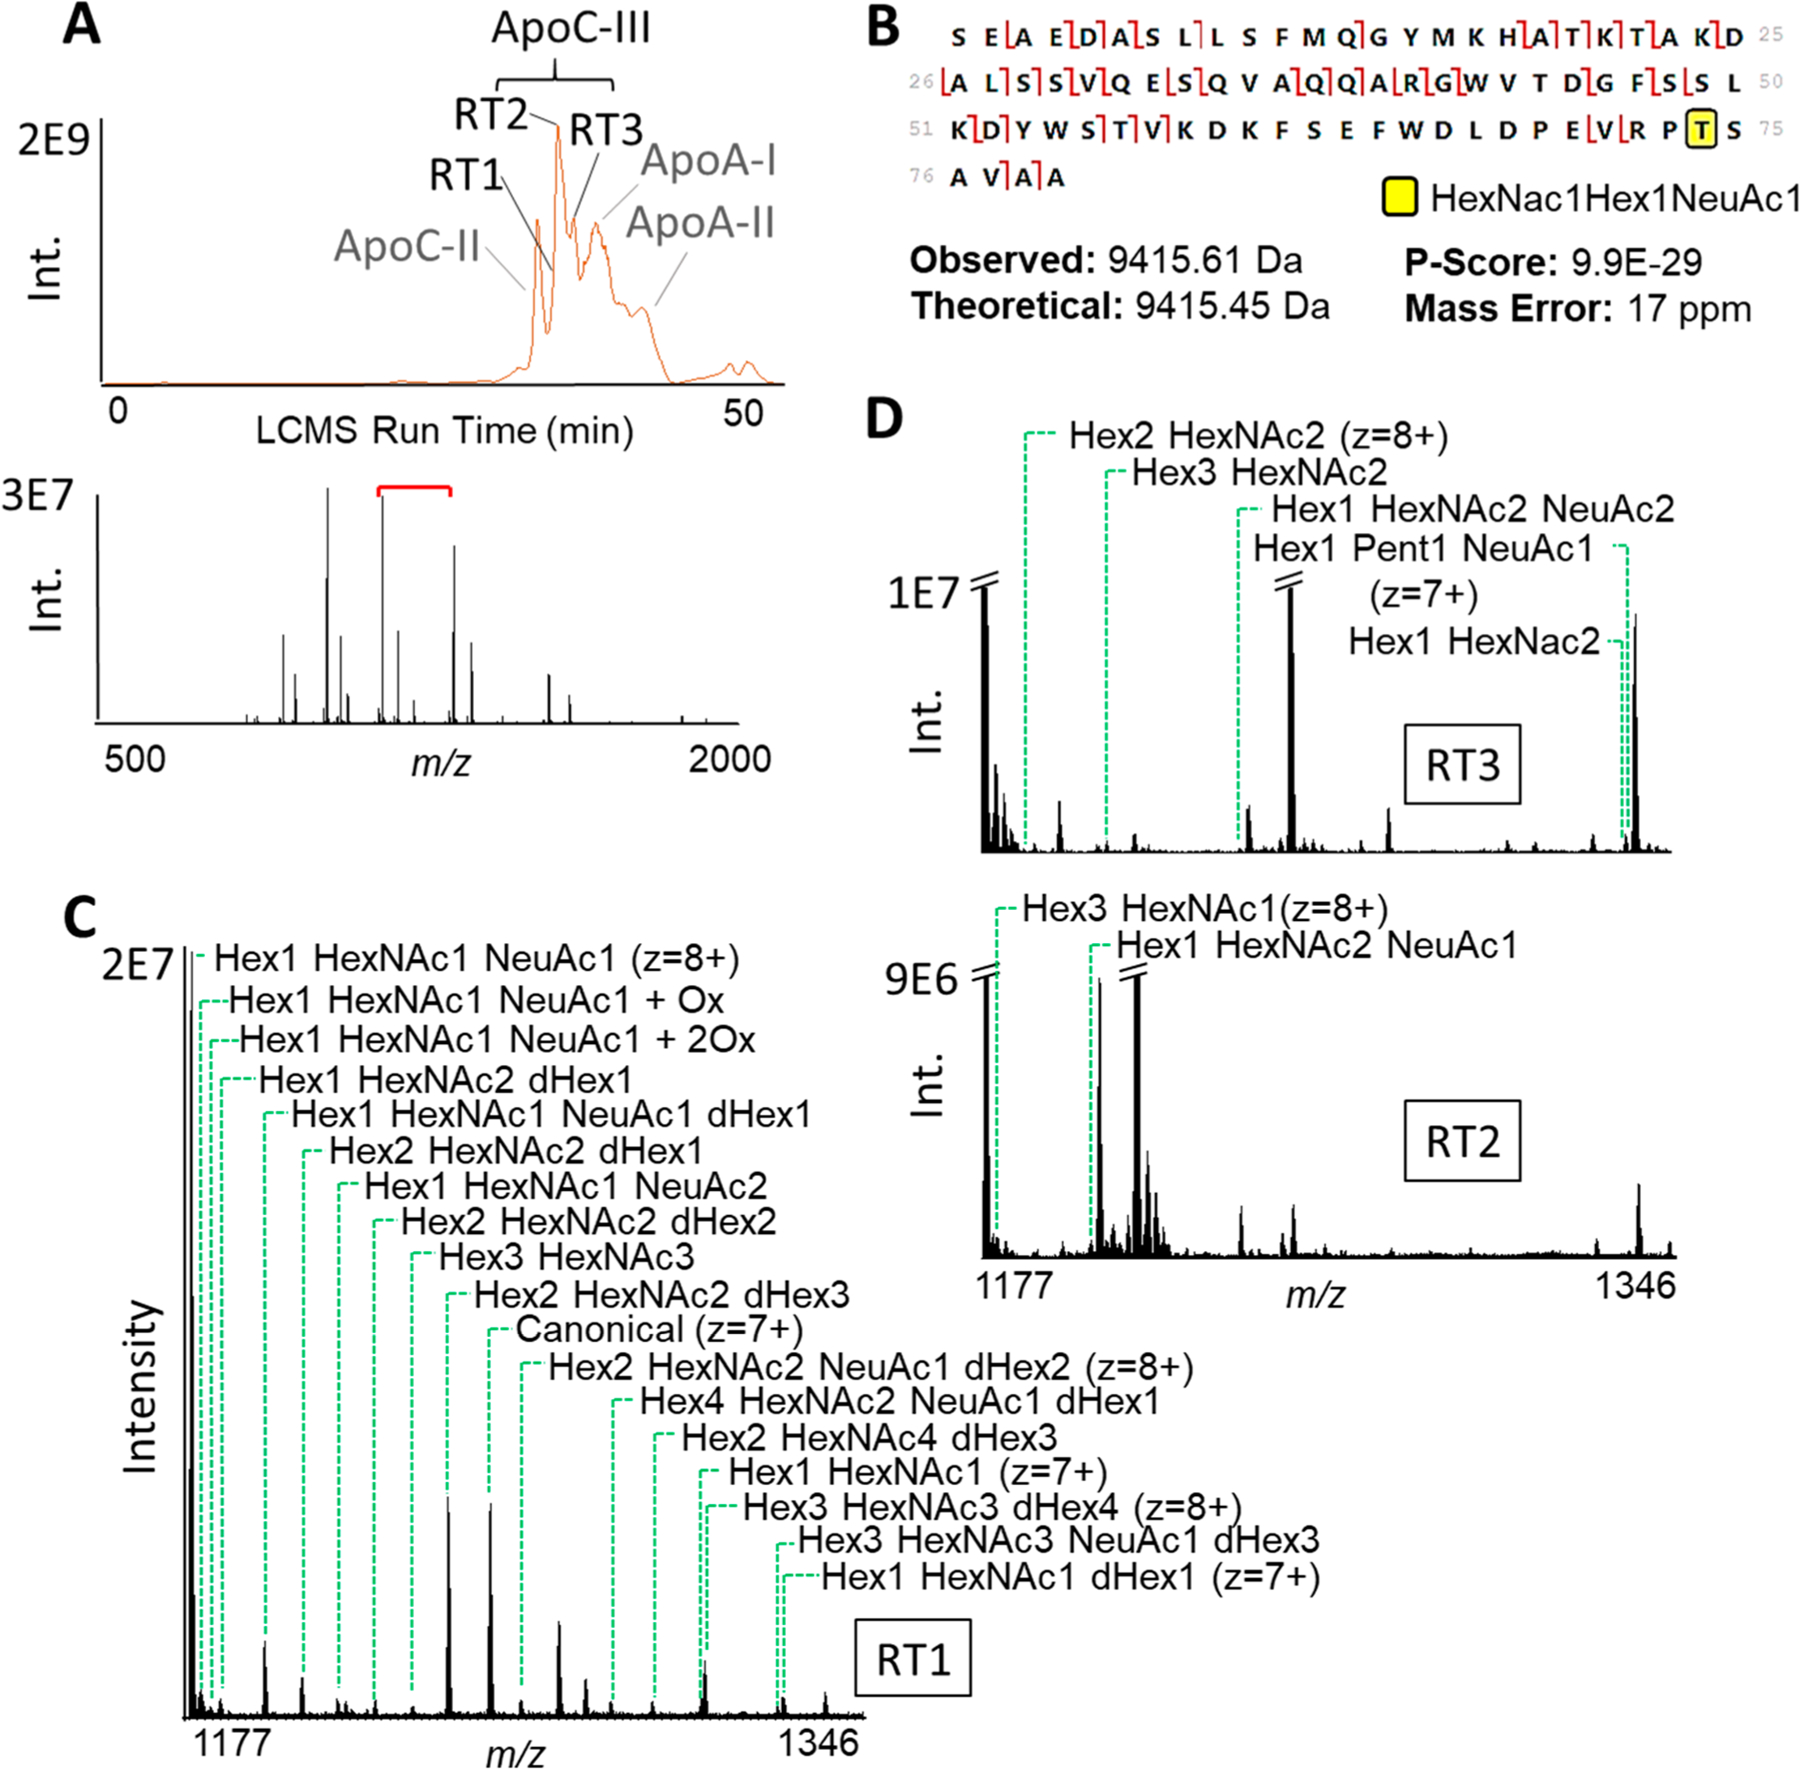
Different proteoform products of the same gene can exhibit differing associations with health and disease, and their patterns of modifications may offer more precise markers of phenotypic differences between individuals. However, currently employed protein-biomarker discovery and quantification tools, such as bottom-up proteomics and ELISAs, are mostly proteoform-unaware. Moreover, the current throughput for proteoform-level analyses by liquid chromatography mass spectrometry (LCMS) for quantitative top-down proteomics is incompatible with population-level biomarker surveys requiring robust, faster proteoform analysis. To this end, we developed immunoprecipitation coupled to SampleStream mass spectrometry (IP-SampleStream-MS) as a high-throughput, automated technique for the targeted quantification of proteoforms. We applied IP-SampleStream-MS to serum samples of 25 individuals to assess the proteoform abundances of apolipoproteins A-I (ApoA-I) and C-III (ApoC-III). The results for ApoA-I were compared to those of LCMS for these individuals, with IP-SampleStream-MS showing a >7-fold higher throughput with >50% better analytical variation. Proteoform abundances measured by IP-SampleStream-MS correlated strongly to LCMS-based values (R2 = 0.6-0.9) and produced convergent proteoform-to-phenotype associations, namely, the abundance of canonical ApoA-I was associated with lower HDL-C (R = 0.5) and glycated ApoA-I with higher fasting glucose (R = 0.6). We also observed proteoform-to-phenotype associations for ApoC-III, 22 glycoproteoforms of which were characterized in this study. The abundance of ApoC-III modified by a single N-acetyl hexosamine (HexNAc) was associated with indices of obesity, such as BMI, weight, and waist circumference (R ∼ 0.7). These data show IP-SampleStream-MS to be a robust, scalable workflow for high-throughput associations of proteoforms to phenotypes.


Conflict of interest statement

The authors declare the following competing financial interest(s): Authors N.L.K. and P.D.C. report a conflict of interest with Integrated Protein Technologies, the supplier of the SampleStream system used in this work.

Figures

Figure 1.
Figure 1.
General study design comparing two approaches for profiling of apolipoprotein proteoforms. Serum samples of 25 well-phenotyped CARDIA participants were submitted to either reverse-phase LCMS (top)—the traditional top-down-proteomic technique for proteoform quantification—or IP-SampleStream-MS. The IP-SampleStream-MS approach to proteoform profiling starts from a targeted immunoprecipitation (left). Using magnetic beads and an automated sample-handling platform (Thermo KingFisher), immunoprecipitation is parallelized and automated. Then, samples are transferred to SampleStream for buffer-exchange, concentration, and course filtering based on molecular weight. Each sample is then automatically injected into the MS, allowing for targeted observation of the proteoform profile of different samples in quick succession. Herein, we compared the efficacy and throughput of these two approaches toward characterizing associations between proteoform abundance and phenotype.
Figure 2.
Figure 2.
Comparison of ApoA-I proteoforms observed by LCMS (left) and IP-SampleStream-MS (right); the top two panels contrast a typical chromatogram versus a “flowgram” analyzed by LCMS and IP-SS-MS, respectively. (A) LCMS results. Different peaks correspond to the elution times of different proteins and molecules (e.g., immunoglobulin G, IgG; phospholipids, PL). Proteoforms of ApoA-I elute at three different retention times. At the middle, the Full MS scan at the main retention time of ApoA-I proteoforms (RT2). At the bottom, SIM scans set between two charge states of canonical ApoA-I, at the different retention times. Notably, a different profile of proteoforms of ApoA-I is observable at the different retention times. At RT3, ApoA-I modified by different fatty acids (from left to right: palmitic, oleic, arachidonic, and docohexaenoic acylations) can be observed. (B) IP-SampleStream-MS results. At the top, the flowgram (i.e., the elution profile of multiple samples, as analyzed by SampleStream-MS). A single peak—corresponding to one individual’s sample—is shown separately, underneath. All observed proteoforms of ApoA-I elute at the same time. At the middle, the Full MS scan at elution time. At the bottom, the SIM scan at elution time, where proteoforms of ApoA-I can be observed.
Figure 3.
Figure 3.
Comparison of LCMS and IP-SampleStream-MS proteoform profiling for the same 25 individuals. (A) Correlation of percent proteoform abundances between IP-SampleStream-MS and LCMS. Bars represent standard deviation; an R2, a P-score, and a shaded confidence interval of the linear regression are shown. (B) Correlation coefficient heatmaps of proteoform abundance to phenotype. Only commonly observed proteoforms were used for this analysis. Colors represent different correlation strengths (Pearson’s R), as depicted in the color key. Asterisks represent the significance of the association at a 5% false discovery rate. (C) Example scatterplots of the significant associations observed by the two proteoform profiling methods. Bars represent standard deviation; a Pearson’s R, a P-score, and a shaded confidence interval of the linear regression are shown.
Figure 4.
Figure 4.
Proteoforms of ApoC-III observable by LCMS of an apolipoprotein-specific pulldown of human serum. (A) At the top, a typical chromatogram of this sample. Different peaks correspond to the elution times of different apolipoproteins. Proteoforms of ApoC-III elute at three different retention times. At the top, the Full MS scan at the main retention time of ApoC-III proteoforms (RT2); the red bracket shows the window used for SIM scans. (B) Characterization of an ApoC-III proteoform by EThcD. Fragments that cover T74, the previously reported glycosylation site of ApoC-III, carry a mass shift corresponding to the combination of Hex, HexNac, and NeuAc masses. Intact mass, overall fragmentation, and coverage of the modified site confidently identify this proteoform. P-score is reported for proteoform identification. (C and D) SIM scans set between two charge states of Hex1 HexNac1 NeuAc1 ApoC-III, at the different retention times. Notably, different proteoforms of ApoC-III are observable at different retention times.
Figure 5.
Figure 5.
Observation of ApoC-III proteoforms by IP-SampleStream-MS. (A) SampleStream-MS flowgram of ApoC-III samples for proteoform profiling. (B) Elution peak for a single sample. (C) Full MS scan at elution time. The red bracket shows the window used for SIM scans. (D) SIM scan at elution time, where the proteoforms of ApoC-III could be observed.
Figure 6.
Figure 6.
Association of ApoC-III glycoproteoform abundances and cardiometabolic phenotype. (A) Correlation coefficient heatmaps of glycoform abundance to phenotype. Only proteoforms commonly observed across all 25 individuals were used for this analysis. Colors represent different correlation strengths (Pearson’s R), as depicted in the key. Asterisks represent the significance of the association at a 5% false discovery rate. (B) Example scatterplot of a significant association. Bars represent standard deviation; a Pearson’s R, a P-score, and a shaded confidence interval of the linear regression are shown.

Similar articles

Cited by

References

    1. Schluter H; Apweiler R; Holzhutter HG; Jungblut PR Finding one’s way in proteomics: a protein species nomenclature. Chem. Cent. J 2009, 3 (1), 1–10. - PMC - PubMed
    1. Smith LM; Kelleher NL Proteoform : a single term describing protein complexity. Nat. Methods 2013, 10 (3), 186–187. - PMC - PubMed
    1. Seckler HDS; Fornelli L; Mutharasan RK; Thaxton CS; Fellers R; Daviglus M; Sniderman A; Rader D; Kelleher NL; Lloyd-Jones DM; Compton PD; Wilkins JT A Targeted, Differential Top-Down Proteomic Methodology for Comparison of ApoA-I Proteoforms in Individuals with High and Low HDL Efflux Capacity. J. Proteome Res 2018, 17 (6), 2156–2164. - PMC - PubMed
    1. Tucholski T; Cai W; Gregorich ZR; Bayne EF; Mitchell SD; McIlwain SJ; de Lange WJ; Wrobbel M; Karp H; Hite Z; Vikhorev PG; Marston SB; Lal S; Li A; Dos Remedios C; Kohmoto T; Hermsen J; Ralphe JC; Kamp TJ; Moss RL; Ge Y Distinct hypertrophic cardiomyopathy genotypes result in convergent sarcomeric proteoform profiles revealed by top-down proteomics. Proc. Natl. Acad. Sci. U. S. A 2020, 117 (40), 24691–24700. - PMC - PubMed
    1. Ntai I; LeDuc RD; Fellers RT; Erdmann-Gilmore P; Davies SR; Rumsey J; Early BP; Thomas PM; Li S; Compton PD; Ellis MJ; Ruggles KV; Fenyo D; Boja ES; Rodriguez H; Townsend RR; Kelleher NL Integrated Bottom-Up and Top-Down Proteomics of Patient-Derived Breast Tumor Xenografts. Mol. Cell Proteomics 2016, 15 (1), 45–56. - PMC - PubMed

LinkOut - more resources