. 2021 Jul 1;131(13):e139675.
doi: 10.1172/JCI139675.

Chronic T cell receptor stimulation unmasks NK receptor signaling in peripheral T cell lymphomas via epigenetic reprogramming

Affiliations

Chronic T cell receptor stimulation unmasks NK receptor signaling in peripheral T cell lymphomas via epigenetic reprogramming

Sylvain Carras et al. J Clin Invest. .

Abstract

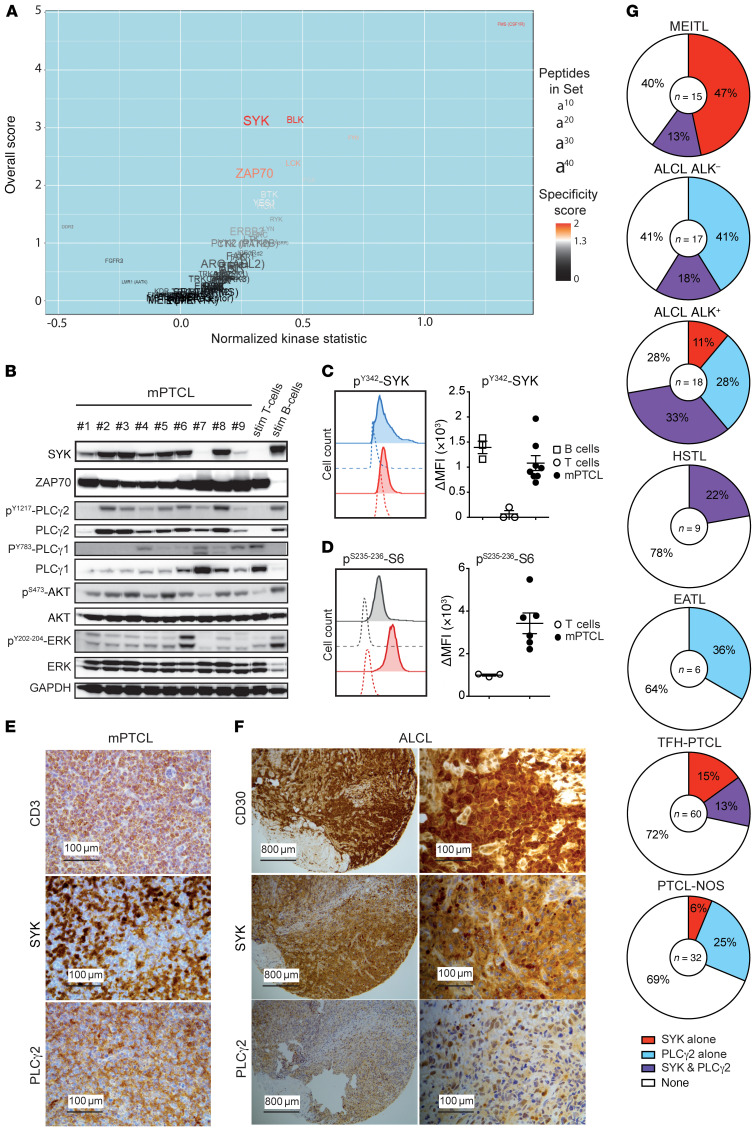
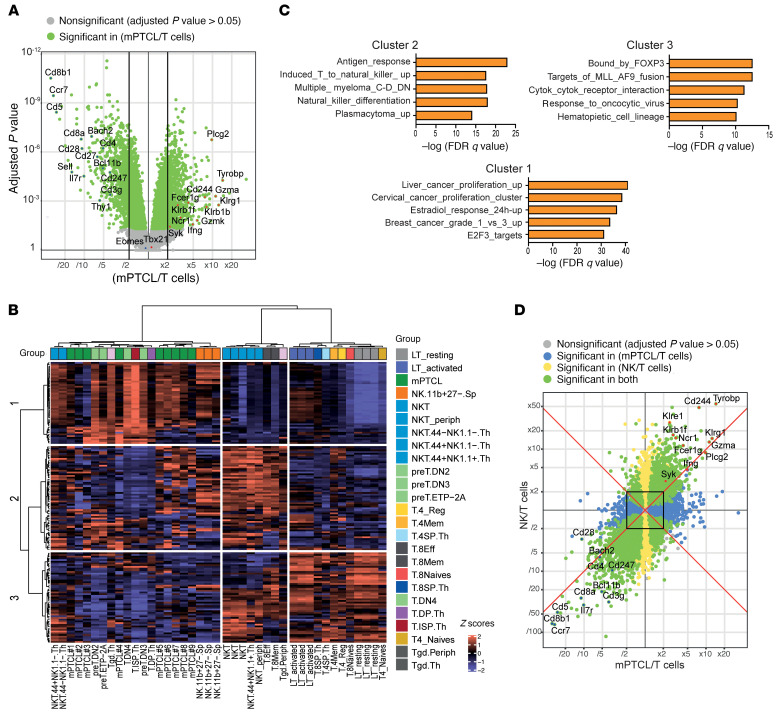
Peripheral T cell lymphomas (PTCLs) represent a significant unmet medical need with dismal clinical outcomes. The T cell receptor (TCR) is emerging as a key driver of T lymphocyte transformation. However, the role of chronic TCR activation in lymphomagenesis and in lymphoma cell survival is still poorly understood. Using a mouse model, we report that chronic TCR stimulation drove T cell lymphomagenesis, whereas TCR signaling did not contribute to PTCL survival. The combination of kinome, transcriptome, and epigenome analyses of mouse PTCLs revealed a NK cell-like reprogramming of PTCL cells with expression of NK receptors (NKRs) and downstream signaling molecules such as Tyrobp and SYK. Activating NKRs were functional in PTCLs and dependent on SYK activity. In vivo blockade of NKR signaling prolonged mouse survival, demonstrating the addiction of PTCLs to NKRs and downstream SYK/mTOR activity for their survival. We studied a large collection of human primary samples and identified several PTCLs recapitulating the phenotype described in this model by their expression of SYK and the NKR, suggesting a similar mechanism of lymphomagenesis and establishing a rationale for clinical studies targeting such molecules.

Keywords: Hematology; Immunology; Lymphomas; T cell receptor; T cells.


Conflict of interest statement

Conflict of interest: MB is a former employee of Innate Pharma.

Figures

Figure 1
Figure 1. Chronic TCR stimulation promotes T cell lymphomagenesis.
(A) Kaplan-Meier survival curves for CD3ε–/– mice receiving WT cells (WT>CD3εKO, squares, n = 20) or p53–/– T cells (p53KO>CD3εKO, circles, n = 80) and for WT (C57BL6 CD451.1) mice receiving p53–/– T cells (CD451.2) (p53KO>WT, triangle, n = 11). In the WT>CD3εKO group, recipient mice alive on day 450 were sacrificed and evaluated. For the p53KO>WT group, all mice were still alive 450 days after transfer. ****P < 0.0001, by log-rank test and Holm’s post hoc correction. For the p53KO>CD3εKO group, the circles are colored according to the mouse’s cause of death: data points for mice that died of PTCL are shown in red, thymic lymphomas (TL) in black, and others (no lymphoma) in white. (B) Spectrum of causes of death for p53KO>CD3εKO or WT>CD3εKO mice. Mice alive on day 450 were categorized as “alive” and were then sacrificed. (C) Representative histological micrographs of formalin-fixed, H&E- or anti-CD3–stained liver, spleen, and LNs obtained from a mPTCL. Scale bars: 100 μm; 400 μm. (D) Pie chart representation of TCRVβ clonality in 3 representative mPTCL samples among 16 tested. (E) Surface expression of CD62L, CD44, CD122, CD54, and B220 measured by flow cytometry (ΔMFI) in mPTCL cells (n = 26) compared with normal T cells (n = 3). P values were determined by Mann-Whitney U test comparing mPTCL cells with control T cells.
Figure 2
Figure 2. TCR stimulation is required for lymphomagenesis but dispensable for mPTCL survival.
(A) Heatmap of all genes included in the GSEA for the TCR signaling pathway in mPTCL cells compared with normal resting and activated T cells. (B) GSEA of a set of genes from the TCR signaling pathway. The downward deflection indicates enrichment of the TCR signaling pathway signature in normal T cells (P = 0.007, nominal permutation P value based on 1000 permutations). NES, normalized enrichment score. (C) Kaplan-Meier survival curves for WT mice receiving mPTCL cells and treated with CsA (20 mg/kg; n = 5) or vehicle alone (Ctrl; n = 5). P value was determined by log-rank test. Shown are results from 1 representative experiment among 3 tested with different PTCLs. (D) Kaplan-Meier survival curves for WT mice (n = 5 for each group) transferred with mPTCL cells genetically invalidated for Cd3e or Ilr2b using Alt-R CRISPR/Cas9 sgRNA targeting either of these genes, or transfected with control sgRNA (sgCtrl). *P < 0.05, by log-rank test and Holm’s post hoc correction. Data are representative of 2 independent experiments using different mPTCL cells.
Figure 3
Figure 3. SYK and downstream signaling pathways are constitutively activated in mPTCLs.
(A) Volcano plot representation of the PamGene GeneGO analysis of tyrosine kinase activation in mPTCL cells (n = 18) compared with normal T cells (n = 3). The peptide contribution to upstream kinases was determined. (B) Western blots show the expression of SYK and ZAP70, as well as the expression and activation of PLCγ1, PLCγ2, AKT, and ERK in mPTCL cells compared with purified and stimulated (stim) normal B and T cells from WT mice, used as positive control. GAPDH was used as a loading control. (C) Representative FACS analysis of SYK tyrosine phosphorylation (pY342-SYK ) in mPTCL cells (red) in the basal state (red solid line) and after SYK pharmacological inhibition with P505-15 (red dashed line), as well as in control B cells (blue) in the basal state (blue dashed line) and after B cell receptor (BCR) stimulation (blue solid line), as measured by flow cytometry. Associated scatter plot shows SYK tyrosine phosphorylation expressed as the ΔMFI between basal and P505-15–treated mPTCL cells (n = 8) compared with the ΔMFI between basal and BCR-stimulated B cells (n = 3), or between basal and TCR-stimulated T cells (n = 3). (D) Representative FACS analysis of pS235–236-S6 in mPTCL cells (red) or control T cells (gray) in the basal state (solid lines), as well as after mTORC1 pharmacological inhibition with rapamycin (dash lines). Associated scatter plot shows the ΔMFI between basal and rapamycin-treated conditions in mPTCL cells (n = 6) compared with T cells (n = 3). (E) Immunohistochemical staining for CD3, SYK, and PLCγ2 in representative mPTCL cells (liver). Scale bars: 100 μm. (F) Immunohistochemical staining for CD30, SYK, and PLCγ2 in representative human ALK+ ALCL. (G) SYK and PLCγ2 expression in lymphoma cells from 7 different entities of human PTCLs. The TFH-PTCLs include AITL and PTCL-NOS with TFH-like features according to the 2016 WHO classification.
Figure 4
Figure 4. Murine PTCLs downregulate T cell genes and express a NK-like transcriptome.
(A) Volcano plot of genes differentially expressed between mPTCL cells (n = 9) and normal T cells (n = 6). The vertical black lines delimit the 2-FC effects. Upregulated genes in mPTCL cells compared with normal T cells are located on the right and downregulated genes on the left. Informative upregulated genes have been color-coded in red and the downregulated in blue. (B) Unsupervised clustering (using the Euclidean distance, Ward agglomeration method) based on the 1% of genes most variably expressed between immature and mature T cell populations as well as mature NK cells (data are from ImmGen and our own cohort). This clustering analysis generated 3 gene clusters (1, 2, and 3), defined on the left of the panel. (C) Representation of the 5 most highly significant C2 (Molecular Signatures Database [MSigDB]) gene set names of the 3 different gene clusters defined in B. (D) Comparison of genes differentially expressed between normal NK and T cells (y axis) and mPTCLs and normal T cells (x axis). Yellow dots correspond to genes differentially expressed, at a multiple-testing, adjusted P value of 0.05, between NK and T cells; blue dots correspond to genes differentially expressed between mPTCLs and T cells; and green dots represent genes differentially expressed in both conditions. The names of some of the most informative genes are indicated in the upper-right and lower-left quadrants.
Figure 5
Figure 5. Epigenetic reprogramming of mPTCLs into NK-like cells.
(A) Unsupervised clustering (Euclidean distance, Ward agglomeration method) of mPTCL cells, immature and mature T cell populations, as well as mature NK cells from ImmGen and from our own cohort, based on the normalized accessibility of all 98,375 OCRs identified in ATAC-Seq. (B) Each bar represents a gene expression–based signature of a specific mouse cell population in the ImmGen atlas, colored according to broader population classes. Bar lengths (x axis) indicate the statistical significance of the overlap between genes in the signature and genes with differential chromatin accessibility in ATAC-Seq between mPTCL cells and normal T cells (ToppFun coexpression test FDR < 0.01). Cell populations whose representative genes harbor OCRs more accessible in normal T cells and mPTCL cells are presented respectively in the left and right panels. (C) Heatmap of chromatin accessibility in the 51 OCRs located in the promoter regions of genes involved in NK signatures presented in Figure 4E. (D) ATAC-Seq tracks from normal T cells, NKT cells, and NK cells, as well as mPTCL cells around Tyrobp and Ncr1 (average TMM-normalized CPMs per group in 50 bp wide bins). OCRs surrounded in red are significantly different (FDR < 5%) between conditions (mPTCL ≠ T and NKT; NK ≠ T and NKT).
Figure 6
Figure 6. Murine and human PTCLs express NKRs.
(A) Representative histograms of NK1.1, NKp46, NKG2D, KLRG1, Ly49C, and NKG2A expression measured by flow cytometry in a single mPTCL. Associated scatter plots show expression in T cells (n = 5), NK cells (n = 5), and mPTCL cells (n = 23) for each NKR. P values were determined by Mann-Whitney U test comparing mPTCL cells and normal T cells. (B) Representative histograms of NKR expression in 2 human PTCLs measured by flow cytometry. (C) Scatter plot of expression of 8 different NKRs in 8 human PTCL entities established from the flow cytometric studies depicted in B. TFH-PTCL encompasses AITL and PTCL-NOS with TFH-like features according to the 2016 WHO classification. LNH NK, non-Hodgkin lymphoma from NK cells; T-PLL, T cell prolymphocytic leukemia.
Figure 7
Figure 7. NKRs are functional and signal through SYK in mPTCLs.
(A) Western blots showing expression of the adaptor proteins FcεRIg and DAP12 in 9 mPTCL samples. Enriched NK cells and sorted B and T cells were used as positive and negative controls, respectively. GAPDH was used as a loading control. (B) Representative FACS analysis of CD107a and IFN-γ expression in a cytotoxicity assay of mPTCL cells in the basal state and after NKaR or TCR-CD3 complex activation. Scatter plot shows CD107a (black) and IFN-γ (red) expression in the basal state (n = 12), after anti-CD3/anti-CD28 (n = 9, PTCL cells expressing low levels of CD3 were not analyzed) and after NKR activation (n = 12) (right panel). *P < 0.05, **P < 0.01, ***P < 0.001, and ****P < 0.0001, by Mann-Whitney U test with Holm’s post hoc correction. (C) Representative FACS analysis of CD107a and IFN-γ expression in mPTCL cells in the basal state or activated with anti-CD3/CD28 (α-CD3) or anti-NKaR (α-NKaRs) in the presence of vehicle or P505-15. Data are representative of 2 different mPTCLs. (D) Representative FACS analysis of granzyme B expression in mPTCL cells (red) compared with staining with an isotype control (black). Scatter plot shows granzyme B expression in normal T cells (n = 3), NK cells (n = 3), and mPTCL cells (n = 9). *P < 0.05, by Mann-Whitney U test comparing mPTCL cells and normal T cells. (E) Western blots show pY1217-PLCγ2 and total PLCγ2 expression in a representative mPTCL in the basal state and after NKaR in vitro activation in the presence of vehicle or P505-15. The relative phosphorylation of pY1217-PLCγ2/total PLCγ2 of 4 mPTCLs was quantified in these different conditions. Sorted stimulated B and T cells from WT mice were used as positive and negative controls, respectively. GAPDH was used as a loading control. *P < 0.05, by Mann-Whitney U test.
Figure 8
Figure 8. mPTCL cells rely on NKaR signaling for survival.
(A) Kaplan-Meier survival curves for WT mice (n = 5 for each group) transferred with mPTCL cells genetically invalidated for Klrk1 (sgNKG2D), Ncr1 (sgNKp46), or both, using Alt-R CRISPR/Cas9 sgRNA targeting these genes, or transfected with control sgRNA. **P < 0.01, by log-rank test with Holm’s post hoc correction. Data are representative of 2 independent experiments using different mPTCL cells. (B) Kaplan-Meier survival curves for mPTCL-bearing NSG mice treated with isotype control or anti-NKp46– and anti-NKG2D–blocking mAbs alone or in combination (n = 6 for each group). **P < 0.01, by log-rank test with Holm’s post hoc correction. Data are representative of 3 independent experiments using different PTCLs. (C) Representative 3D reconstruction of spleen and liver of mPTCL-bearing NSG mice treated with isotype control or a combination of anti-NKp46– and anti-NKG2D–blocking mAbs and sacrificed 12 days after PTCL transfer for analysis. (D) Spleen and liver volumes of mPTCL-bearing NSG mice treated with a combination of anti-NKp46– and anti-NKG2D–blocking mAbs or isotype control 12 days after PTCL transfer (isotype control group, n = 5; mAb-treated group, n = 5). P values were determined by Mann-Whitney U test. (E) FACS analysis of p-SYK, p-PLCγ2, p-AKT, and p-S6 and associated scatter plots of mPTCL cells from PTCL-bearing mice treated with anti-NKG2D– and anti-NKp46–blocking mAbs (n = 4) or isotype control (n = 4). (F) Kaplan-Meier survival curves for WT mice (n = 5 for each group) transferred with mPTCL cells genetically invalidated for Syk (sgSYK) or transfected with control sgRNA. P value was determined by log-rank test. Data are representative of 2 independent experiments using different mPTCLs. (G) Kaplan-Meier survival curves for mPTCL-bearing NSG mice treated with vehicle alone (Ctrl) or with either P505-15 (20 mg/kg) or cerdulatinib (20 mg/kg). *P < 0.05 and **P < 0.01, by log-rank test with Holm’s post hoc correction. Data are representative of 2 independent experiments using different PTCLs. (H) Kaplan-Meier survival curves for mPTCL-bearing NSG mice treated with vehicle control or rapamycin. P value was determined by log-rank test. Data are representative of 2 independent experiments using different PTCLs.

Similar articles

Cited by

References

    1. Swerdlow SH, et al. The 2016 revision of the World Health Organization classification of lymphoid neoplasms. Blood. 2016;127(20):2375–2390. doi: 10.1182/blood-2016-01-643569. - DOI - PMC - PubMed
    1. Fiore D, et al. Peripheral T cell lymphomas: from the bench to the clinic. Nat Rev Cancer. 2020;20(6):323–342. doi: 10.1038/s41568-020-0247-0. - DOI - PubMed
    1. Pechloff K, et al. The fusion kinase ITK-SYK mimics a T cell receptor signal and drives oncogenesis in conditional mouse models of peripheral T cell lymphoma. J Exp Med. 2010;207(5):1031–1044. doi: 10.1084/jem.20092042. - DOI - PMC - PubMed
    1. Choi J, et al. Genomic landscape of cutaneous T cell lymphoma. Nat Genet. 2015;47(9):1011–1019. doi: 10.1038/ng.3356. - DOI - PMC - PubMed
    1. Ungewickell A, et al. Genomic analysis of mycosis fungoides and Sézary syndrome identifies recurrent alterations in TNFR2. Nat Genet. 2015;47(9):1056–1060. doi: 10.1038/ng.3370. - DOI - PMC - PubMed

Publication types

MeSH terms