. 2021 Jul 1;131(13):e139570.
doi: 10.1172/JCI139570.

Astrocytes propel neurovascular dysfunction during cerebral cavernous malformation lesion formation

Affiliations

Astrocytes propel neurovascular dysfunction during cerebral cavernous malformation lesion formation

Miguel Alejandro Lopez-Ramirez et al. J Clin Invest. .

Abstract

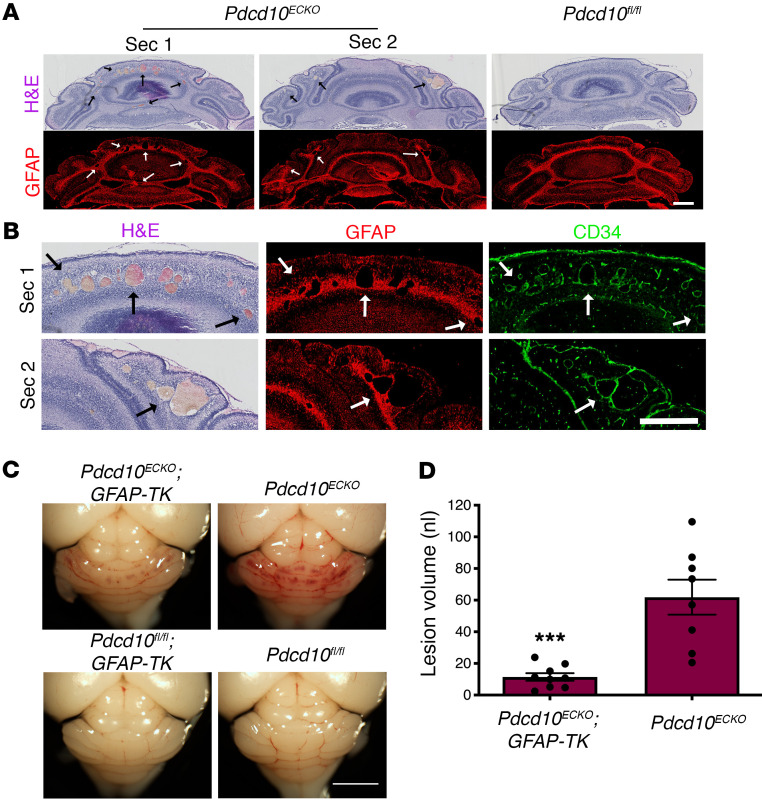
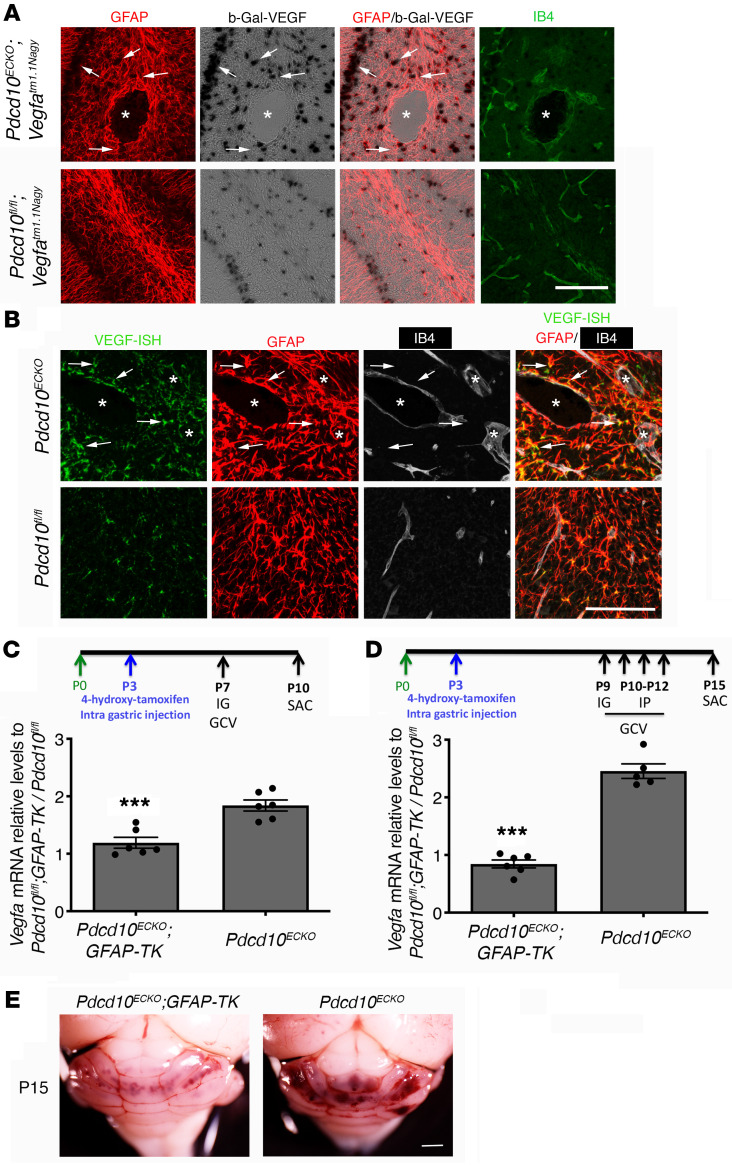
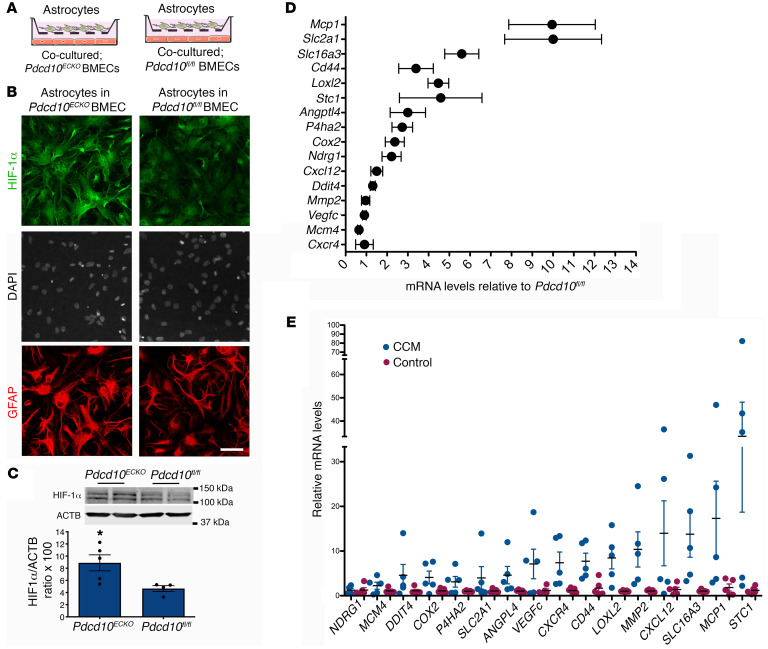
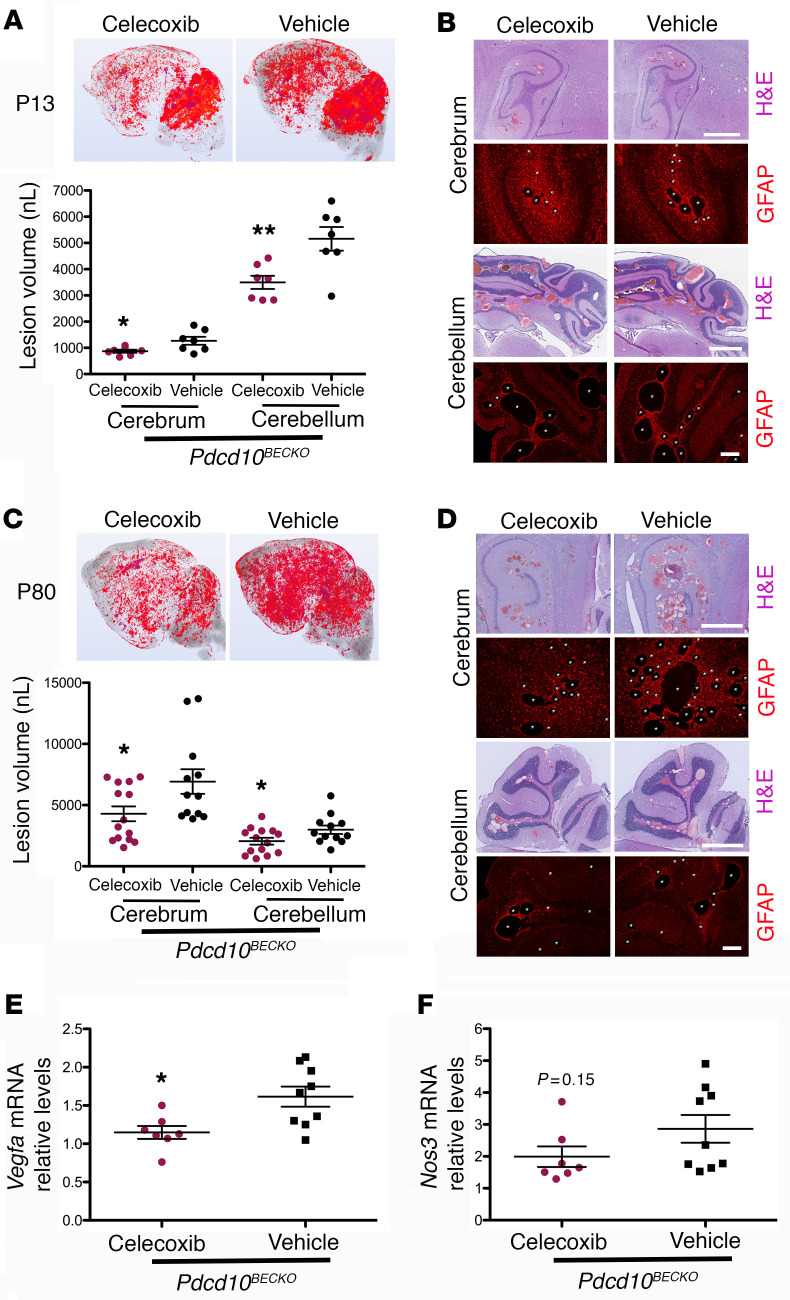
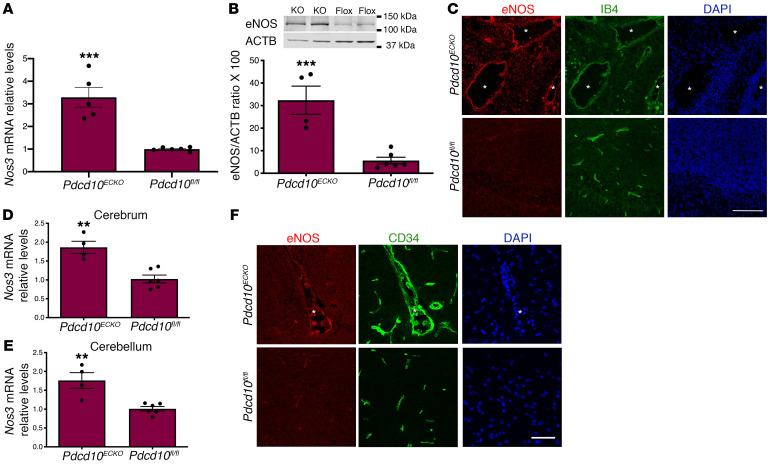
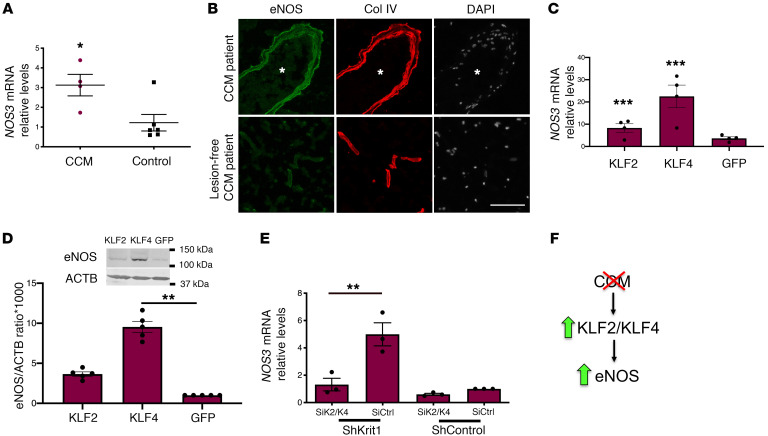
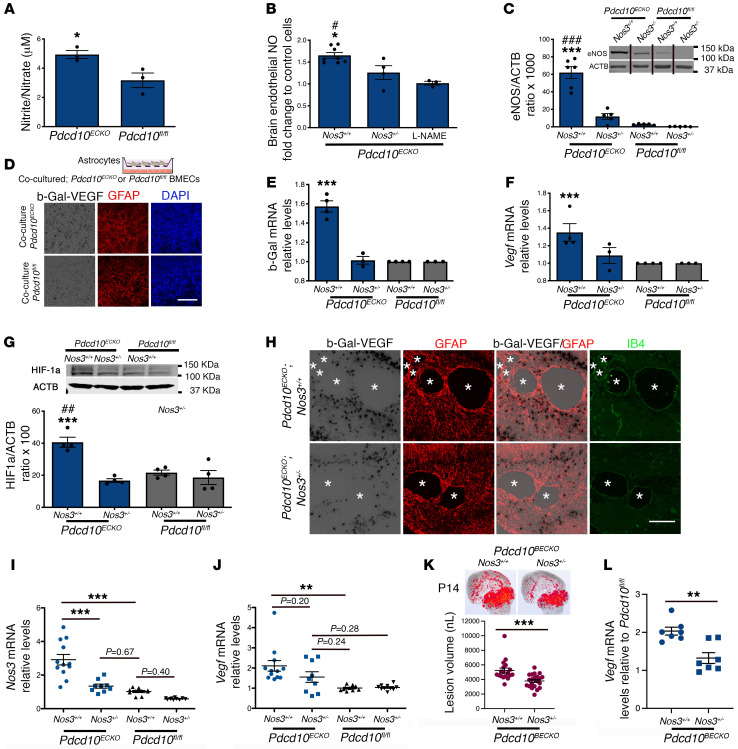
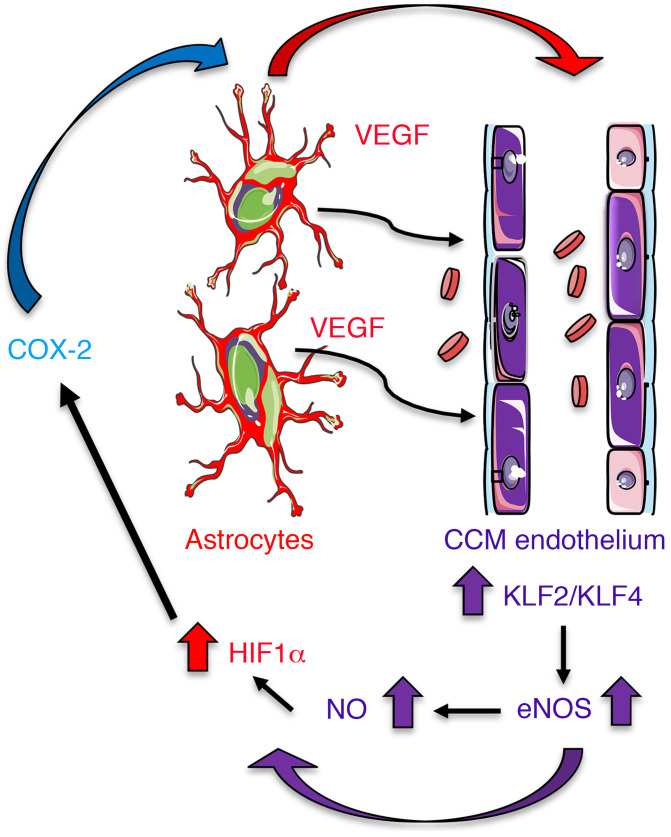
Cerebral cavernous malformations (CCMs) are common neurovascular lesions caused by loss-of-function mutations in 1 of 3 genes, including KRIT1 (CCM1), CCM2, and PDCD10 (CCM3), and generally regarded as an endothelial cell-autonomous disease. Here we reported that proliferative astrocytes played a critical role in CCM pathogenesis by serving as a major source of VEGF during CCM lesion formation. An increase in astrocyte VEGF synthesis is driven by endothelial nitric oxide (NO) generated as a consequence of KLF2- and KLF4-dependent elevation of eNOS in CCM endothelium. The increased brain endothelial production of NO stabilized HIF-1α in astrocytes, resulting in increased VEGF production and expression of a "hypoxic" program under normoxic conditions. We showed that the upregulation of cyclooxygenase-2 (COX-2), a direct HIF-1α target gene and a known component of the hypoxic program, contributed to the development of CCM lesions because the administration of a COX-2 inhibitor significantly prevented the progression of CCM lesions. Thus, non-cell-autonomous crosstalk between CCM endothelium and astrocytes propels vascular lesion development, and components of the hypoxic program represent potential therapeutic targets for CCMs.

Keywords: Angiogenesis; Cardiovascular disease; Cell Biology; Hypoxia; Nitric oxide.


Conflict of interest statement

Conflict of interest: The authors have declared that no conflict of interest exists.

Figures

Figure 1
Figure 1. Astrocytes contribute to cerebral cavernous malformation development.
(A) Histological analysis of cerebellar sections from P9 Pdcd10ECKO and littermate control Pdcd10fl/fl mice. Low magnification of CCM lesions detected in sections stained by hematoxylin and eosin. CCM lesions spatially developed on fibrous astrocyte areas positive for GFAP immunostaining (red). Arrows indicate CCM lesions. (B) Magnified region from sections 1 and 2 (Sec1 and Sec2) from Pdcd10ECKO mice in (A). Dramatic vascular dilation is shown with immunohistochemistry for the endothelial marker CD34 (green). Arrows indicate CCM lesions. (C) Administration of 1.5 mg/kg GCV in neonatal mice at P7 markedly reduced vascular lesions in P9 Pdcd10ECKO GFAP-TK hindbrains when compared with GCV-treated littermate Pdcd10ECKO controls. (D) Quantification of lesion volumes by micro-CT analysis from mice in experiments showed in (C); n = 8 or 9 mice in each group. Data are mean ± SEM. ***P < 0.001, as determined by Student’s t test. Scale bars: 500 μm (A and B); 2 mm (C).
Figure 2
Figure 2. Astrocyte-derived VEGF increased during cerebral cavernous malformation development.
(A) Confocal microscopy of cerebellar cortex from P10 Pdcd10ECKO and littermate control Pdcd10fl/fl mice stained for GFAP-positive astrocytes (red), β-gal/VEGF expression detected by X-gal staining (black), and endothelial marker isolectin B4 (green). Asterisk indicates vascular lumen of CCM lesion. Arrows indicate β-gal/VEGF in GFAP-positive astrocytes (n = 4). (B) ISH for VEGF (green) combined with immunohistochemistry to identify GFAP-positive astrocytes (red), endothelial marker isolectin B4 (IB4; white). Asterisk indicates vascular lumen of CCM lesion. Arrows indicate VEGF and GFAP-positive astrocyte colocalization (n = 2). (C) Quantification of Vegfa mRNA levels in P10 Pdcd10ECKO GFAP-TK and Pdcd10ECKO hindbrains when compared with littermate Pdcd10fl/fl GFAP-TK or Pdcd10fl/fl controls, respectively, as assessed by RT-qPCR. All mice received IG administration of 1.5 mg/kg GCV in neonatal at P7 (SEM, n = 6 mice in each group). (D) Quantification of Vegfa mRNA levels in P15 Pdcd10ECKO GFAP-TK and Pdcd10ECKO hindbrains when compared with littermate Pdcd10fl/fl GFAP-TK or Pdcd10fl/fl controls, respectively, as assessed by RT-qPCR. All mice received IG administration of 1.5 mg/kg GCV in neonatal at P9 and 3 consecutive doses of IP 1.5 mg/kg GCV at P10 to P12 (SEM, n = 5 or 6 mice in each group). (E) Prominent lesions are present in the cerebellum of P15 GCV-treated Pdcd10ECKO mice, whereas extensive reduction in lesions are observed in GCV-treated Pdcd10ECKO GFAP-TK littermate mice (n = 6 or 7). Data are mean ± SEM. ***P < 0.001 (comparison to Pdcd10ECKO littermates); determine by Student’s t test. Scale bars: 100 μm (A and B).
Figure 3
Figure 3. Astrocyte-derived VEGF increased during cerebral cavernous malformations in juvenile animal brain.
(A) Confocal microscopy of brain (cerebellum and cerebrum cortex) from Pdcd10ECKO Vegfatm1.1Nagy and Pdcd10fl/fl Vegfatm1.1Nagy littermate controls stained for β-gal/VEGF expression detected by X-gal staining (black), GFAP-positive astrocytes (red), isolectin B4 (green), and DAPI for nuclear DNA (blue). Asterisks indicate vascular lumen of CCM lesions. Arrows indicate β-gal/VEGF in GFAP-positive astrocytes. (B and C) Quantification of Vegfa mRNA levels in Pdcd10ECKO brains when compared with littermate Pdcd10fl/fl controls, as assessed by RT-qPCR (SEM, n = 4 or 6 mice in each group). (D) VEGF levels in plasma from Pdcd10ECKO mice and littermate Pdcd10fl/fl controls, as assessed by ELISA. n = 8 or 11 mice in each group. Data are mean ± SEM. *P < 0.05, as determined by Student’s t test. Scale bar: 100 μm (A).
Figure 4
Figure 4. Increase in normoxic HIF-1α stabilization in astrocytes and COX-2 during CCM.
(A) Schematic diagram of astrocytes cocultured with Pdcd10ECKO and Pdcd10fl/fl BMECs. (B) Immunofluorescence staining for HIF-1α (green), GFAP (red), and DAPI for nuclear DNA (white) of primary astrocytes cocultured with Pdcd10ECKO BMECs compared with Pdcd10fl/fl BMEC controls for 48 hours (n = 3). (C) Quantification of HIF-1α in cerebellar tissue in P10 Pdcd10ECKO control Pdcd10fl/fl littermates, as assessed by Western blot (SEM, n = 4 mice in each group). (D) Analysis of HIF-1α target genes by RT-qPCR in cerebellar tissue from P10 Pdcd10ECKO and control Pdcd10fl/fl littermates (SEM, n = 5 or 7 mice in each group). (E) Analysis of HIF-1α target genes by RT-qPCR in human CCM lesions and control human brain tissue (SEM, n = 5). Data are mean ± SEM. *P < 0.05, as determined by Student’s t test. Scale bar: 50 μm (B).
Figure 5
Figure 5. COX-2 inhibition prevents CCM lesions in Pdcd10BECKO mice.
(A) Prominent lesions are present in the cerebellum and cerebrum of P13 Pdcd10BECKO mice. Intragastric administration of 40 mg/kg celecoxib for 4 consecutive days at P6 to P9 suppressed lesion formation. Quantification of lesion volumes by micro-CT analysis from mice at P13 treated with celecoxib or vehicle (SEM, n = 7 mice in each group). (B) Hematoxylin and eosin (pink and purple) or GFAP (red) staining of cerebral (hippocampal area) and cerebellar sections from Pdcd10BECKO mice after treatment with celecoxib or vehicle (n = 3). (C) Prominent lesions are present in the cerebellum and cerebrum of P80 Pdcd10BECKO mice. Oral gavage administration of 40 mg/kg celecoxib for 15 consecutive days at P55 to P70 suppressed lesion formation. Quantification of lesion volumes by micro-CT analysis from mice at P80 treated with celecoxib or vehicle (SEM, n = 12 or 14 mice in each group). (D) Hematoxylin and eosin (pink and purple) or GFAP (red) staining of cerebral (hippocampal area) and cerebellar sections from Pdcd10BECKO mice after treatment with celecoxib or vehicle (n = 3). (E and F) Quantification of Vegfa (E) or Nos3 (F) mRNA levels in P80 Pdcd10BECKO spinal cords after treatment with celecoxib or vehicle from experiments in (C) (SEM, n = 7 or 9 mice in each group). Data are mean ± SEM. *P < 0.05, **P < 0.01, as determined by Student’s t test. Scale bars: 1 mm (H&E), 200 μm (GFAP) (B and D).
Figure 6
Figure 6. Loss of brain endothelial Pdcd10 increases the expression of eNOS in situ.
(A) Analysis of Nos3 mRNA levels by RT-qPCR in hindbrains of P10 Pdcd10ECKO and littermate Pdcd10fl/fl controls (SEM, n = 4 or 5 mice in each group). (B) Analysis of eNOS levels in hindbrains of P10 Pdcd10ECKO and littermate Pdcd10fl/fl controls, as assessed by Western blot analysis (SEM, n = 4 or 5 mice in each group). (C) Confocal microscopy of cerebellar cortex P10 stained for eNOS (red), endothelial marker isolectin B4 (green), and DAPI for nuclear DNA (blue). Asterisks indicate vascular lumen of CCM lesions (n = 4 mice in each group). (D and E) Analysis of Nos3 mRNA levels by RT-qPCR in brains of P30 Pdcd10ECKO and littermate Pdcd10fl/fl controls. (F) Immunofluorescence staining of eNOS (red), endothelial marker cd34 (green), and DAPI for nuclear DNA (blue) (n = 4 or 6 mice in each group). Data are mean ± SEM. **P < 0.01, ***P < 0.001, as determined by Student’s t test. Scale bars: 100 μm (C); 50 μm (F).
Figure 7
Figure 7. KLF2 and KLF4 regulate increased eNOS expression during CCM.
(A) Expression levels of NOS3 mRNA as assessed by RT-qPCR from human CCM lesions and compared with nonneurological disease controls (SEM, n = 4 or 6 in each group). (B) Immunofluorescence staining of eNOS (green) and collagen IV (Col IV; red) of human CCM lesion matched to CCM lesion-free brain tissue (n = 3). Asterisks denotate vascular lumen of CCM lesion. Nuclei were counterstained with DAPI (white). (C) Human umbilical vein endothelial cells (HUVECs) were transduced with lentivirus encoding KLF2 or KLF4, as previously reported (6), and analysis of NOS3 mRNA levels by RT-qPCR was determined in cells overexpressing KLF2 or KLF4 and compared with lentivirus encoding GFP as a control (n = 3 or 4). (D) Analysis of eNOS protein levels in HUVECs transduced with lentivirus encoding KLF2 or KLF4, as determined by Western blot analysis (40); lentivirus encoding GFP was used as a control (SEM, n = 3). (E) Analysis of NOS3 mRNA levels by RT-qPCR in hCMEC/D3 cells transduced with lentivirus encoding shKRIT1 or scrambled control, followed by transfection with KLF2- and KLF4-specific small interfering RNAs (siRNA; siK2/K4) or small interfering RNA control (siCtrl) (SEM, n = 4). (F) Schematic model. KLF2- and KLF4-mediated elevation of eNOS in CCM endothelium by a cell-autonomous mechanism. Data are mean ± SEM. **P < 0.01, ***P < 0.001, as determined by Student’s t test and 1-way ANOVA, followed by the Tukey post hoc test. Scale bar: 100 μm (B).
Figure 8
Figure 8. Loss of brain endothelial Pdcd10 increases NO production and induces astrocyte-derived VEGF.
(A) Total NO production from the media of Pdcd10ECKO and Pdcd10fl/fl BMECs cultured for 36 hours (SEM, n = 7). (B) NO release in Pdcd10ECKO and Pdcd10ECKO Nos3+/– BMECs or following incubation with L-NAME (150 μM) (SEM, n = 3). (C) Quantification of eNOS protein from Pdcd10ECKO and Pdcd10ECKO Nos3+/– BMECs (SEM, n = 5). Culture media was supplemented with 500 uM l-arginine and was deficient in serum. Lanes in this panel were run on the same gel but were noncontiguous. (D) β-gal/VEGF expression (black) and staining for GFAP (red) of primary cultured astrocytes cocultured with Pdcd10ECKO BMECs compared with Pdcd10fl/fl BMEC controls for 48 hours (n = 2). (E) RT-qPCR analysis of β-gal and (F) Vegfa mRNA in primary cultured astrocytes cocultured with Pdcd10ECKO BMEC compared with Pdcd10fl/fl BMEC controls (SEM, n = 4). (G) Quantification of HIF-1α protein from primary astrocytes cocultured with Pdcd10ECKO BMEC and Pdcd10ECKO Nos3+/– BMECs (SEM, n = 4). (H) Neonatal hindbrain at P10 from Pdcd10ECKO Nos3+/+ Vegfatm1.1Nagy (Pdcd10ECKO eNOS+/+) and Pdcd10fl/fl Nos3+/– Vegfatm1.1Nagy (Pdcd10ECKO eNOS+/–) littermate controls stained for GFAP-positive astrocytes (red), β-gal/VEGF (black), isolectin B4 (green). Asterisks indicate vascular lumen of CCM lesions (n = 3). (I and J) Quantification of Nos3 (I) and Vegf (J) mRNA levels in P10 Pdcd10ECKO Nos3+/– and Pdcd10ECKO and Pdcd10fl/fl Nos3+/– hindbrains when compared with littermate Pdcd10fl/fl controls, as assessed by RT-qPCR (SEM, n = 9 or 12 mice in each group). (K) Micro-CT analysis from mice at P14 Pdcd10BECKO Nos3+/+ and Pdcd10BECKO Nos3+/– mice (SEM, n =18 or 21 mice in each group). (L) Vegf mRNA levels in P14 Pdcd10BECKO Nos3+/– and Pdcd10BECKO Nos3+/+ cerebral tissue (SEM, n = 7 mice in each group, except for Pdcd10fl/fl Nos3+/+ n = 2). Data are mean ± SEM. *, #P < 0.05, ##P < 0.01, ***, ###P < 0.001 (*comparison to Pdcd10ECKO Nos3+/– and #comparison to L-NAME or Pdcd10fl/fl eNOs+/+), as determined by Student’s t test and 1-way ANOVA, followed by the Tukey post hoc test. Scale bars: 100 μm (D and H).
Figure 9
Figure 9. Astrocytes integrate a circuit of neurovascular dysfunction during CCM disease.
Model by which astrocytes make a substantial contribution to CCM pathogenesis. An increase in astrocyte VEGF synthesis is driven by endothelial NO generated due to KLF2- and KLF4-dependent elevation of eNOS in CCM endothelium. Production of NO in CCM endothelium stabilizes HIF-1α in astrocytes, resulting in increased VEGF production and expression of a hypoxic program under normoxic conditions. Pharmacological inhibition of HIF1-driven COX-2 can ameliorate murine models of CCM disease.

Similar articles

Cited by

References

    1. Spiegler S, et al. Cerebral cavernous malformations: an update on prevalence, molecular genetic analyses, and genetic counselling. Mol Syndromol. 2018;9(2):60–69. doi: 10.1159/000486292. - DOI - PMC - PubMed
    1. Fischer A, et al. Cerebral cavernous malformations: from CCM genes to endothelial cell homeostasis. Trends Mol Med. 2013;19(5):302–308. doi: 10.1016/j.molmed.2013.02.004. - DOI - PubMed
    1. Leblanc GG, et al. Biology of vascular malformations of the brain. Stroke. 2009;40(12):e694–e702. - PMC - PubMed
    1. Gore AV, et al. Combinatorial interaction between CCM pathway genes precipitates hemorrhagic stroke. Dis Model Mech. 2008;1(4–5):275–281. - PMC - PubMed
    1. Choquet H, et al. Genetics of cerebral cavernous malformations: current status and future prospects. J Neurosurg Sci. 2015;59(3):211–220. - PMC - PubMed

Publication types

MeSH terms