. 2021 Sep 27;38(10):4588-4602.
doi: 10.1093/molbev/msab162.

Inferring Genome-Wide Correlations of Mutation Fitness Effects between Populations

Affiliations

Inferring Genome-Wide Correlations of Mutation Fitness Effects between Populations

Xin Huang et al. Mol Biol Evol. .

Abstract

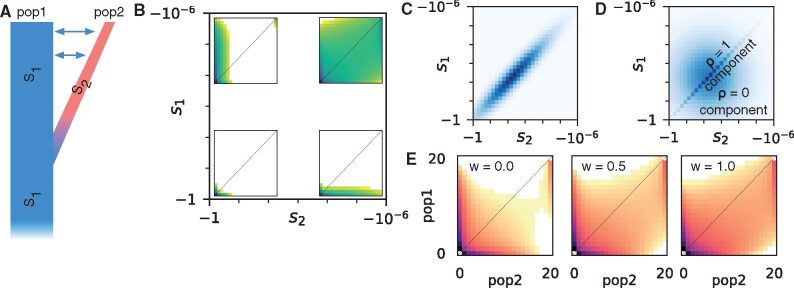
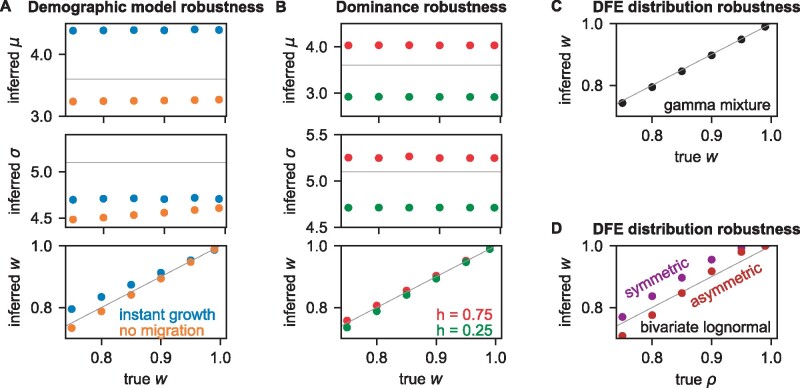
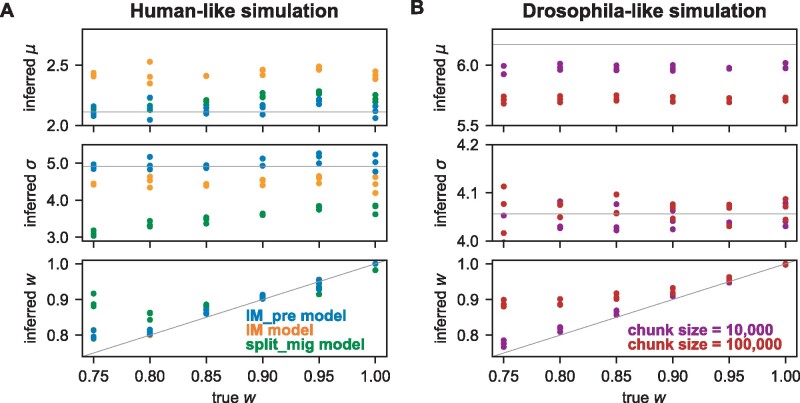
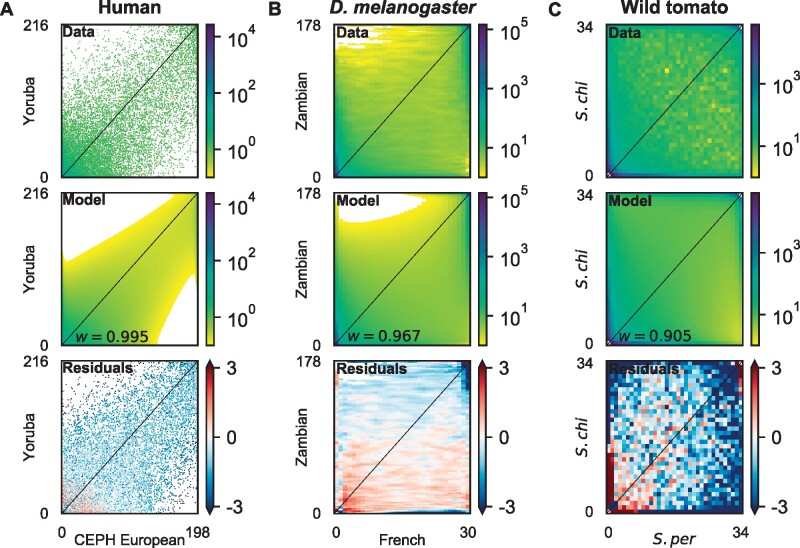
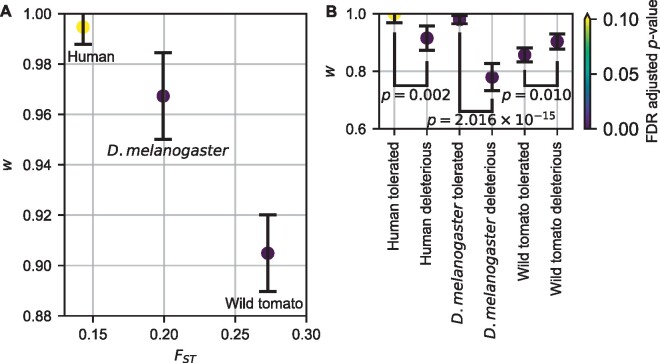
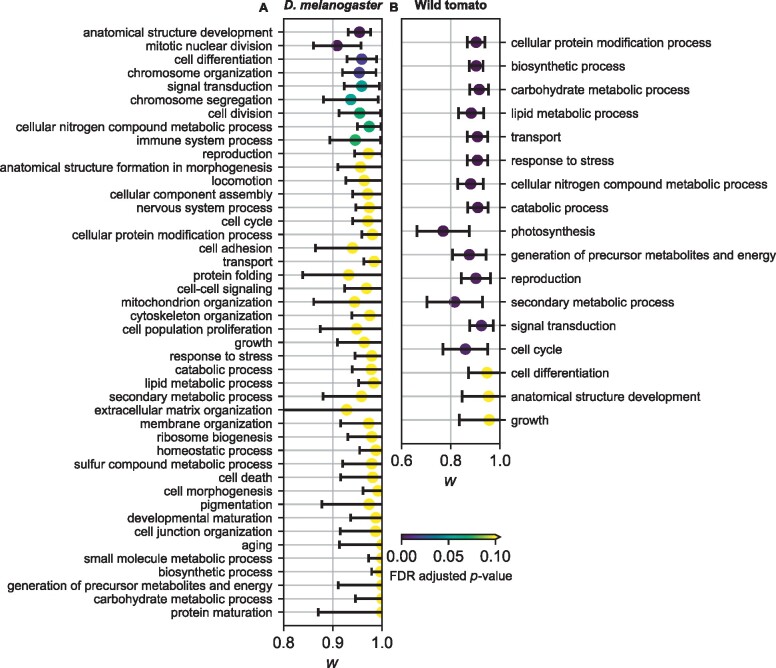
The effect of a mutation on fitness may differ between populations depending on environmental and genetic context, but little is known about the factors that underlie such differences. To quantify genome-wide correlations in mutation fitness effects, we developed a novel concept called a joint distribution of fitness effects (DFE) between populations. We then proposed a new statistic w to measure the DFE correlation between populations. Using simulation, we showed that inferring the DFE correlation from the joint allele frequency spectrum is statistically precise and robust. Using population genomic data, we inferred DFE correlations of populations in humans, Drosophila melanogaster, and wild tomatoes. In these species, we found that the overall correlation of the joint DFE was inversely related to genetic differentiation. In humans and D. melanogaster, deleterious mutations had a lower DFE correlation than tolerated mutations, indicating a complex joint DFE. Altogether, the DFE correlation can be reliably inferred, and it offers extensive insight into the genetics of population divergence.

Keywords: distribution of fitness effects; population divergence; population genetics.


Figures

Fig. 1.
Fig. 1.
The joint allele frequency spectrum (AFS) and joint distribution of fitness effects (DFE). (A) We considered populations that have recently diverged with gene flow between them. Some genetic variants will have a different effect on fitness in the diverged population (s2) than in the ancestral population (s1). (B) The joint DFE is defined over pairs of selection coefficients (s1, s2). Insets show the joint AFS for pairs of variants that are strongly or weakly deleterious in each population. In each spectrum, the number of segregating variants at a given pair of allele frequencies is exponential with the color depth. (C) One potential model for the joint DFE is a bivariate lognormal distribution, illustrated here for strong correlation. (D) We focus on a model in which the joint DFE is a mixture of components corresponding to equality (ρ = 1) and independence (ρ = 0) of fitness effects. (E) As illustrated by these simulated allele frequency spectra, stronger correlations of mutation fitness effects lead to more shared polymorphism. Here, w is the weight of the ρ = 1 component in the mixture model.
Fig. 2.
Fig. 2.
Robustness of joint DFE inference to model misspecification. Simulated neutral and selected data were generated under a demographic model with exponential growth and migration (supplementary table S1, Supplementary Material online), and lognormal mixture DFE models were fit to the data. The DFE parameters are: μ, the mean log population-scaled selection coefficient; σ, the standard deviation of those log coefficients; and w, the correlation of the DFE. The gray lines indicate true values, and the data plotted in these figures can be found in supplementary tables S4–S6, Supplementary Material online. (A) In this case, simpler demographic models with instantaneous growth or symmetric migration were fit to the neutral data. The resulting misspecified model was then used when inferring the DFE. This misspecification biased μ and σ, but not w. (B) In this case, selected data were simulated assuming dominant or recessive mutations, but the DFE was inferred assuming no dominance (h =0.5). Again, μ and σ are biased, but w is not. (C) In this case, selected data were simulated using a mixture of gamma distributions. When these data were fit using our mixture of lognormal distributions, w was not biased. (D) In this case, selected data were simulated using bivariate lognormal models, with either symmetric or asymmetric marginal distributions. When these data were fit using our symmetric mixture of lognormal distributions, w was only slightly biased.
Fig. 3.
Fig. 3.
Robustness of joint DFE inference to background selection. Simulated genome-scale data were generated with background selection and different DFE correlations. (A) Data were simulated using the best fit demographic model for humans in supplementary figure S6A, Supplementary Material online with μ=2.113 and σ=4.915. Beside fitting the true model, simpler demographic models (supplementary fig. S2, Supplementary Material online) were also fit to test robustness to model misspecification in the presence of background selection. (B) Data were simulated using the best fit demographic model for Drosophila melanogaster in supplementary figure S6B, Supplementary Material online with μ=6.174 and σ=4.056. To modulate the strength of background selection, data were simulated with different genomic chunk sizes. The larger chunk size yields stronger background selection. Points indicate inferences from distinct data sets and colors indicate different simulation scenarios. Gray lines indicate true values. The data plotted in these figures can be found in supplementary table S7, Supplementary Material online.
Fig. 4.
Fig. 4.
Model fits to joint allele frequency spectra (AFS) using nonsynonymous data. (A) Joint AFS for the human nonsynonymous data, the best fit model with DFE correlation w =0.995, and the residuals between model and data. (B) Joint AFS for the Drosophila melanogaster nonsynonymous data and the best fit model with DFE correlation w =0.967. (C) Joint AFS for the wild tomato nonsynonymous data and the best fit model with DFE correlation w =0.905. In all three cases, residuals are small for almost all entries in the AFS, so to increase contrast the color range has been restricted to ±3. See supplementary figure S8, Supplementary Material online for plots showing the full residual range.
Fig. 5.
Fig. 5.
Exome-wide DFE correlations. (A) Plotted are maximum likelihood inferences of the DFE correlation w with 95% confidence intervals versus genetic divergence FST of the considered population pair. (B) Plotted are maximum likelihood inferences of the DFE correlation w with 95% confidence intervals for nonsynonymous SNPS with different predicted effects from SIFT. Colors indicate FDR adjusted P-values from two-tailed z-tests as to whether the confidence interval overlaps w =1. FST was estimated using whole-exome synonymous mutations.
Fig. 6.
Fig. 6.
DFE correlation for different GO terms in Drosophila melanogaster and wild tomatoes. Plotted are maximum likelihood inferences with 95% confidence intervals. Colors indicate FDR-adjusted P-values from two-tailed z-tests as to whether the confidence interval overlaps w =1. The data plotted in these figures can be found in supplementary tables S10 and S11, Supplementary Material online. (A) Inferred DFE correlation in D. melanogaster. (B) Inferred DFE correlation in wild tomatoes.

References

    1. 1000 Genomes Project Consortium 2015. A global reference for human genetic variation. Nature 526(7571):68–74. - PMC - PubMed
    1. Amberger JS, Bocchini CA, Schiettecatte F, Scott AF, Hamosh A.. 2015. OMIM.org: Online Mendelian Inheritance in Man (OMIM[textregistered]), an Online catalog of human genes and genetic disorders. Nucleic Acids Res. 43(Database issue):D789–D798. - PMC - PubMed
    1. Arguello JR, Laurent S, Clark AG.. 2019. Demographic history of the human commensal Drosophila melanogaster. Genome Biol Evol. 11(3):844–854. - PMC - PubMed
    1. Balick DJ, Do R, Cassa CA, Reich D, Sunyaev SR.. 2015. Dominance of deleterious alleles controls the response to a population bottleneck. PLoS Genet. 11(8):e1005436. - PMC - PubMed
    1. Barton HJ, Zeng K.. 2018. New methods for inferring the distribution of fitness effects for INDELs and SNPs. Mol Biol Evol. 35(6):1536–1546. - PMC - PubMed

Publication types

LinkOut - more resources