Review
. 2021 Jun 25;6(6):2046-2076.
doi: 10.1021/acssensors.1c00370. Epub 2021 May 27.

Ophthalmic Sensors and Drug Delivery

Affiliations
Review

Ophthalmic Sensors and Drug Delivery

Antonysamy Dennyson Savariraj et al. ACS Sens. .

Abstract

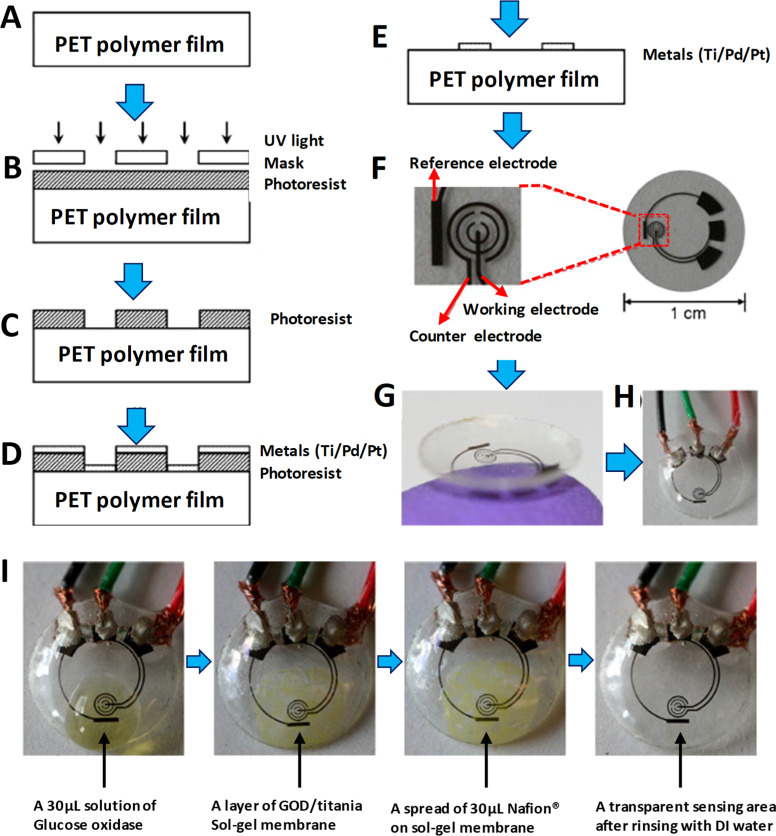
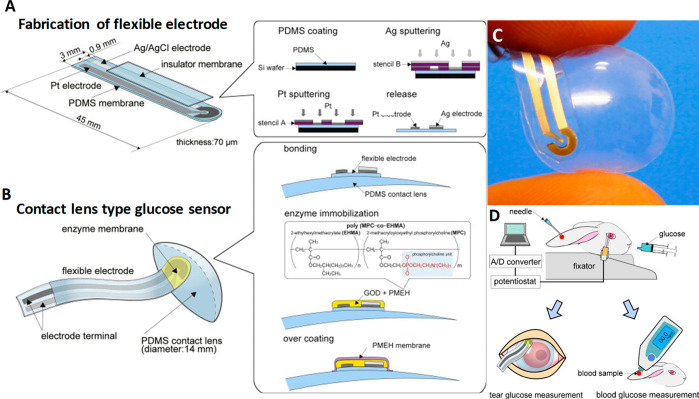
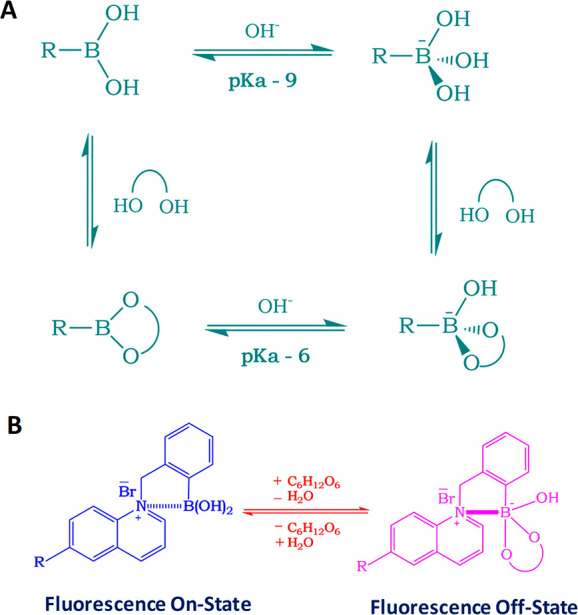
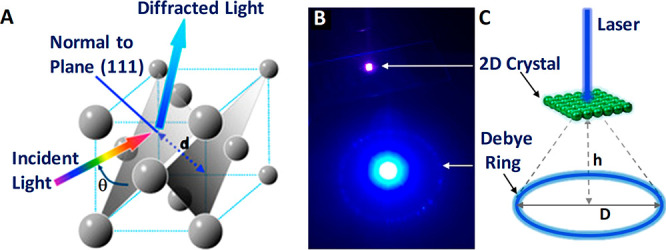
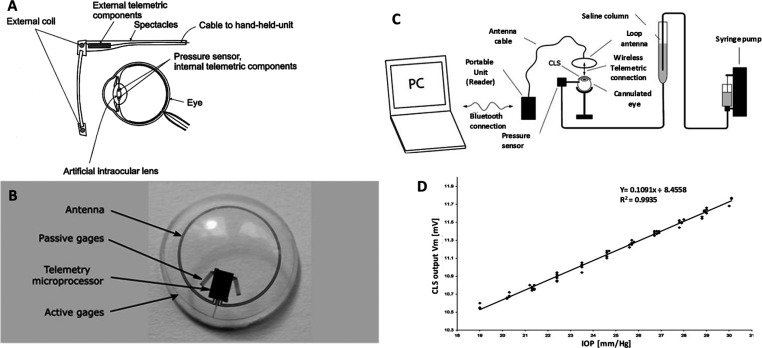
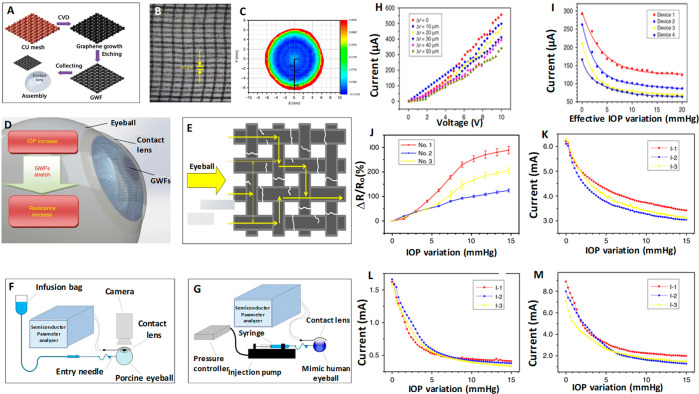
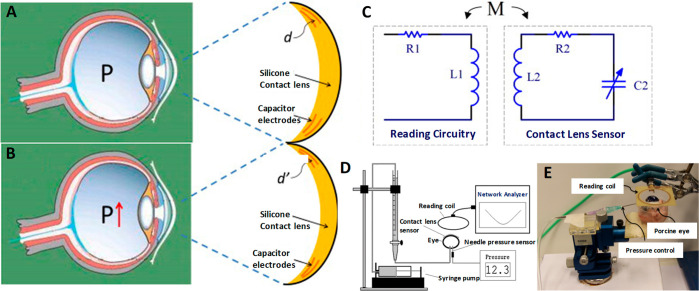
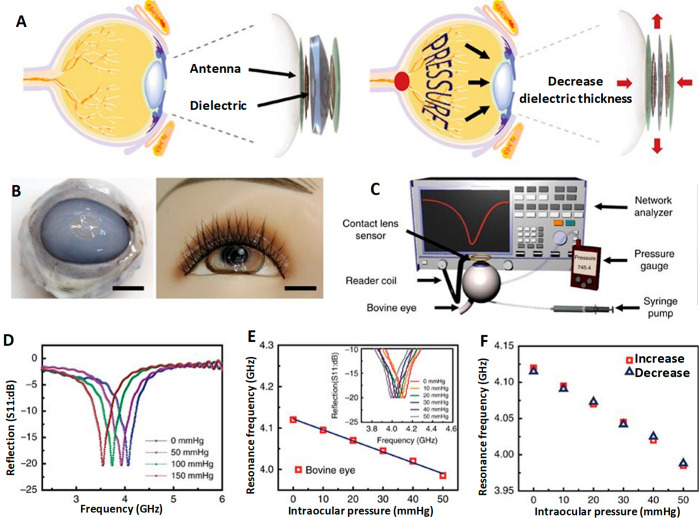
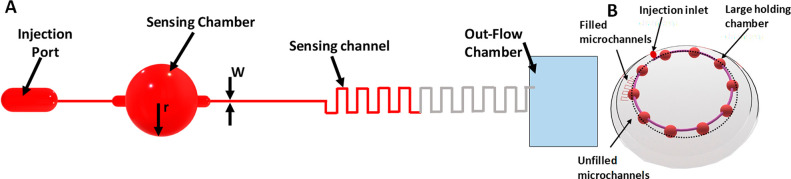
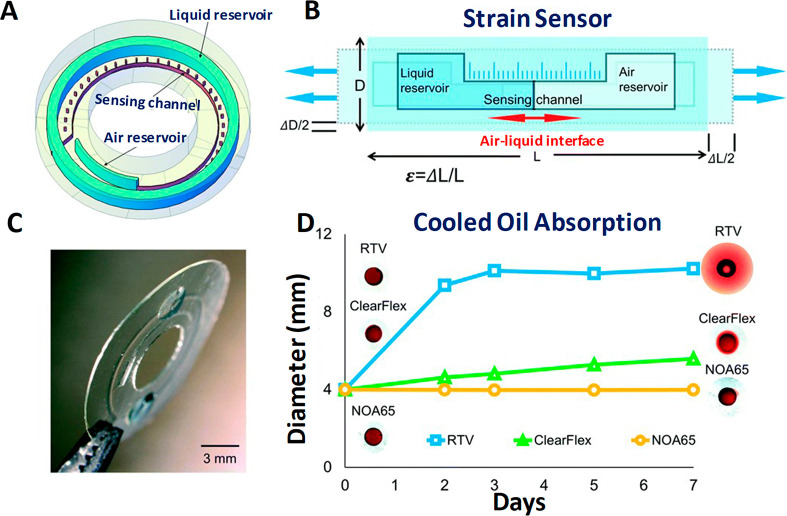
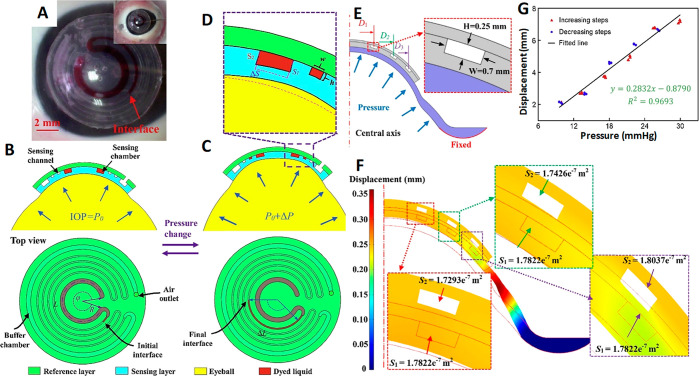
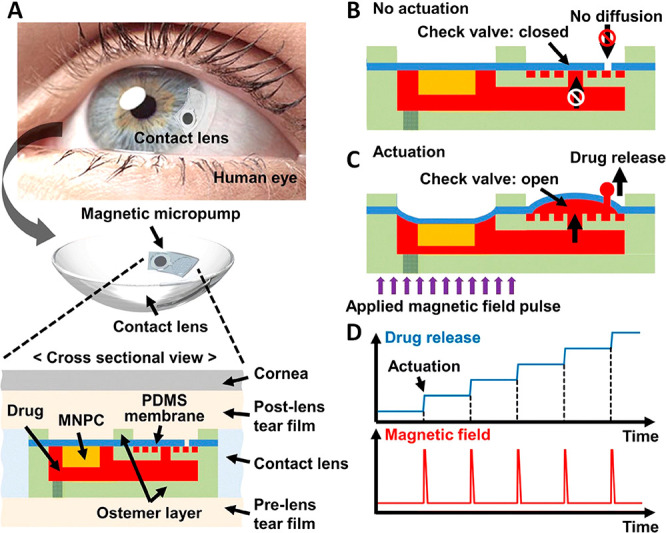
Advances in multifunctional materials and technologies have allowed contact lenses to serve as wearable devices for continuous monitoring of physiological parameters and delivering drugs for ocular diseases. Since the tear fluids comprise a library of biomarkers, direct measurement of different parameters such as concentration of glucose, urea, proteins, nitrite, and chloride ions, intraocular pressure (IOP), corneal temperature, and pH can be carried out non-invasively using contact lens sensors. Microfluidic contact lens sensor based colorimetric sensing and liquid control mechanisms enable the wearers to perform self-examinations at home using smartphones. Furthermore, drug-laden contact lenses have emerged as delivery platforms using a low dosage of drugs with extended residence time and increased ocular bioavailability. This review provides an overview of contact lenses for ocular diagnostics and drug delivery applications. The designs, working principles, and sensing mechanisms of sensors and drug delivery systems are reviewed. The potential applications of contact lenses in point-of-care diagnostics and personalized medicine, along with the significance of integrating multiplexed sensing units together with drug delivery systems, have also been discussed.

Keywords: bioavailability; biomaterials; biosensors; contact lenses, continuous monitoring; diagnostics; drug delivery; ophthalmology; personalized medicine; photonic crystals; physiological parameters.


Conflict of interest statement

The authors declare no competing financial interest.

Figures

Figure 1
Figure 1
PET-based electrochemical glucose sensor fabrication process and results: (A) clean PET substrate prepared; (B) substrate covered by photoresist and exposed to ultraviolet (UV) light through a mask; (C) photoresist developed; (D) thin metal films evaporated on the sample; (E) after lift-off, metal pattern remaining on the surface (after this step, sensor cut out of polymer substrate and heat molded to the contact lens shape and functionalized with enzymes); (F) images of sensor after it has been cut out of the substrate; (G) image of completed sensor after molding held on a finger; (H) sensor hard-wired for testing: (I) sequential images of sensor as it goes through surface functionalization through pretreatment with GOD/titania/Nafion. Reprinted with permission from ref (44). Copyright 2011 Elsevier.
Figure 2
Figure 2
Composition and working principle of MEMS-based flexible wearable contact lens glucose sensor. Schemes of (A) formation of the flexible electrode on a 70 μm thick polydimethylsiloxane (PDMS) membrane and (B) flexible electrodes bonded onto the surface of the PDMS contact lens using PDMS and then GOD immobilized using PMEH onto the sensing region of the electrodes. Finally, enzyme membrane overcoated by PMEH: (C) digital image of flexible sensor; (D) measurement method of glucose concentrations in tear fluids using the flexible glucose sensor and a comparative measurement carried out simultaneously by a commercial kit. Reprinted with permission from ref (82). Copyright 2011 Elsevier.
Figure 3
Figure 3
Boronic acid based glucose sensor and the sensing mechanism: (A) equilibrium for the boronic acid/diol (sugar) interaction; (B) schematic representation of the sensing mechanism for the charge neutralization mechanism with regard to glucose sensing.
Figure 4
Figure 4
(A) Schematic illustration of GCCA’s diffraction phenomenon from (111) planes of crystalline colloidal array (CCA) with a FCC arrangement that follows Bragg’s law. Reproduced with permission from ref (109). Copyright 2014 MDPI. Debye diffraction ring measurement: (B) digital image of Debye diffraction ring resulting from a 2D gelated monolayered colloidal crystal (2D GMCC; under 445 nm wavelength laser light); (C) schematic representation of the principle for Debye diffraction ring detection. Reprinted with permission from ref (85). Copyright 2018 American Chemical Society.
Figure 5
Figure 5
PBA modified hydrogel glucose sensor fabrication, sensing mechanism, and results. (A) Fabrication of a glucose-responsive 2D PC PAM-AA hydrogel: (1) 2D CCA on a glass slide; (2) infiltration of prepolymerization solution into the 2D CCA and initiation of the polymerization by UV light; (3) separation of the 2D PC PAM-AA hydrogel film from the glass slide and washing it with water; (4) functionalization of the 2D PC PAM-AA hydrogel with PBA groups. (B) Chemistry of coupling PBA recognition groups to the hydrogel matrix. (C) SEM image of PS 2D CCA on a glass slide. (D) Surface of the 2D PC PAM-AA hydrogel with the PS 2D CCA monolayer embedded. (E) Scheme of the shrinking response of the 2D PC PAM-AA hydrogel response to glucose. (F) Dependence of the particle spacing of the 2D PC PAM-AA hydrogel on glucose concentration in CHES buffer (ionic strength, 150 mM; pH 9).The inset shows the diffraction color of the 2D PC hydrogels. (G) Comparison of the 2D PC hydrogel responses to glucose, fructose, and galactose in CHES buffer (10 mM, pH 9). (H) Ionic strength dependence of the 2D PC PAM-AA hydrogel in CHES buffer (pH 9). (I) Comparison of the 2D PC PAM-AA hydrogel responses to glucose, fructose, and galactose in low ionic strength buffer (10 mM, pH 9). (J) Glucose concentration dependence of the 2D PC PAM-AA hydrogel in a pH adjusted tear fluid. (Inset) Diffraction color changes from red to green with increasing glucose concentration. (K) Kinetics of glucose sensing of the 2D PC PAM-AA hydrogel for 10 mM glucose in an artificial tear fluid (pH was adjusted to pH 9). (L) Bis-bidentate glucose–boronate complexation with the furanose form of glucose. Reprinted with permission from ref (106). Copyright 2014 The Royal Society of Chemistry.
Figure 6
Figure 6
1D PS embedded contact lens sensor for tear glucose measurement, fabrication process, working principle, measurement protocol, and test results. (A) Schematic illustration of the fabrication process of the one-dimensional photonic structure based hydrogel glucose sensor: (i) PS master based stamp; (ii) drop casting of PS along with monomer solution; (iii) UV enhanced photo-polymerization of monomer solution; (iv) replica of the stamp peeled off from the master PS. (B) Optical microscope images of (i) the master PS and (ii) the stamped responsive hydrogel. (C) Photographs of (i) the original grating, (ii) the prepared hydrogel sensor, and (iii) the diffraction pattern (transmission) for the white light source by the PS sensor. (D) Schematic of the setup used to project transmitted diffraction patterns. (E) Photograph of a commercial contact lens on an artificial eye. (F) Photograph of the sensor attached to the contact lens and placed on the eye model. (G) Schematic diagram of the measurement setup. (H) Reflected optical power of the diffracted first order for various glucose concentrations (0–50 mM) vs time measured using the optical power meter. (I) Schematic for the setup of measuring the transmission of the sensor under various polarization angles. (J) Microscopic images of the 1D PS sensor’s cross-section in various glucose concentrations. (K) Change in the sensor’s cross-section as a function of glucose concentration. The scale bars show standard error (n = 3). (L) Schematic setup for recording the diffraction in transmission mode. Reprinted with permission from ref (3). Copyright 2018 American Chemical Society.
Figure 7
Figure 7
Graphene/AgNW hybrid based field-effect sensor for IOP measurement. Design, sensing mechanism, in vivo testing, and results. (A) Schematic of the GO/AgNWs-based wearable contact lens sensor, integrating the glucose sensor and intraocular pressure sensor. (B) Photograph of the contact lens sensor. Scale bar, 1 cm. (Inset: Close-up image of the antenna on the contact lens. Scale bar, 1 cm). (C) Optical transmittance and haze spectra of the bare graphene, AgNWs film, and their hybrid structures. (D) Schematic illustration and principle of glucose detection with the GOD–pyrene functionalized graphene. (E) Schematic illustration of the transparent glucose sensor on a contact lens. (F) Photographs of a wireless sensor integrated onto the eyes of a live rabbit. Black and white scale bars, 1 and 5 cm, respectively. (G) Wireless monitoring of glucose concentrations from 1 to 10 mM. (H) Wireless sensing curves of glucose concentration before and after a contact lens is worn on an eye of live rabbit. (I) Transfer (IDVG) characteristics of the sensor at varied concentrations of glucose (VD = 0.1 V). (J) Real-time continuous monitoring of glucose concentrations (VG = 0 V). (K) Calibration curve generated by averaging current values and the glucose concentration from 1 to 10 mM. Each data point indicates the mean value for 10 samples, and error bars represent the s.d. (L) Stability of the glucose sensor: calibration currents for various glucose concentrations with the passage of time. (M) Amide bond between pyrene linker and glucose oxidase: formation of amide bond resulted with the nucleophilic substitution of N-hydroxysuccinimide by amine group on protein. Panels A–M reprinted with permission from ref (40). Copyright 2017 Springer Nature.
Figure 8
Figure 8
Multitarget sensing microfluidic contact lens, design, methods of fabrication, testing protocol, and diagnostic results. (A) Digital image of a contact lens sensing platform with multiple targets. (B) Color change of the sensors imaged using a smartphone camera. (C) Photographs of the sensors serving as inputs to the customized MATLAB algorithm, where the region of interest (ROI) can be selected. Characterization of microfluidic contact lenses: (D) Fluid flow characterization with fluorescein aqueous solution. Five consecutive injections amounting to 1 μL each were performed from the indicated injection site. Within 560 ms, the fluid reached all of the sensing site. (E) Characterization of contact lens sensors with artificial tear fluid. Photographs of a contact lens sensor before (i) and after (ii) artificial tear fluid injection. (F) Representation of smartphone readouts on contact lens sensors before (i) and after (ii) artificial tear fluid injection. (G) Red, green, and blue color shift over time for (i) glucose, (ii) pH, (iii) protein, and (iv) nitrite biochemical sensors. (H) CIE 1931 chromaticity diagrams obtained with the algorithm after inputting the imaged sensors. The algorithm allowed selection of the region of interest, indicated with black dotted lines. The corresponding normalized color is plotted in the chromaticity space calibrated with the points of the sensor of interest (white dots) and compared to the calibration values (black dots). The nearest calibration point gives the concentration readout. Readouts refer to (i) glucose, (ii) pH, (iii) protein, and (iv) nitrite sensors. Reprinted with permission from ref (4). Copyright 2020 Elsevier.
Figure 9
Figure 9
Different tethered IOP sensors, their design, and measurement protocol. (A) Schematic presentation of a system for measuring the intraocular pressure continuously using transponder components. Reproduced with permission from ref (147). Copyright 2000 Elsevier. (B) Silicone soft contact lens sensor showing the location of the sensor-active strain gauges and the sensor-passive strain gauges for thermal compensation for wireless powering and communication, a microprocessor, and an antenna embedded into the soft contact lens; (C) Setup for measuring intraocular pressure wirelessly and (D) plot of intraocular pressure voltages of the output signal of the contact lens sensor (Vm) showing a high linear behavior [linear regression coefficient (R2) = 0.9935] and a reproducibility of ±0.2 mmHg (95% confidence interval). Reprinted with permission from ref (144). Copyright 2009 John Wiley and Sons.
Figure 10
Figure 10
Graphene-incorporated strain gauge IOP sensors, fabrication process, images, sensing mechanism, and results. (A) Schematic for process of graphene woven fabric (GWF) based IOP device fabrication. (B) Digital image of the GWFs. (C) Strains variation with the intraocular pressure. (D) Working principle of the device. (E) Current pathway through a fractured graphene woven fabric (GWF). (F) Setup for the mechanical testing and in vitro application experiments. (G) Schematic for the sensitive performance testing. (H) Current–voltage relationship of the device. (I) Relationship between the current and IOP increasing under 10 V of the four devices. (J) Relationship between the resistance change rate and the IOP variation. (K–M) Relationship between the IOP variation and the current when keeping the voltage constant in 10 V. Reprinted with permission from ref (1). Copyright 2019 Springer Nature.
Figure 11
Figure 11
Capacitance-based IOP sensor, design, working principle, and results. (A) Capacitance-based contact lens sensor configuration for IOP measurement. (B) Contact lens sensor configuration on eye with high IOP (IOP fluctuations change of corneal curvature exhibited by the change in the capacitance indicated by the change in the distance between the electrodes). (C) Schematic illustration of reading circuitry of the contact lens sensor. (D) Scheme of sensor testing setup. (E) Photograph of sensor testing setup on porcine eye. Reprinted with permission from ref (43). Copyright 2013 Elsevier.
Figure 12
Figure 12
Graphene–AgNW hybrid electrodes incorporated IOP sensor, fabrication, working principle, and results. (A) Schematic showing the mechanism AgNWs spiral coil based intraocular pressure sensor. (B) Photographs of the sensor transferred onto the contact lens worn by a bovine eyeball (left) and a mannequin eye (right). Scale bar, 1 cm. (C) Schematic of the experimental setup for wireless intraocular pressure sensing. (D) Wireless recording of the reflection coefficients at different pressures. (E) Frequency response of the intraocular pressure sensor on the bovine eye from 5 to 50 mmHg. (Inset: corresponding reflection coefficients of the sensor). (F) Frequency response of the sensor during a pressure cycle. Reprinted with permission from ref (40). Copyright 2017 Springer Nature.
Figure 13
Figure 13
Basic principle and components of microfluidic IOP sensor and fabrication of contact lens with IOP sensor. (A) Schematic illustration of calibration device. (B) Digital image of the microfabricated PDMS based device.
Figure 14
Figure 14
Microfluidic pressure sensor working principle, incorporation in contact lens and results. (A) 3D schematics of the strain sensor. The sensor is composed of a liquid reservoir, an air reservoir, and a sensing channel. (B) Cartoon sketch showing the strain sensor operation principle. (C) Photograph of the wearable microfluidic strain sensor (150 μm thickness). (D) Results of the dyed oil absorption experiment for different materials, namely, RTV (PDMS), Clearflex, and NOA65. The inset shows the microscope images of the wells fabricated from corresponding materials comparing the initial and the final states of dyed oil absorption. Adapted with permission from ref (169). Copyright 2018 The Royal Society of Chemistry.
Figure 15
Figure 15
PDMS- and PET-based microfluidic contact lens for IOP measurement: (A) Digital images of fabricated microfluidic contact lenses using PDMS and PET, worn on the porcine eye ex vivo. (B, C) Sectional view and top view of microfluidic contact lenses under different IOPs of P0 and P0 + ΔP. (D) Sectional area change of sensing chamber. FEM results of microfluidic contact lens: (E) Simulation illustration. (F) Sectional view of the sensor with a pressure of 40 mmHg in relation to deformation. (G) Variation of displacement and IOP during three cycles of increasing and decreasing pressure. Reprinted with permission from ref (48). Copyright 2019 Elsevier.
Figure 16
Figure 16
(A) Schematic representation of the proposed thin magnetic micropump integrated in contact lens. (The cross-sectional view shows how the drug can be released from the micropump into the postlens tear film through the aperture in the PDMS membrane). (B, C) Working principle of the proposed micropump: status of the micropump under no actuation and actuation of magnetic field pulse, respectively. (D) Resulting on-demand drug release under an external controllable magnetic field pulse. Reprinted with permission from ref (190). Copyright 2020 Springer Nature.
Figure 17
Figure 17
HTCC/Ag/GO membrane embedded contact lens for controlled drug delivery: fabrication, mechanism, and results. (A) Synthesis of HTCC/Ag/GO/Vor. (B) Schematic illustration of drug-loaded contact lenses and controlled drug release. (C) Stress–strain behavior of membranes of CS, HTCC, HTCC/Ag, HTCC/GO, and HTCC/Ag/GO. HTCC and HTCC/Ag were mixed with 5% CS solution in the process of casting of membranes, while HTCC/GO and HTCC/Ag/GO were not. (D) UV–vis spectra of HTCC/Ag/GO/Vor and Voriconazole in PBS: (a) HTCC/Ag/GO/Vor; (b) Voriconazole. (E) Accumulated release curve of Vor in PBS (pH7.4). (F) Photographs of mouse eyes indicating the disease progression at 1, 3, 5, and 7 days. Reprinted with permission from ref (37). Copyright 2016 American Chemical Society.

Similar articles

Cited by

References

    1. Zhang Y.; Chen Y.; Man T.; Huang D.; Li X.; Zhu H.; Li Z. High Resolution Non-Invasive Intraocular Pressure Monitoring by use of Graphene Woven Fabrics on Contact Lens. Microsyst. Nanoeng. 2019, 5, 39. 10.1038/s41378-019-0078-x. - DOI - PMC - PubMed
    1. Tseng C.; Huang Y.; Tsai S.; Yeh G.; Chang C.; Chiou J. In Design and Fabricate a Contact Lens Sensor with a Micro-Inductor Embedded for Intraocular Pressure Monitoring 2012, 1–4. 10.1109/ICSENS.2012.6411234. - DOI
    1. Elsherif M.; Hassan M. U.; Yetisen A. K.; Butt H. Wearable Contact Lens Biosensors for Continuous Glucose Monitoring Using Smartphones. ACS Nano 2018, 12, 5452–5462. 10.1021/acsnano.8b00829. - DOI - PMC - PubMed
    1. Moreddu R.; Wolffsohn J. S.; Vigolo D.; Yetisen A. K. Laser-Inscribed Contact Lens Sensors for the Detection of Analytes in the Tear Fluid. Sens. Actuators, B 2020, 317, 128183. 10.1016/j.snb.2020.128183. - DOI
    1. Yetisen A. K.; Jiang N.; Tamayol A.; Ruiz-Esparza G.; Zhang Y. S.; Medina-Pando S.; Gupta A.; Wolffsohn J. S.; Butt H.; Khademhosseini A.; Yun S. Paper-Based Microfluidic System for Tear Electrolyte Analysis. Lab Chip 2017, 17, 1137–1148. 10.1039/C6LC01450J. - DOI - PMC - PubMed

Publication types