. 2021 Jun 24;184(13):3376-3393.e17.
doi: 10.1016/j.cell.2021.05.002. Epub 2021 May 26.

A global metagenomic map of urban microbiomes and antimicrobial resistance

David Danko  1 Daniela Bezdan  2 Evan E Afshin  1 Sofia Ahsanuddin  3 Chandrima Bhattacharya  1 Daniel J Butler  1 Kern Rei Chng  4 Daisy Donnellan  1 Jochen Hecht  5 Katelyn Jackson  1 Katerina Kuchin  1 Mikhail Karasikov  6 Abigail Lyons  1 Lauren Mak  1 Dmitry Meleshko  1 Harun Mustafa  6 Beth Mutai  7 Russell Y Neches  8 Amanda Ng  4 Olga Nikolayeva  9 Tatyana Nikolayeva  9 Eileen Png  4 Krista A Ryon  1 Jorge L Sanchez  1 Heba Shaaban  1 Maria A Sierra  1 Dominique Thomas  1 Ben Young  1 Omar O Abudayyeh  10 Josue Alicea  1 Malay Bhattacharyya  11 Ran Blekhman  12 Eduardo Castro-Nallar  13 Ana M Cañas  1 Aspassia D Chatziefthimiou  1 Robert W Crawford  14 Francesca De Filippis  15 Youping Deng  16 Christelle Desnues  17 Emmanuel Dias-Neto  18 Marius Dybwad  19 Eran Elhaik  20 Danilo Ercolini  15 Alina Frolova  21 Dennis Gankin  10 Jonathan S Gootenberg  10 Alexandra B Graf  22 David C Green  23 Iman Hajirasouliha  1 Jaden J A Hastings  1 Mark Hernandez  24 Gregorio Iraola  25 Soojin Jang  26 Andre Kahles  27 Frank J Kelly  23 Kaymisha Knights  1 Nikos C Kyrpides  8 Paweł P Łabaj  28 Patrick K H Lee  29 Marcus H Y Leung  29 Per O Ljungdahl  30 Gabriella Mason-Buck  23 Ken McGrath  31 Cem Meydan  1 Emmanuel F Mongodin  32 Milton Ozorio Moraes  33 Niranjan Nagarajan  4 Marina Nieto-Caballero  24 Houtan Noushmehr  34 Manuela Oliveira  35 Stephan Ossowski  36 Olayinka O Osuolale  37 Orhan Özcan  38 David Paez-Espino  8 Nicolás Rascovan  39 Hugues Richard  40 Gunnar Rätsch  6 Lynn M Schriml  32 Torsten Semmler  41 Osman U Sezerman  38 Leming Shi  42 Tieliu Shi  43 Rania Siam  44 Le Huu Song  45 Haruo Suzuki  46 Denise Syndercombe Court  23 Scott W Tighe  47 Xinzhao Tong  29 Klas I Udekwu  48 Juan A Ugalde  49 Brandon Valentine  1 Dimitar I Vassilev  50 Elena M Vayndorf  51 Thirumalaisamy P Velavan  52 Jun Wu  43 María M Zambrano  53 Jifeng Zhu  1 Sibo Zhu  54 Christopher E Mason  55 International MetaSUB Consortium
Collaborators, Affiliations

A global metagenomic map of urban microbiomes and antimicrobial resistance

David Danko et al. Cell. .

Abstract

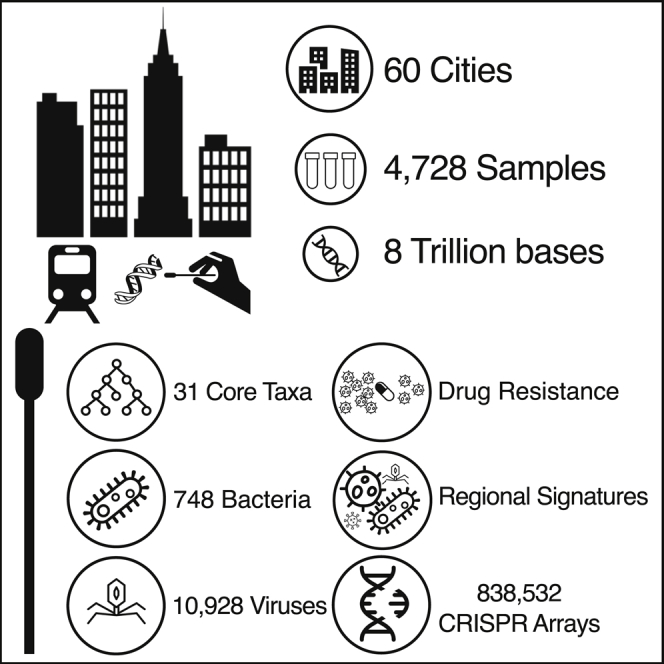
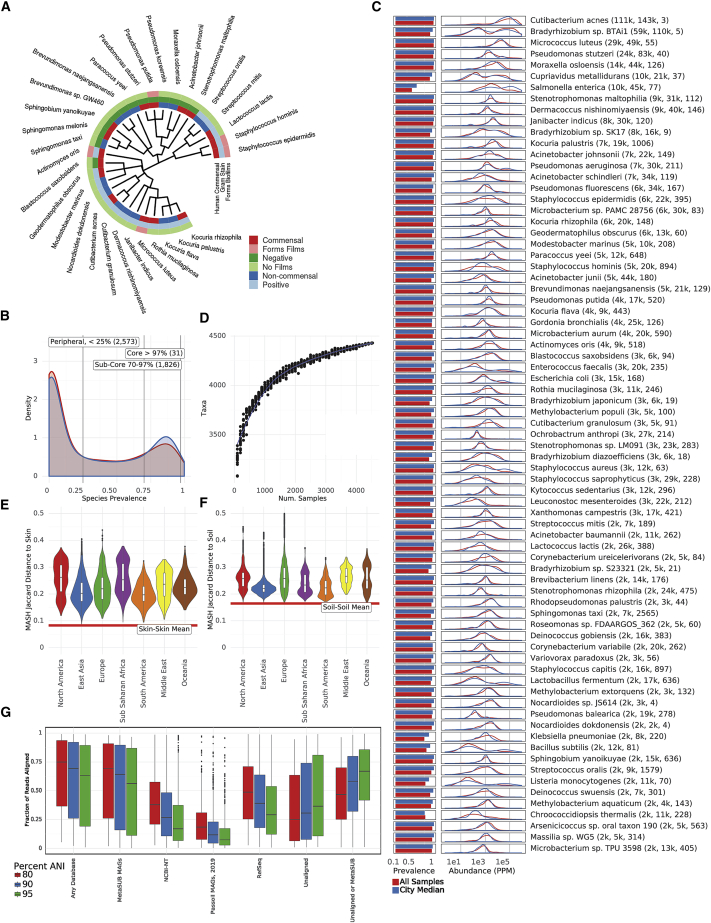
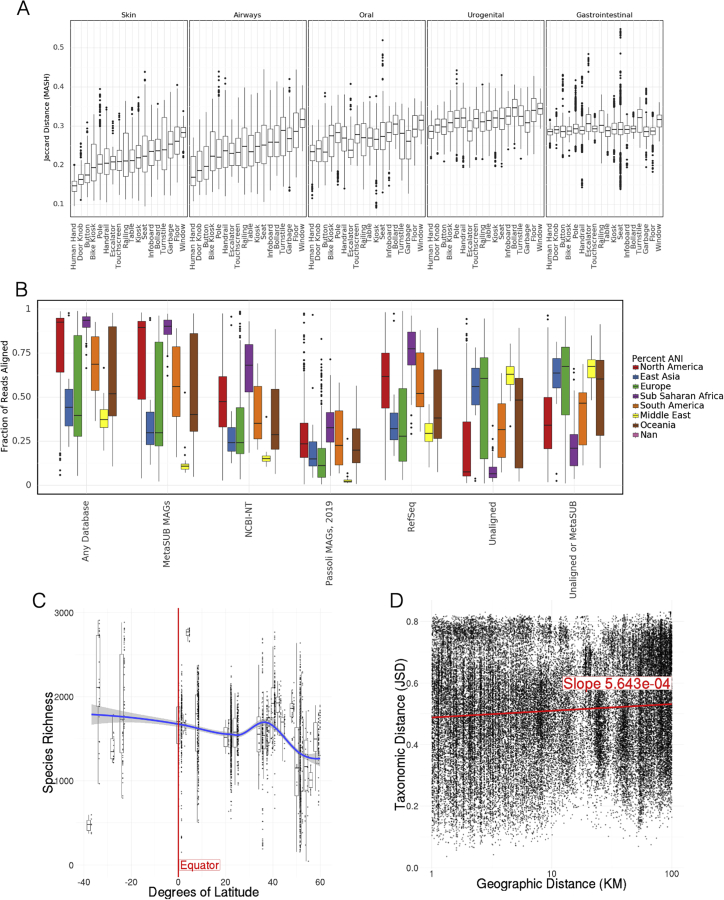
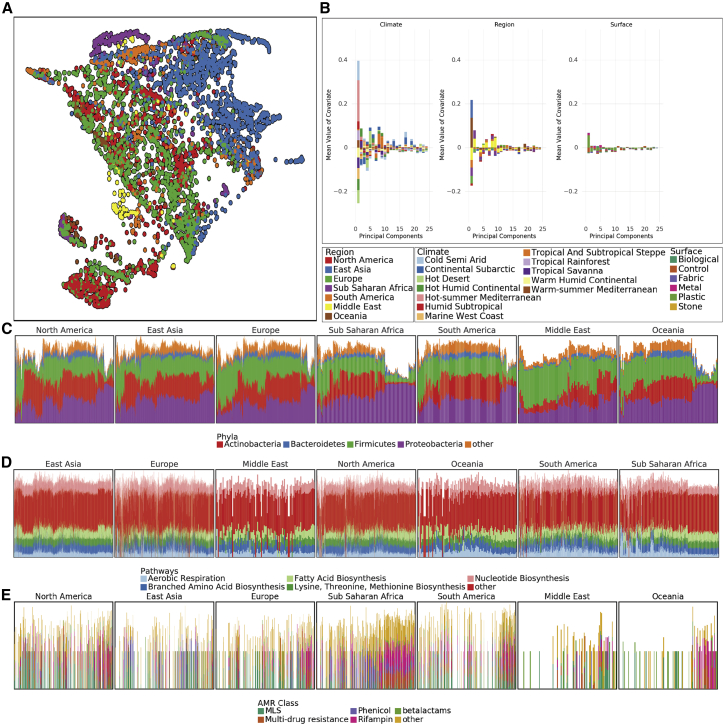
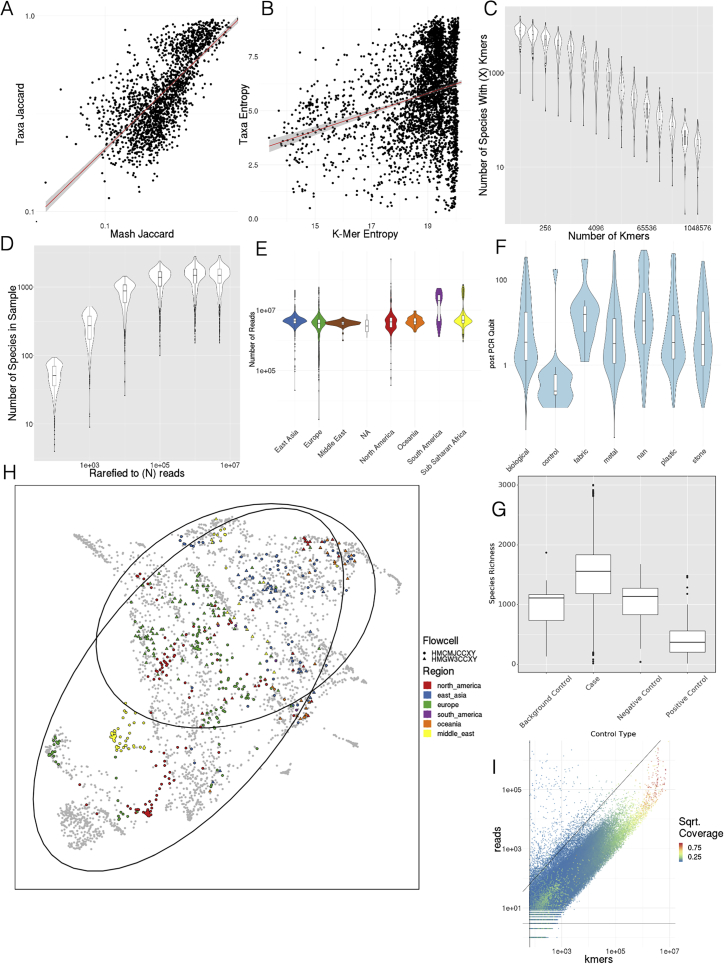
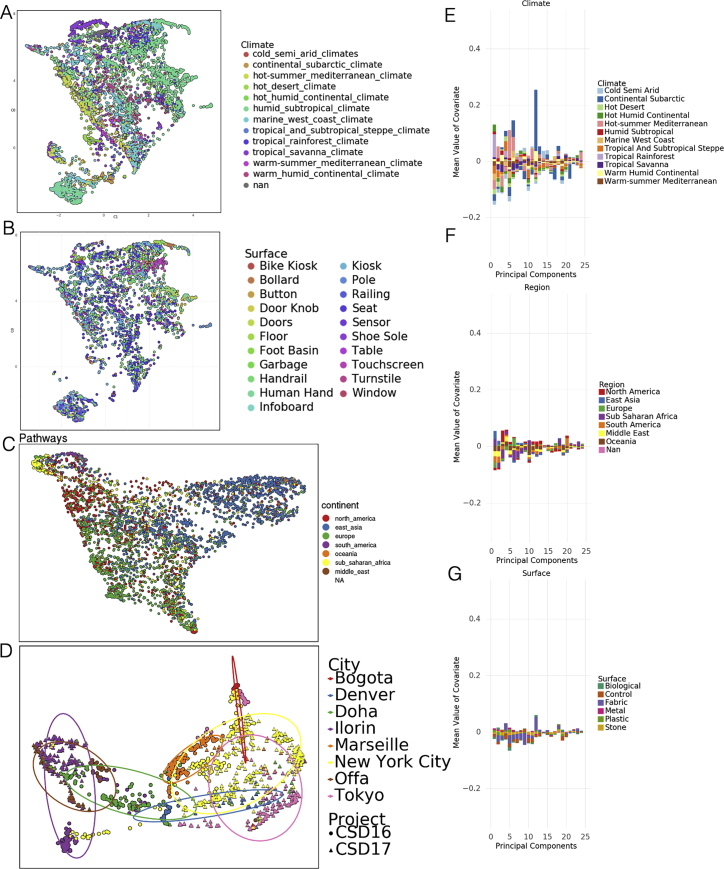
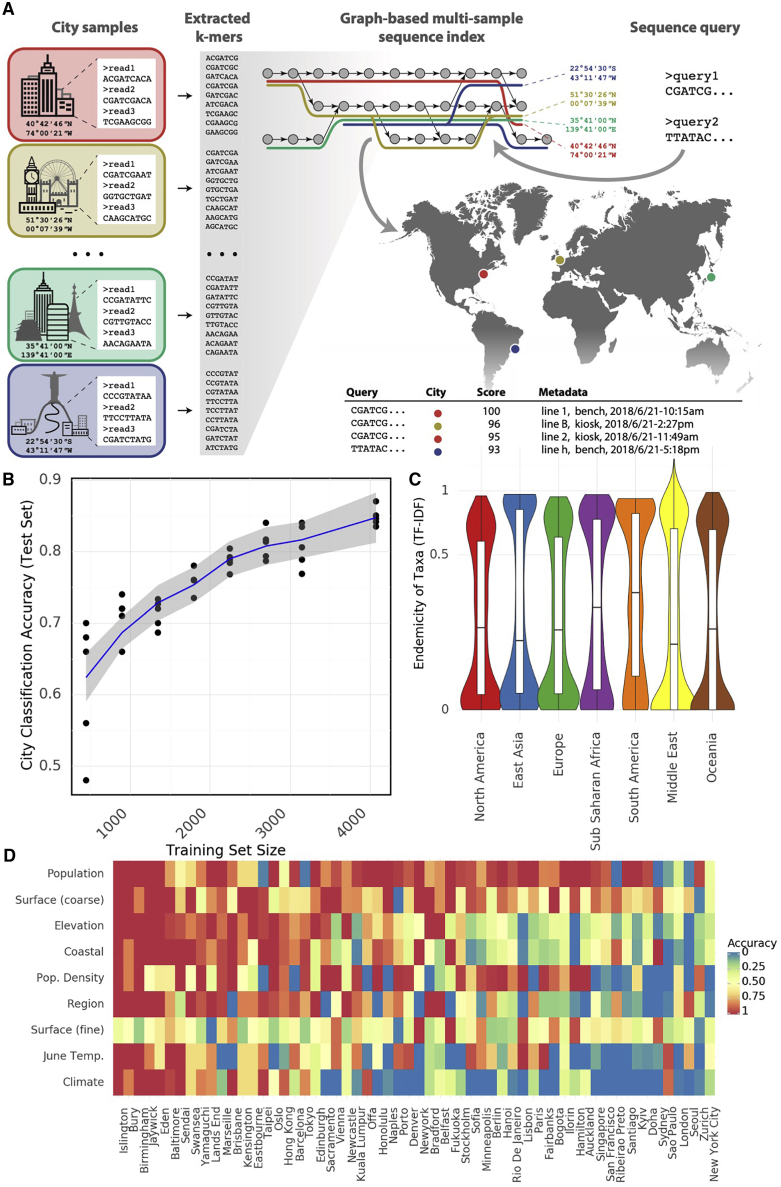
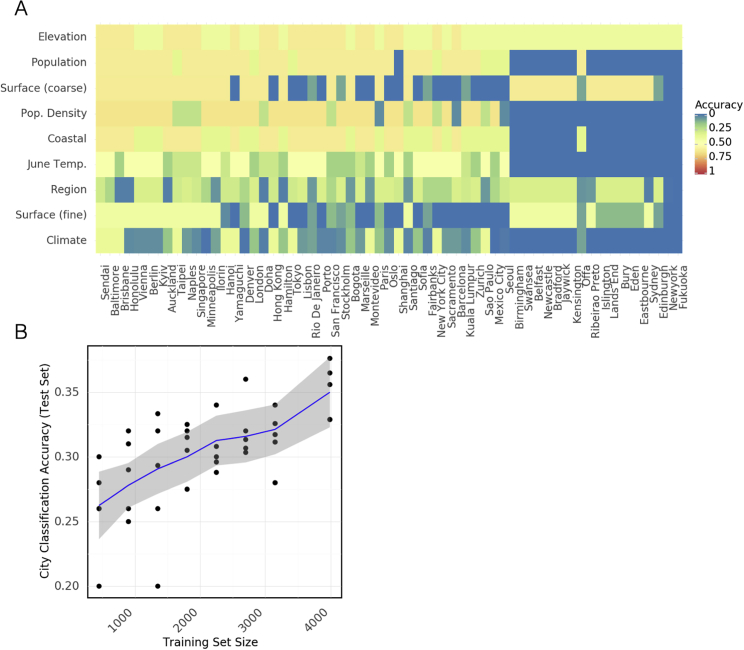
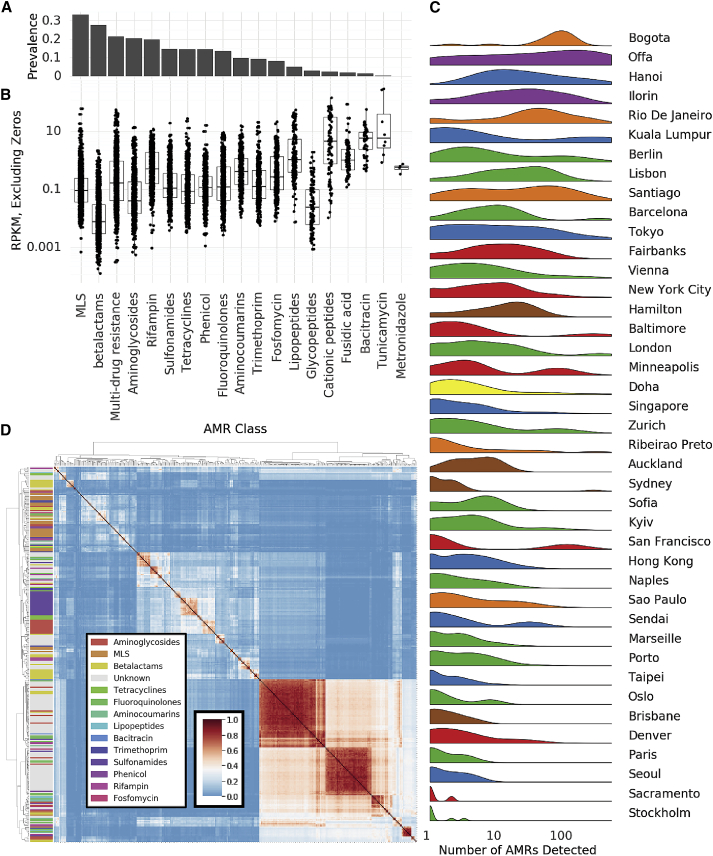
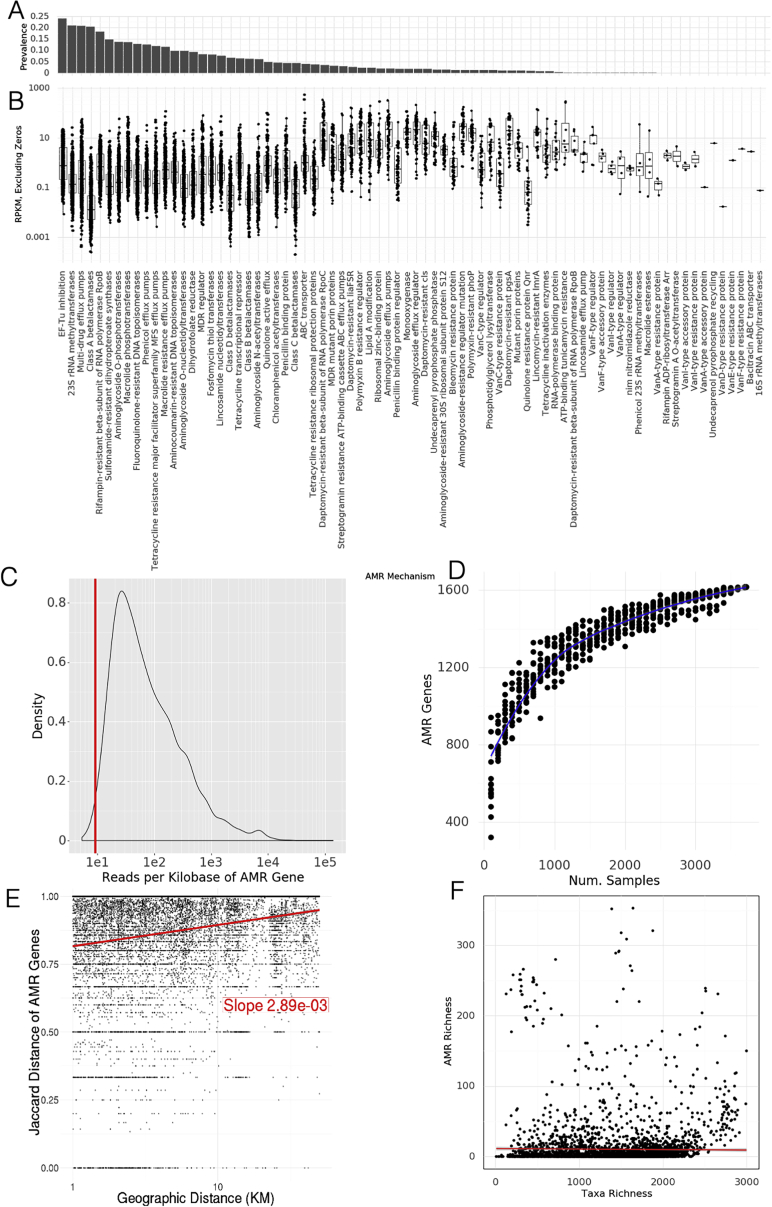
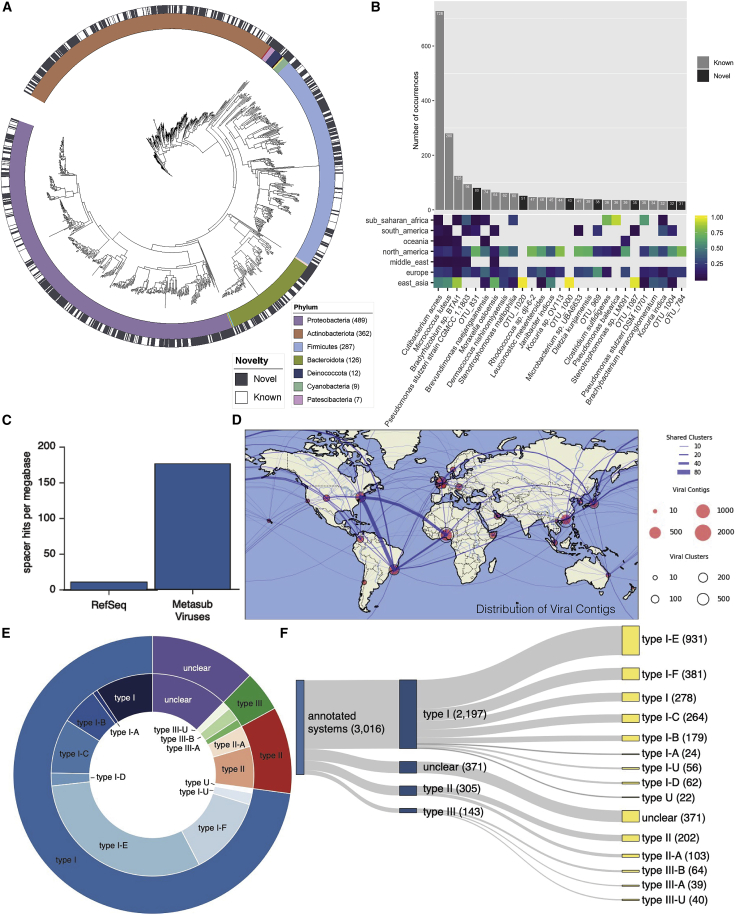
We present a global atlas of 4,728 metagenomic samples from mass-transit systems in 60 cities over 3 years, representing the first systematic, worldwide catalog of the urban microbial ecosystem. This atlas provides an annotated, geospatial profile of microbial strains, functional characteristics, antimicrobial resistance (AMR) markers, and genetic elements, including 10,928 viruses, 1,302 bacteria, 2 archaea, and 838,532 CRISPR arrays not found in reference databases. We identified 4,246 known species of urban microorganisms and a consistent set of 31 species found in 97% of samples that were distinct from human commensal organisms. Profiles of AMR genes varied widely in type and density across cities. Cities showed distinct microbial taxonomic signatures that were driven by climate and geographic differences. These results constitute a high-resolution global metagenomic atlas that enables discovery of organisms and genes, highlights potential public health and forensic applications, and provides a culture-independent view of AMR burden in cities.

Keywords: AMR; BGC; NGS; antimicrobial resistance; built Environment; de novo assembly; global health; metagenome; microbiome; shotgun sequencing.


Conflict of interest statement

Declaration of interests C.E.M. is co-founder of Biotia and Onegevity Health. D.B. is co-founder and CSO of Poppy Health Inc. The other authors declare they have no competing interests that impacted this study.

Figures

None
Graphical abstract
Figure 1
Figure 1
The core microbiome (A) Taxonomic tree showing 31 core taxa, annotated according to gram stain, ability to form biofilms, and whether the bacteria is a human commensal species. (B) Distribution of species prevalence from all samples and normalized by cities. Vertical lines show defined group cutoffs. (C) Prevalence and distribution of relative abundances of the 75 most abundant taxa. Mean relative abundance, standard deviation, and kurtosis of the abundance distribution are shown. (D) Rarefaction analysis showing the number of species detected in randomly chosen sets of samples. (E) MASH (k-mer-based) similarity between MetaSUB samples and HMP skin microbiome samples by continent. (F) MASH (k-mer based) similarity between MetaSUB samples and soil microbiome samples by continent. (G) Fraction of reads aligned (via BLAST) to different databases at different average nucleotide identities. See also Figure S1.
Figure S1
Figure S1
Core urban taxa and ecological trends, related to Figure 1 (A) Jaccard similarity of MASH indices to HMP samples for different surface types. (B) Fraction of reads assigned at 80% ANI to different databases by BLAST for each region. (C) Correlation between species richness and latitude. Richness decreases significantly with latitude. (D) Neighborhood effect. Taxonomic distance weakly correlates with geographic distance within cities.
Figure 2
Figure 2
Differences at global scale (A) UMAP of taxonomic profiles based on Jaccard distance between samples. Colored by the region of origin for each sample. Axes are arbitrary and without meaningful scale. The color key is shared with (B). (B) Association of the first 25 principal components of sample taxonomy with climate, continent, and surface material. (C) Distribution of ma1jo0r phyla, sorted by hierarchical clustering of all samples and grouped by continent. (D) Distribution of high-level groups of functional pathways, using the same order as taxa (C). (E) Distribution of AMR genes by drug class (as defined in MegaRes), using the same order as taxa (C). Note that MLS is macrolide-lincosamide-streptogramin. See also Figure S3.
Figure S2
Figure S2
Quality control and metrics, related to Figures 1 and 2 (A) Jaccard distance of taxonomic profiles versus MASH Jaccard distance of k-mers. (B) Shannon’s Entropy of taxonomic profiles versus Shannon’s Entropy of k-mers. (C) Number of species detected as k-mer threshold increases for 100 randomly selected samples. (D) Number of species detected as number of sub-sampled reads increase. (E) Number of reads by region. (F) PCR Qubit by surface material. (G) Taxonomic Richness in Cases versus Types of Controls. (H) Flowcells versus quality control metrics See also Methods. (I) k-mer counts compared to number of reads for species level annotations in 100 randomly selected samples, colored by coverage of marker k-mer set.
Figure S3
Figure S3
Diversity and variation, related to Figure 2 (A) UMAP of taxonomic profiles colored by climate classification. (B) UMAP of taxonomic profiles colored by surface type. (C) UMAP of functional profiles colored by region. (D) Taxonomic shift over time in cities with two years of sampling. UMAP dimensionality reduction of taxonomic profiles for each sample shows variation within cities across time (2016, circles and 2017, triangles) though generally less variation than between cities (colors). (E–G) Sources of variation for AMRs. Association of the first 25 principal components of AMR genes with climate, region, and surface material.
Figure 3
Figure 3
Microbial signatures (A) Schematic of GeoDNA representation generation. Raw sequences of individual samples for all cities are transformed into lists of unique k-mers (left). After filtration, the k-mers are assembled into a graph index database. Each k-mer is then associated with its respective city label and other informative metadata, such as geo-location and sampling information (top middle). Arbitrary input sequences (top right) can then be efficiently queried against the index, returning a ranked list of matching paths in the graph together with metadata and a score indicating the percentage of k-mer identity (bottom right). The geo-information of each sample is used to highlight the locations of samples that contain sequences identical or close to the queried sequence (middle right). (B) Classification accuracy of a random forest model for assigning city labels to samples as a function of the size of the training set. (C) Distribution of endemicity scores (term frequency inverse document frequency) for taxa in each region. (D) Prediction accuracy of a random forest model for a given feature (rows) in samples from a city (columns) that were not present in the training set. Rows and columns are sorted by average accuracy. Continuous features (e.g., population) were discretized. See also Figure S4.
Figure S4
Figure S4
Microbial signatures in the urban environment, related to Figure 3 (A) Classification accuracy that would be achieved by a random model predicting features (rows) for held out cities (columns). (B) Classification accuracy of a random forest model predicting city labels for held out samples from antimicrobial resistance genes.
Figure 4
Figure 4
Antimicrobial resistance genes (A) Prevalence of AMR genes with resistance to particular drug classes. (B) Abundance of AMR gene classes when detected, by drug class. (C) Number of detected AMR genes by city. (D) Co-occurrence of AMR genes in samples (Jaccard index) annotated by drug class. See also Figure S5.
Figure S5
Figure S5
Antimicrobial resistance in the urban environment, related to Figure 4 (A) Prevalence of AMR genes with a particular resistance mechanism. (B) Abundance of AMR genes when categorized by resistance mechanism. (C) Distribution of reads per gene (normalized by kilobases of gene length) for AMR gene calls. The vertical red line indicates that 99% of AMR genes have more than 9.06 reads per kilobase and would still be called at a lower read depth. (D) Rarefaction analysis of antimicrobial resistance genes. Curve does not flatten suggesting we would identify more AMR genes with more samples. (E) Neighborhood effect. Jaccard distance of AMR genes weakly correlates with geographic distance within cities. (F) Relationship of the number of AMR genes (richness) to the number of species (richness) in each sample. No clear correlation is observed.
Figure 5
Figure 5
Newly observed genetic sequences (A) Taxonomic tree for metagenome-assembled genomes (MAGs) found in the MetaSUB data. The outer black and white ring indicate if the MAG matches a known species, and the inner ring indicates phyla of the MAG. (B) Top: the number of samples where the most prevalent MAGs were found. Bottom: the regional breakdown of samples where the MAG was found. (C) Mapping rate of CRISPR spacers from MetaSUB data to viral genomes in RefSeq and viral genomes found in MetaSUB data. (D) Geographic distribution of viral genomes found in MetaSUB data. (E and F) Fractional breakdowns of identifiable CRISPR systems found in the MetaSUB data.

References

    1. Afshinnekoo E., Meydan C., Chowdhury S., Jaroudi D., Boyer C., Bernstein N., Maritz J.M., Reeves D., Gandara J., Chhangawala S. Geospatial Resolution of Human and Bacterial Diversity with City-Scale Metagenomics. Cell Syst. 2015;1:72–87. - PMC - PubMed
    1. Afshinnekoo E., Chou C., Alexander N., Ahsanuddin S., Schuetz A.N., Mason C.E. Precision metagenomics: Rapid metagenomic analyses for infectious disease diagnostics and public health surveillance. J. Biomol. Tech. 2017;28:40–45. - PMC - PubMed
    1. Afshinnekoo E., Bhattacharya C., Burguete-García A., Castro-Nallar E., Deng Y., Desnues C., Dias-Neto E., Elhaik E., Iraola G., Jang S., MetaSUB Consortium COVID-19 drug practices risk antimicrobial resistance evolution. Lancet Microbe. 2021;2:e135–e136. - PMC - PubMed
    1. Allen H.K., Moe L.A., Rodbumrer J., Gaarder A., Handelsman J. Functional metagenomics reveals diverse β-lactamases in a remote Alaskan soil. ISME J. 2009;3:243–251. - PubMed
    1. Altschul S.F., Gish W., Miller W., Myers E.W., Lipman D.J. Basic Local Alignment Search Tool. J. Mol. Biol. 1990;215:403–410. - PubMed

Publication types