. 2021 Jul 6;33(7):1466-1482.e7.
doi: 10.1016/j.cmet.2021.05.002. Epub 2021 May 26.

Gut-brain communication by distinct sensory neurons differently controls feeding and glucose metabolism

Affiliations

Gut-brain communication by distinct sensory neurons differently controls feeding and glucose metabolism

Diba Borgmann et al. Cell Metab. .

Abstract

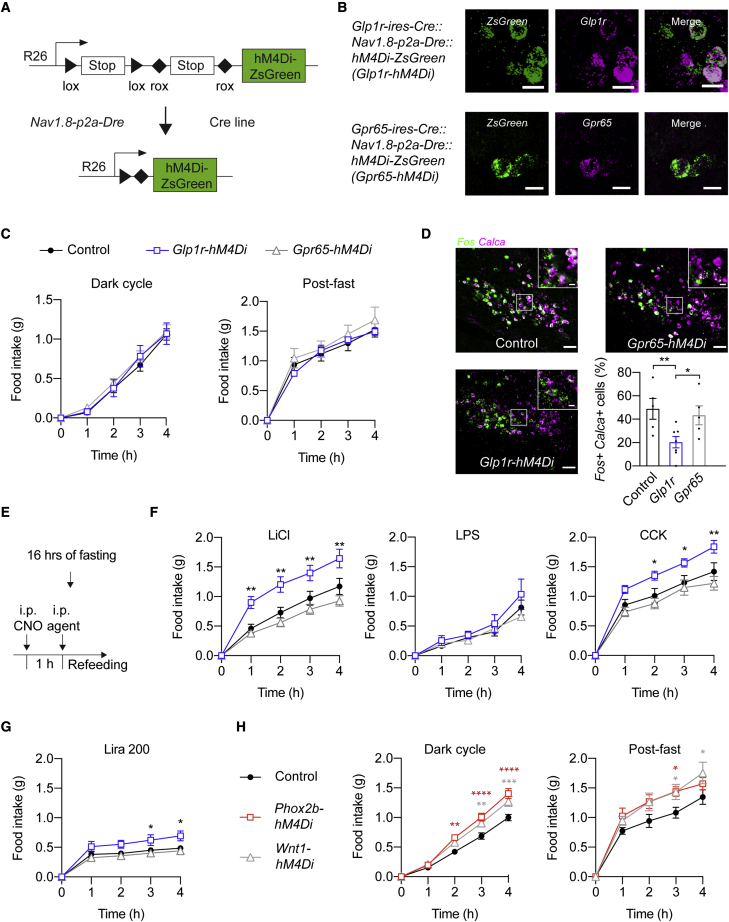
Sensory neurons relay gut-derived signals to the brain, yet the molecular and functional organization of distinct populations remains unclear. Here, we employed intersectional genetic manipulations to probe the feeding and glucoregulatory function of distinct sensory neurons. We reconstruct the gut innervation patterns of numerous molecularly defined vagal and spinal afferents and identify their downstream brain targets. Bidirectional chemogenetic manipulations, coupled with behavioral and circuit mapping analysis, demonstrated that gut-innervating, glucagon-like peptide 1 receptor (GLP1R)-expressing vagal afferents relay anorexigenic signals to parabrachial nucleus neurons that control meal termination. Moreover, GLP1R vagal afferent activation improves glucose tolerance, and their inhibition elevates blood glucose levels independent of food intake. In contrast, gut-innervating, GPR65-expressing vagal afferent stimulation increases hepatic glucose production and activates parabrachial neurons that control normoglycemia, but they are dispensable for feeding regulation. Thus, distinct gut-innervating sensory neurons differentially control feeding and glucoregulatory neurocircuits and may provide specific targets for metabolic control.

Keywords: Dre-recombinase; appetite; chemogenetics; dorsal root ganglion; glucose metabolism; gut-brain axis; intersectional genetics; nodose ganglion; sensory neurons; vagus nerve.


Conflict of interest statement

Declaration of interests The authors declare no competing interests.

Figures

None
Graphical abstract
Figure 1
Figure 1
Intersectional genetic targeting of molecularly defined sensory neurons (A) Schematic of sensory neuron locations and their central projections. Nodose ganglia (NG; vagal afferents) neurons project to the brainstem, where they innervate the nucleus of the solitary tract (NTS) and the area postrema (AP). Dorsal root ganglia (DRG; spinal afferents) neurons innervate the dorsal horn (DH) of the spinal cord. (B) Breeding schematic for triple transgenic mice. Dre-/Cre-dependent tdTomato reporter mice (Madisen et al., 2015) were crossed with Nav1.8-p2a-Dre mice and Cre-expressing mouse lines. Dre and Cre recombinases excise rox and lox sites, respectively, allowing expression of tdTomato in discrete sensory neuron populations. (C–F) tdTomato (magenta) expression in NG, brainstem, DRG, and spinal cord in triple transgenic mice derived from Phox2b-Cre (C), Wnt1-Cre (D), Glp1r-ires-Cre (E), and Gpr65-ires-Cre (F) mice. Spinal trigeminal nucleus, sp5. Spinal dorsal horn, DH. Scale bars represent 100 μm (NG and DRG), 100 μm (brainstem; 500 μm inset), and 200 μm (spinal cord). See also Figure S1 and Table S1.
Figure 2
Figure 2
Intersectional mapping identifies the gut innervation patterns of distinct vagal and spinal afferents (A) Schematic of stomach, small intestine, and large intestine innervation by sensory neurons of NG and DRG origin. (B, D, and F) Representative images showing tdTomato-containing (magenta) endings in stomach corpus (B), jejunum (D), and colon (F). Scale bars represent 50 μm. Dashed lines indicate muscular layer. (C, E, and G) Quantification of tdTomato-containing mucosal and muscular terminal endings in triple transgenic mice derived from Phox2b-Cre, Wnt1-Cre, Glp1r-ires-Cre, and Gpr65-ires-Cre mice of the stomach (C), small intestine (E), and colon (G). Values are presented as mean ± SEM. See also Figure S2.
Figure 3
Figure 3
Selective stimulation of gut-innervating vagal afferents alters feeding and modulates neuronal activity in distinct brain regions (A) Breeding schematic and schematic diagram of the Rosa-26-targeting vector allowing Cre-/Dre-dependent expression of hM3Dq-ZsGreen. Excision of lox-flanked and rox-flanked stop cassettes lead to hM3Dq-ZsGreen expression. (B) hM3Dq-ZsGreen and endogenous Glp1r and Gpr65 mRNA expression in NG from triple transgenic mice derived from Glp1r-ires-Cre and Gpr65-ires-Cre mice. Scale bars represent 20 μm. (C) Effects of hM3Dq-induced stimulation of GLP1R or GPR65 vagal afferents on dark-cycle feeding (left) and on (post-fast) refeeding after 16 h of fasting (right). Mice per group, n = 8–19. (D–G) Fos expression in NTS (D and E) and PB (F and G) upon chemogenetic stimulation of GLP1R and GPR65 vagal afferents assessed by FISH. Acutely stimulating GLP1R vagal afferents induces Fos in the PBe (F and G) while stimulating GPR65 vagal afferents induces Fos in a discrete region of the PBd (F). Scale bars represent 100 μm (NTS) or 200 μm (PBN). Analyzed sections per group, n = 3–13. (H) Brain activation pattern upon stimulation of the two subtypes as assessed by [18F]FDG PET (p values from voxelwise t test are indicated by color bar). In all experiments, triple transgenic mice and littermate controls were injected with CNO. Mice are from multiple litters. Statistical significance was assessed by two-way mixed effects ANOVA (C) with Dunnett’s test for multiple comparisons, or ordinary one-way ANOVA with Tukey’s test for multiple comparisons (D–G). Significant results are indicated by p ≤ 0.05, ∗∗p ≤ 0.01, ∗∗∗p ≤ 0.001, and ∗∗∗∗p < 0.0001. Values are presented as mean ± SEM. See also Figure S3.
Figure 4
Figure 4
GLP1R vagal afferent activity contributes to LiCl- and CCK-induced anorexia (A) Schematic diagram of the Rosa-26-targeting vector allowing Cre-/Dre-dependent expression of hM4Di-ZsGreen. (B) hM4Di-ZsGreen and endogenous Glp1r and Gpr65 expression in NG in mice derived from Glp1r-ires-Cre and Gpr65-ires-Cre mice, respectively. Scale bars represent 20 μm. (C) Effects of hM4Di-induced inhibition on dark-cycle feeding (left) and on refeeding after 16 h fasting (right). Mice per group, n = 5–16. (D) Representative histological images and analysis of Fos expression in PBeCGRP neurons in hM4Di-expression mice following LiCl injection assessed by FISH. Calca encodes CGRP. Scale bars represent 100 μm. (E) Schematic of the experimental protocol used for determining the anorexigenic effects of different agents. (F and G) Effects of CNO/hM4Di-induced inhibition of GLP1R or GPR65 vagal afferents on refeeding after administration of LiCl, LPS, CCK (F), or a high dose of liraglutide (200 mg/kg; Lira 200, G). Mice per group, n = 4–19. (H) Effects of hM4Di-induced inhibition of PHOX2B or WNT1 sensory neurons on dark-cycle feeding (left) and on refeeding after 16-h fasting (right). Mice per group, n = 7–16. In all experiments, triple transgenic mice and littermate controls were injected with CNO. Mice are from multiple litters. Statistical significance was assessed by two-way mixed-effects ANOVA (C, F, G, and H) or one-way ANOVA (D) with Dunnett’s test for multiple comparisons. Significant results are indicated by p ≤ 0.05, ∗∗p ≤ 0.01, ∗∗∗p ≤ 0.001, and ∗∗∗∗p < 0.0001. Values are presented as mean ± SEM. See also Figure S4.
Figure 5
Figure 5
Acute stimulation of GLP1R and GPR65 vagal afferents differently affects glucose homeostasis (A) Effects of hM3Dq-induced stimulation of GLP1R or GPR65 vagal afferents on blood glucose levels in fed mice. Mice per group, n = 9–24. (B) Glucose tolerance in hM3Dq-expressing mice and littermate controls 1 h after CNO administration. Mice per group n = 9–21. (C) Schematic (left) of the experimental protocol for euglycemic-hyperinsulinemic clamp studies. Glucose infusion rate (GIR; right) during clamp studies in hM3Dq-expressing mice and littermate controls. Mice per group, n = 7–9. (D) HGP during basal and steady state of the clamp. Glucose uptake in skeletal muscle (SM), white adipose tissue (WAT), and brown adipose tissue (BAT). Hepatic Pck1 gene expression after clamp. Mice per group, n = 6–8. (E) Representative histological images and analysis of Fos expression in the PBdCCK neurons in hM3Dq-expression mice following CNO injection. Scale bars represent 100 μm. In all experiments, triple transgenic mice and littermate controls were injected with CNO. Mice are from multiple litters. Statistical significance was assessed by two-tailed paired Student’s t test (A and D, left), or ordinary one-way ANOVA with Dunnett’s (B, C, and D, middle, right) or Tukey’s (E) test for multiple comparisons. Significant results are indicated by p ≤ 0.05 and ∗∗p ≤ 0.01. Values are presented as mean ± SEM. See also Figure S5.
Figure 6
Figure 6
Selective inactivation of GLP1R vagal afferents disrupts glycemic control during feeding (A–C) Effects of hM4Di-induced inhibition of GLP1R or GPR65 vagal afferents on glucose tolerance during GTTs. CCK (B) or liraglutide (C) were administered 15 min before glucose injections. Mice per group, n = 7–10. (D) Representative images (left) and analysis (right) of endogenous Glp1r and Cckar expression in hM4Di-ZsGreen expressing NG neurons from Glp1r-hM4Di mice. Scale bars represent 20 μm. (E) Effects of hM4Di-induced inhibition of GLP1R or GPR65 vagal afferents on blood glucose levels during dark-cycle feeding. Mice per group, n = 8–10. In all experiments, triple transgenic mice and littermate controls were injected with CNO. Mice are from multiple litters. Statistical significance was assessed by ordinary one-way ANOVA with Dunnett’s test for multiple comparisons (A–C), or two-way mixed effects ANOVA with Dunnett’s test for multiple comparisons (E). Significant results are indicated by ∗∗p ≤ 0.01, ∗∗∗p ≤ 0.001, and ∗∗∗∗p < 0.0001. Values are presented as mean ± SEM. See also Figure S6.

Comment in

References

    1. Aklan I., Sayar Atasoy N., Yavuz Y., Ates T., Coban I., Koksalar F., Filiz G., Topcu I.C., Oncul M., Dilsiz P. NTS catecholamine neurons mediate hypoglycemic hunger via medial hypothalamic feeding pathways. Cell Metab. 2020;31:313–326.e5. - PMC - PubMed
    1. Akopian A.N., Sivilotti L., Wood J.N. A tetrodotoxin-resistant voltage-gated sodium channel expressed by sensory neurons. Nature. 1996;379:257–262. - PubMed
    1. Andermann M.L., Lowell B.B. Toward a wiring diagram understanding of appetite control. Neuron. 2017;95:757–778. - PMC - PubMed
    1. Babic T., Browning K.N., Travagli R.A. Differential organization of excitatory and inhibitory synapses within the rat dorsal vagal complex. Am. J. Physiol. Gastrointest. Liver Physiol. 2011;300:G21–G32. - PMC - PubMed
    1. Bai L., Mesgarzadeh S., Ramesh K.S., Huey E.L., Liu Y., Gray L.A., Aitken T.J., Chen Y., Beutler L.R., Ahn J.S. Genetic identification of vagal sensory neurons that control feeding. Cell. 2019;179:1129–1143.e23. - PMC - PubMed

Publication types

MeSH terms