. 2021 Sep:105:64-77.
doi: 10.1016/j.neurobiolaging.2021.04.013. Epub 2021 Apr 27.

Amyotrophic lateral sclerosis alters the metabolic aging profile in patient derived fibroblasts

Affiliations

Amyotrophic lateral sclerosis alters the metabolic aging profile in patient derived fibroblasts

Margarita Gerou et al. Neurobiol Aging. 2021 Sep.

Abstract

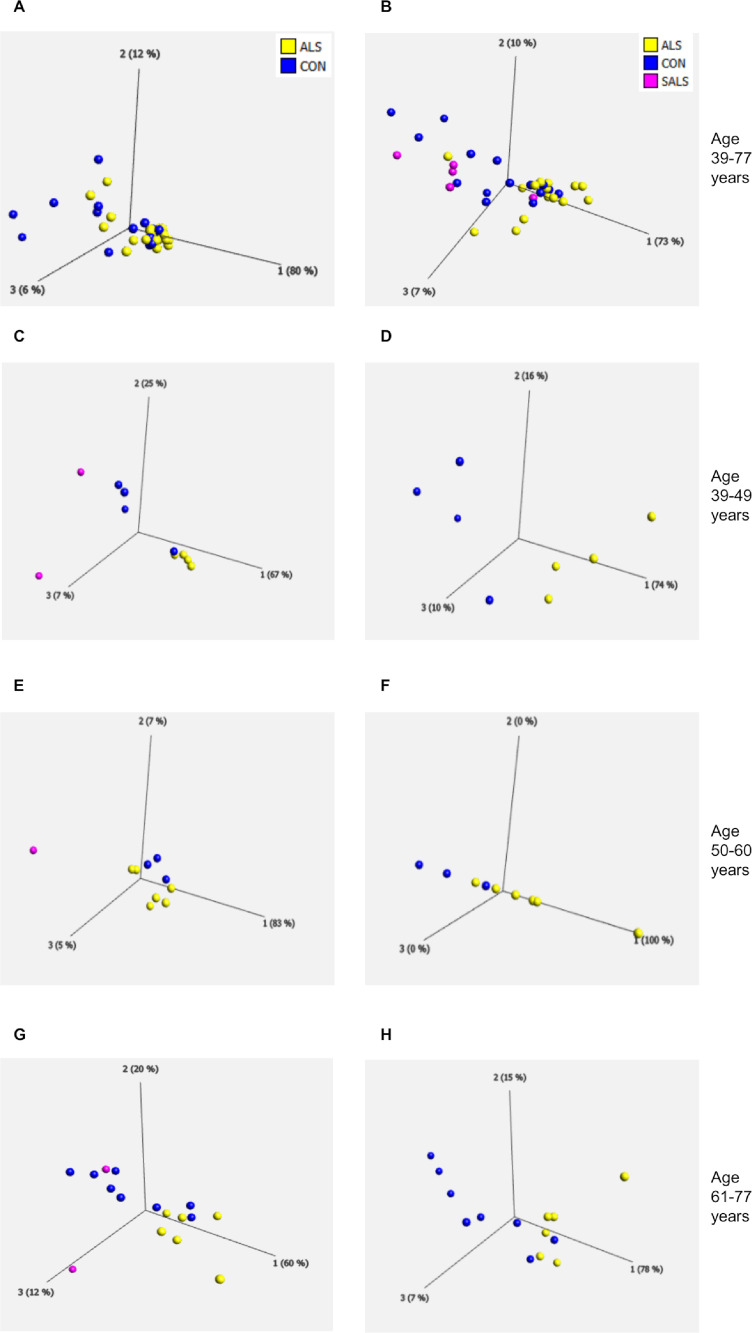
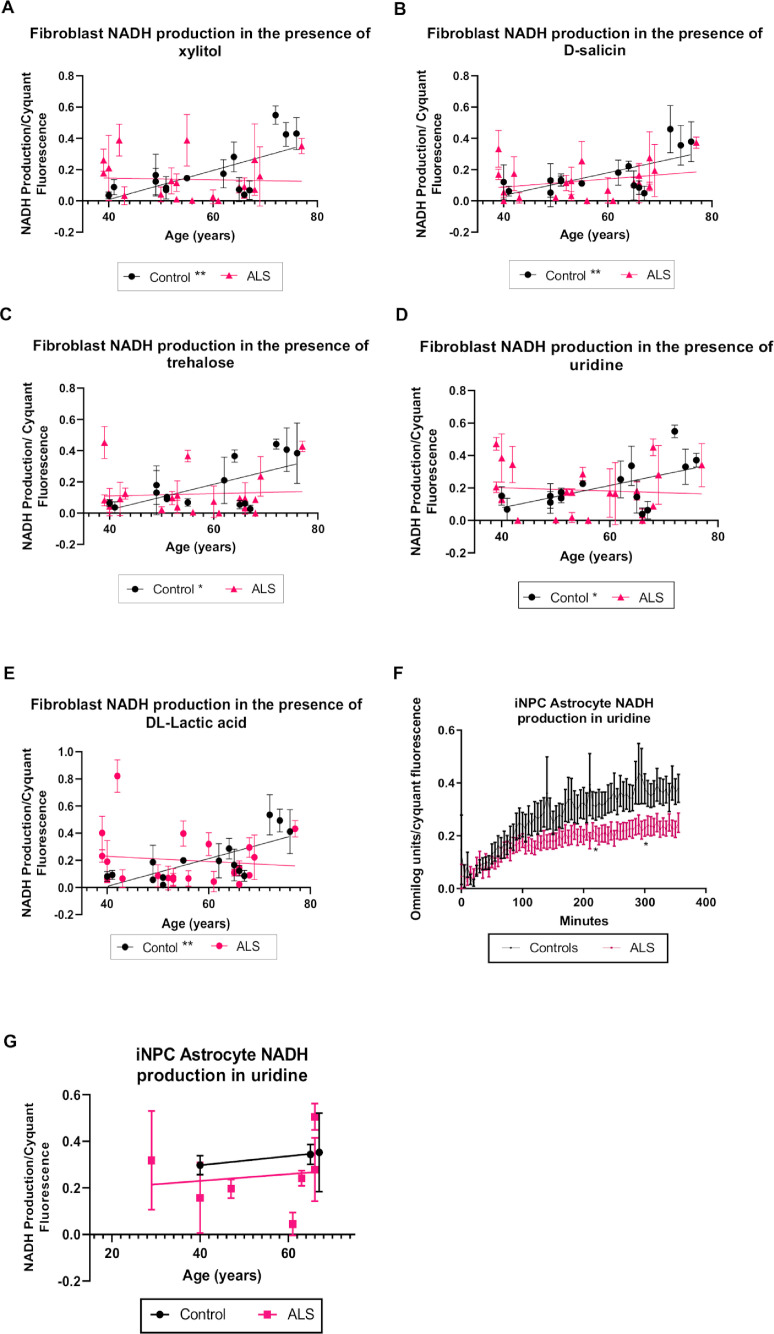
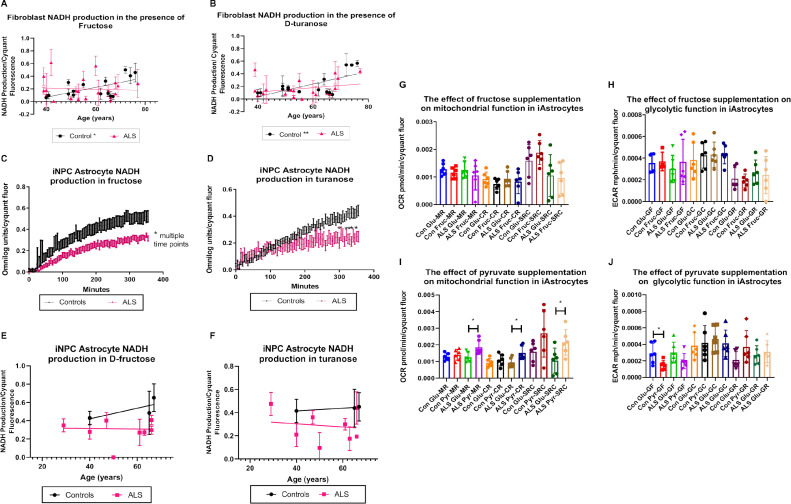
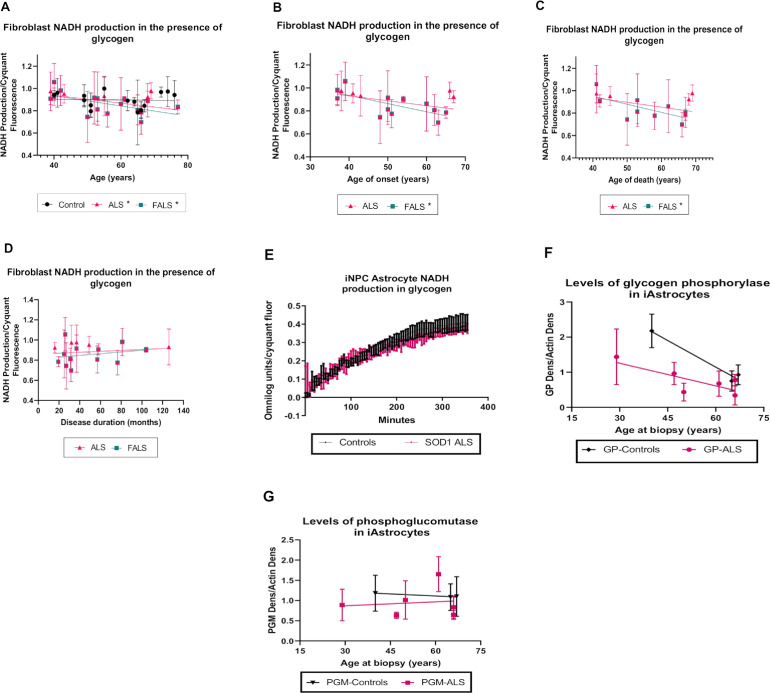
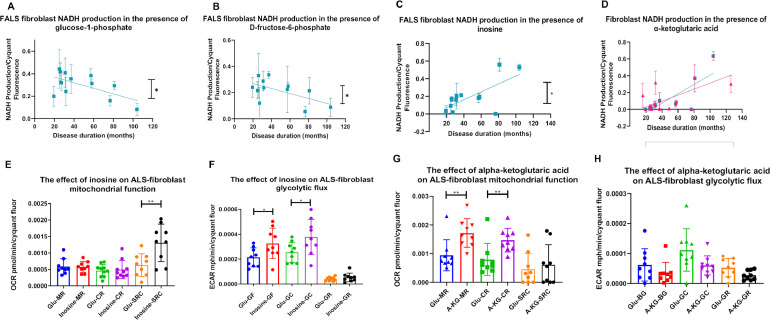
Aging is a major risk factor for neurodegenerative diseases, including amyotrophic lateral sclerosis (ALS). As metabolic alterations are a hallmark of aging and have previously been observed in ALS, it is important to examine the effect of aging in the context of ALS metabolic function. Here, using a newly established phenotypic metabolic approach, we examined the effect of aging on the metabolic profile of fibroblasts derived from ALS cases compared to controls. We found that ALS fibroblasts have an altered metabolic profile, which is influenced by age. In control cases, we found significant increases with age in NADH metabolism in the presence of several metabolites including lactic acid, trehalose, uridine and fructose, which was not recapitulated in ALS cases. Conversely, we found a reduction of NADH metabolism with age of biopsy, age of onset and age of death in the presence of glycogen in the ALS cohort. Furthermore, we found that NADH production correlated with disease progression rates in relation to a number of metabolites including inosine and α-ketoglutaric acid. Inosine or α-ketoglutaric acid supplementation in ALS fibroblasts was bioenergetically favourable. Overall, we found aging related defects in energy substrates that feed carbon into glycolysis at various points as well as the tricarboxylic acid (TCA) cycle in ALS fibroblasts, which was validated in induced neuronal progenitor cell derived iAstrocytes. Our results suggest that supplementing those pathways may protect against age related metabolic dysfunction in ALS.

Keywords: Aging, ALS; Fibroblasts; Metabolism.


Conflict of interest statement

Conflict of interest The authors can state there is no conflict of interest associated with this work.

Figures

Fig 1
Fig. 1
Age influences the metabolic profile of fibroblasts derived from ALS cases (A) PCA of control fibroblasts (blue, Con) and ALS fibroblasts (both FALS and SALS yellow) at the assay end point (300 minutes). (B) PCA of control fibroblasts (blue, Con) and SALS fibroblasts (pink) and FALS fibroblasts (yellow) at the assay end point (300 minutes). (C) PCA of control fibroblasts (blue, Con), SALS fibroblasts (pink) and FALS fibroblasts (yellow) under the age of 50 (39-49 years). (D) PCA of control fibroblasts (blue, Con) and FALS fibroblasts (yellow) under the age of 50 (39-49 years). (E) PCA of control fibroblasts (blue, Con), SALS fibroblasts (pink) and FALS fibroblasts (yellow) between 50-60 years. (F) PCA of control fibroblasts (blue, Con) and FALS fibroblasts (yellow) between 50 and 60 years, (G) PCA of control fibroblasts (blue, Con), SALS fibroblasts (pink) and FALS fibroblasts (yellow) 61-77 years. (H) PCA of control fibroblasts (blue, Con) and FALS fibroblasts (yellow) 61-77 years. Data presented as the mean of at least three biological replicates using 15 control fibroblasts, and 21 ALS fibroblasts. Analysis performed on Qlucore with the p-value set to ≤0.05. Q-values were 0.762 for control fibroblasts versus ALS (FALS+SALS) fibroblasts and 0.395 for control fibroblasts vs FALS fibroblasts. Percentage values represent eigenvectors calculated for each analysis. The higher the percentage the greater the confidence of the separation based on the vector. (Color version of figure is available online)
Fig. 2
Fig. 2
NADH production increases with age in control but not in ALS fibroblasts in the presence of xylitol, D-salicin, trehalose, uridine and lactic acid. (A) NADH production with age in the presence of xylitol. (B) NADH production with age in presence of D-salicin. (C) NADH production with age in presence of trehalose. (D) NADH production with age in presence of uridine. (E) NADH production with age in presence of DL-lactic acid. Data presented as mean with standard deviation of at least three biological repeats per cell line. Pearson’s correlation analysis was performed with the p value set to ≤ 0.05. Control fibroblasts (N=15, black), ALS fibroblasts (SALS and FALS n=21, pink). (F) NADH metabolism in the presence of uridine in iAstrocytes. Two-way annova with Sidaks’s post-test analysis was performed on three control lines and eight ALS lines performed in triplicate. Data presented as mean with standard error. (G) iAstrocyte NADH production with age in the presence of uridine. Data presented as mean with standard deviation *p ≤ 0.05, **p ≤ 0.01. (Color version of figure is available online)
Fig. 3
Fig. 3
NADH production increases with age in control but not in ALS fibroblasts in the presence of fructose energy substrates. (A) NADH production in fibroblasts in the presence of fructose (B) NADH production in fibroblasts in presence of D-turanose. Controls (N=15) shown in black and ALS (SALS and FALS n=21) group showed in pink. Data presented as mean with standard deviation of at least three biological repeats per cell line. Pearson’s correlation analysis was performed with the p value set to ≤ 0.05. (C) NADH metabolism in the presence of fructose in iAstrocytes. (D) NADH metabolism in the presence of turanose in iAstrocytes. Two-way annova with Sidaks’s post-test analysis was performed on three control lines (black) and eight ALS lines (pink) performed in triplicate. Data presented as mean with standard error. (E) NADH production in fructose with age in iAstrocytes. (F) NADH production in turanose with age in iAstrocytes. Data presented as mean with standard deviation. (G) The effect of fructose supplementation on iAstrocyte mitochondrial function. (H) The effect of fructose supplementation on iAstrocyte glycolytic function. (I) The effect of pyruvate supplementation on iAstrocyte mitochondrial function. (J) The effect of pyruvate supplementation on iAstrocyte glycolytic function. (G-J) Data presented as mean with standard deviation of two control and two ALS cases performed in triplicate. Data was analysed using unpaired t-test analysis with a Welch correction. MR = mitochondrial respiration. CR = coupled respiration. SRC = spare respiratory capacity. GF = glycolytic flux. GC = glycolytic capacity. GR = glycolytic reserve. *p ≤ 0.05, **p ≤ 0.01. (Color version of figure is available online)
Fig. 4
Fig. 4
NADH metabolism in glycogen is reduced with age in ALS fibroblasts. (A) NADH production in fibroblasts in the presence of glycogen correlated with age of biopsy (B) NADH production in presence of glycogen as the sole energy source correlated with age of onset. (C) NADH production in presence of glycogen as the sole energy source correlated with age of death. (D) NADH production in presence of glycogen as the sole energy source correlated with disease duration. Data presented as mean with standard deviation of at least three biological repeats per cell line. Pearson’s correlation analysis was performed with the p value set to ≤ 0.05. Control fibroblasts (N=15, black), ALS fibroblasts (SALS and FALS, maximum n=21, pink, FALS only maximum n=16 blue). (E) NADH production in the presence of glycogen in SOD1 iAstrocytes. Data presented as mean with standard error 3 controls (black) vs 2 SOD1 cases (pink). (F) The effect of age on glycogen phosphorylase (GP) levels in iAstrocytes. (G) The effect of age on phosphoglucomutase (PGM) levels in iAstrocytes. Data presented as mean with standard deviation. *p ≤ 0.05. (Color version of figure is available online)
Fig. 5
Fig. 5
Disease progression length correlates with NADH metabolism in the presence of glucose-1-phosphate, D-fructose-6-phosphate, inosine and α-ketoglutaric-acid. (A) NADH production in FALS fibroblasts with glucose-1-phosphate as the sole energy source correlated with disease duration. (B) NADH production in FALS fibroblasts with D-fructose-6-phosphate as the sole energy source correlated with disease duration. (C) NADH production in FALS fibroblasts with inosine is the sole energy source correlated with disease duration. (D) NADH production with α-ketoglutaric-acid as the sole energy source correlated with disease duration. All data presented as mean with standard deviation of at least three biological repeats per cell line. Pearson’s correlation analysis was performed with the p value set to ≤ 0.05. ALS fibroblasts (n=17, pink), FALS fibroblasts (n=12, blue). (E) The effect of inosine supplementation on ALS fibroblast mitochondrial function. (F) The effect of inosine supplementation on ALS fibroblast glycolytic function. (G) The effect of α-ketoglutaric acid supplementation on ALS fibroblast mitochondrial function. (F) The effect of α-ketoglutaric acid supplementation on ALS fibroblast glycolytic function. Data presented as mean with standard deviation of three ALS cases performed in triplicate. MR = mitochondrial respiration. CR = coupled respiration. SRC = spare respiratory capacity. GF = glycolytic flux. GC = glycolytic capacity. GR = glycolytic reserve. Unpaired-test with Welch correction (E/F/H) or Mann-Whitney analysis (G) was performed on three ALS fibroblast cases in triplicate. Data presented as mean with standard deviation. *p ≤ 0.05, **p ≤ 0.01. (Color version of figure is available online)

Similar articles

Cited by

References

    1. Aguib Y., Heiseke A., Gilch S., Riemer C., Baier M., Schatzl H.M., Ertmer A. Autophagy induction by trehalose counteracts cellular prion infection. Autophagy. 2009;5(3):361–369. - PubMed
    1. Ajroud-Driss S., Siddique T. Sporadic and hereditary amyotrophic lateral sclerosis (ALS) Biochim. Biophys. Acta. 2015;1852(4):679–684. - PubMed
    1. Akao T., Yoshino T., Kobashi K., Hattori M. Evaluation of salicin as an antipyretic prodrug that does not cause gastric injury. Planta Med. 2002;68(8):714–718. - PubMed
    1. Allen S.P., Duffy L.M., Shaw P.J., Grierson A.J. Altered age-related changes in bioenergetic properties and mitochondrial morphology in fibroblasts from sporadic amyotrophic lateral sclerosis patients. Neurobiol. Aging. 2015;36(10):2893–2903. - PubMed
    1. Allen S.P., Hall B., Castelli L.M., Francis L., Woof R., Siskos A.P., Kouloura E., Gray E., Thompson A.G., Talbot K., Higginbottom A., Myszczynska M., Allen C.F., Stopford M.J., Hemingway J., Bauer C.S., Webster C.P., De Vos K.J., Turner M.R., Keun H.C., Hautbergue G.M., Ferraiuolo L., Shaw P.J. Astrocyte adenosine deaminase loss increases motor neuron toxicity in amyotrophic lateral sclerosis. Brain. 2019;142(3):586–605. - PMC - PubMed

Publication types