. 2021 Jun 29;12(3):e0004021.
doi: 10.1128/mBio.00040-21. Epub 2021 May 28.

Movements of Mycoplasma mobile Gliding Machinery Detected by High-Speed Atomic Force Microscopy

Affiliations

Movements of Mycoplasma mobile Gliding Machinery Detected by High-Speed Atomic Force Microscopy

Kohei Kobayashi et al. mBio. .

Abstract

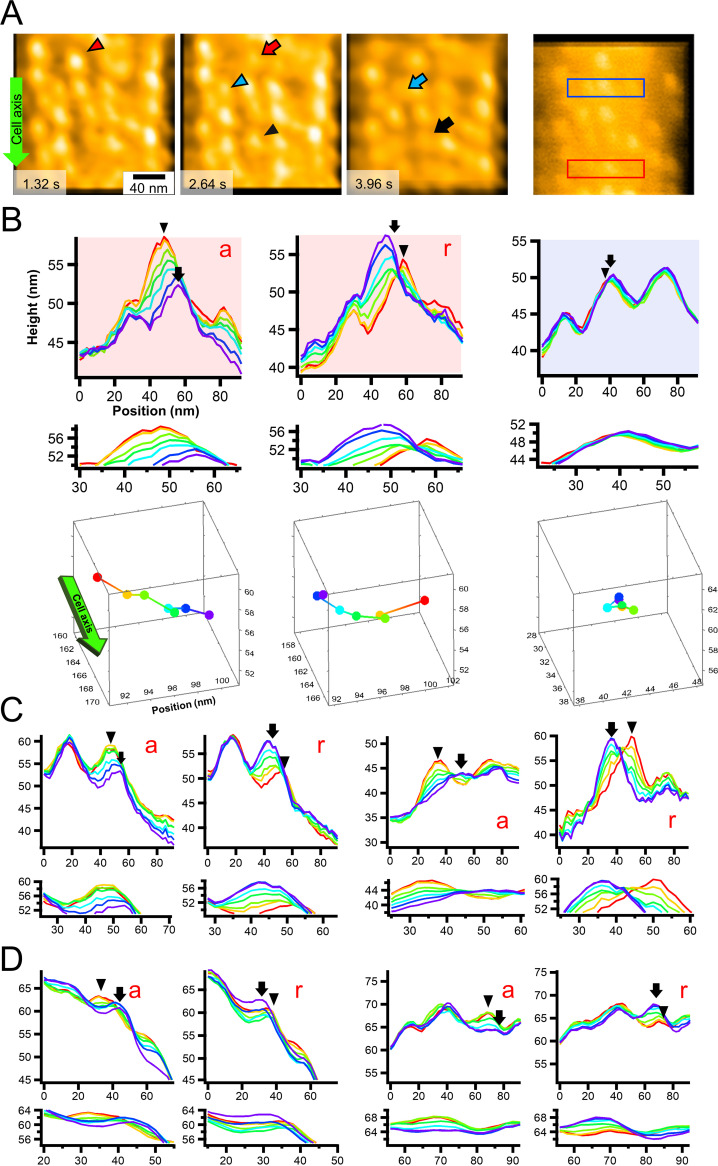
Mycoplasma mobile, a parasitic bacterium, glides on solid surfaces, such as animal cells and glass, by a special mechanism. This process is driven by the force generated through ATP hydrolysis on an internal structure. However, the spatial and temporal behaviors of the internal structures in living cells are unclear. In this study, we detected the movements of the internal structure by scanning cells immobilized on a glass substrate using high-speed atomic force microscopy (HS-AFM). By scanning the surface of a cell, we succeeded in visualizing particles, 2 nm in height and aligned mostly along the cell axis with a pitch of 31.5 nm, consistent with previously reported features based on electron microscopy. Movements of individual particles were then analyzed by HS-AFM. In the presence of sodium azide, the average speed of particle movements was reduced, suggesting that movement is linked to ATP hydrolysis. Partial inhibition of the reaction by sodium azide enabled us to analyze particle behavior in detail, showing that the particles move 9 nm right, relative to the gliding direction, and 2 nm into the cell interior in 330 ms and then return to their original position, based on ATP hydrolysis. IMPORTANCE The Mycoplasma genus contains bacteria generally parasitic to animals and plants. Some Mycoplasma species form a protrusion at a pole, bind to solid surfaces, and glide by a special mechanism linked to their infection and survival. The special machinery for gliding can be divided into surface and internal structures that have evolved from rotary motors represented by ATP synthases. This study succeeded in visualizing the real-time movements of the internal structure by scanning from the outside of the cell using an innovative high-speed atomic force microscope and then analyzing their behaviors.

Keywords: AFM; ATPase; class Mollicutes; pathogenic bacteria; probing.


Figures

FIG 1
FIG 1
Experimental design and conditions for HS-AFM observation. (A) Schematic illustrations of M. mobile gliding machinery. The gliding machinery formed as a protrusion can be divided into surface (left) and internal (right) structures. The surface structure is composed of about 450 units, including three large proteins—Gli123 (purple), Gli521 (green), and Gli349 (red)—as shown at the bottom. Gli349 repeatedly catches sialylated oligosaccharides fixed on the solid surface and pulls the cell forward. The internal structure can be divided into a large mass at the cell front, “bell” and a chain structure. The chain structure is composed of particles that have been suggested to evolve from F-type ATPase/synthase. (B) Schematic illustration of an M. mobile cell being scanned by high-speed atomic force microscopy (HS-AFM). The surface of an immobilized cell on glass stage (blue) is scanned by an AFM cantilever probe (gray), and the cantilever movement is monitored by a detector (green). (C) Phase-contrast image of M. mobile cells on a coverslip. Living cells were immobilized onto a coverslip using poly-l-lysine and glutaraldehyde. (D) Quick-freeze, deep-etch electron microscopic (EM) image of M. mobile cells on a coverslip. The cell was immobilized on the coverslip by poly-l-lysine and glutaraldehyde (left) and allowed to glide on the coverslip coated with sialylated oligosaccharides (right). The cell axis and front are indicated by a green arrow in panels A and D.
FIG 2
FIG 2
Chain imaging by HS-AFM. (A) (Left) Cluster of cells immobilized on a glass surface (upper) and distribution of cell dimensions (n = 20) (lower). (Right) The height profile along the broken line (upper) is plotted along the green arrow (lower). The cell axis and front are shown by an arrow. (B) Detailed structure of a cell. (Left) Whole-cell image. The cell axis and front are indicated by a green arrow. (Middle) Magnified image of the boxed area of the left panel. (Right) The middle panel image was processed with a bandpass filter. (C to F) Image analyses of particles. (C) Cell image featuring a representative chain structure. The cell axis and front are indicated by a green arrow. (D) Distribution of chain angle relative to the cell axis fitted by a Gaussian curve (n = 99 chains from 20 cells). (E) Image profile of the boxed area along the direction of blue arrow in panel C. (F) Scatter dot plot for distances between peak positions of the chain profile. The average was 31.5 ± 4.9 nm (n = 98). (G) Three-dimensional rendered image for a 146-nm-thick slice of permeabilized cell reconstructed by electron cryotomography, modified from a previous study (5). The surface filamentous structures, cell membrane, undercoating at the front and side membranes, and internal chain are colored red, orange, yellow, and purple, respectively. (H) Averaged image of 19 particle structures from HS-AFM (upper) and image profile of boxed area (lower). The profile (orange squares) was fitted by the sum (purple solid line) of two Gaussian curves (red and blue). Yellow triangles show peaks of the Gaussian curves. (I) Averaged images of chain structure (blue part in panel G) from electron cryotomography (upper) (5) and image profile of the boxed area along the chain axis (lower). Yellow triangles show peaks of Gaussian curves. In all HS-AFM imaging, the surface was scanned left to right for line and lower to upper for image.
FIG 3
FIG 3
Effects of sodium azide on particle displacements. (A) Rainbow traces of gliding cells for 5 s with and without sodium azide from phase-contrast microscopy. Video frames were overlaid with different colors from red to blue. (B) Gliding speed under various concentrations of sodium azide. Speeds of 2.5 to 20 s were averaged for 140 to 223 cells. (C) HS-AFM images with continuous traces of individual particles for 13.2 s. HS-AFM images were processed by bandpass filter, drift correction, and sequential averaging. Particles were traced every 200 ms for no sodium azide, and 330 ms in the presence of sodium azide, as presented by the color change from red to blue. The cell axis and front are indicated by a green arrow. The surface was scanned left to right for line and lower to upper for imaging. Movies are shown as supplemental data as Movies S4, S5, S6, and S7 for imaging in 0, 15.4, 76.5, 765 mM sodium azide, respectively. (D) Time course of accumulated moving distances of individual particles under various concentrations of sodium azide. (E) Scatter dot plot of particle speed under various concentrations of sodium azide. Speeds were estimated from a linear fitting of accumulated moving distance.
FIG 4
FIG 4
Movements of individual particles. (A) Video frames of particle chains under 15.4 mM sodium azide (Movie S5). The green arrow on the left shows the cell axis and front. The left three panels show consecutive video frames showing remarkable particle movements. The particles with movements are marked before (triangles) and after (arrows) the movements with coordinated colors. Particles moved to the left relative to the gliding direction. The rightmost panel shows a raw image of the video frame showing areas profiled for active (red) and static (blue) particles shown in panel B. (B) Consecutive image profile of representative active and static particles. (Upper six graphs) Image profiles of active (red background) and static (blue background) particles every 330 ms for 1.98 s. (Lowermost graphs) Three-dimensional positions of peaks of particles tracing from red to purple. Y positions are shown only in these graphs in Fig. 4. The green arrow on the left shows the cell axis and front. (C) Consecutive image profiles showing particle movements every 330 ms for 1.98 s in 15.4 mM sodium azide. (D) Consecutive image profiles showing particle movements every 200 ms for 1.2 s without sodium azide (Movie S4). (B to D) Consecutive profiles of each frame from red to purple. Advancing (a) and returning (r) movements are presented. Peak positions of focusing particles are marked by a triangle and an arrow, respectively, for the initial and the end time points. Distances between peaks before and after movement were manually measured for statistical analysis of particle movements. The profile of heights and positions is presented with a common X- Y- scale in the lower panel for each data set.
FIG 5
FIG 5
Analyses of particle distribution. (A) Distribution of particles in a chain. The particle positions and the axis of the particle positions are indicated by red dots and gray dashed lines, respectively. The particle positions were detected every 200 and 330 ms, respectively, without and with sodium azide at 82, 66, 70, and 66 points under 0, 15.4, 76.5, and 765 mM sodium azide, respectively. The axis of particle positions was determined by a linear approximation of the average position of each particle. (B) Schematic illustration of three distances with average and standard deviation (SD) values in nm. (C to E) The particle position to the chain axis (C, purple), the distance to the adjacent particle (D, blue), and the distance to the adjacent particle projected to the chain axis (E, green) are shown. Bar lengths are not to scale. Movies S4 to S7 were analyzed. The chain axis is indicated by a green arrow pointing mostly to the cell front in panels A and B.
FIG 6
FIG 6
Schematic illustration of particle movement in M. mobile visualized by HS-AFM. The internal chain of the gliding machinery and cell membrane are indicated by blue objects and a beige plate, respectively. Here, we focus on the particle chain lining the lower side of cell membrane, while we scanned mostly the particle chain beneath the upper side of the cell membrane in this study. The left and right panels show the particles before and after the advancing movement, respectively. The central particle moves as an ATP- or ADP/Pi-bound form to the right and inner sides for a distance of 9 and 2 nm, respectively.

Similar articles

Cited by

References

    1. Miyata M, Robinson RC, Uyeda TQP, Fukumori Y, Fukushima SI, Haruta S, Homma M, Inaba K, Ito M, Kaito C, Kato K, Kenri T, Kinosita Y, Kojima S, Minamino T, Mori H, Nakamura S, Nakane D, Nakayama K, Nishiyama M, Shibata S, Shimabukuro K, Tamakoshi M, Taoka A, Tashiro Y, Tulum I, Wada H, Wakabayashi KI. 2020. Tree of motility: a proposed history of motility systems in the tree of life. Genes Cells 25:6–21. doi:10.1111/gtc.12737. - DOI - PMC - PubMed
    1. Nakamura S, Minamino T. 2019. Flagella-driven motility of bacteria. Biomolecules 9:279. doi:10.3390/biom9070279. - DOI - PMC - PubMed
    1. Adan-Kubo J, Yoshii SH, Kono H, Miyata M. 2012. Molecular structure of isolated MvspI, a variable surface protein of the fish pathogen Mycoplasma mobile. J Bacteriol 194:3050–3057. doi:10.1128/JB.00208-12. - DOI - PMC - PubMed
    1. Kawamoto A, Matsuo L, Kato T, Yamamoto H, Namba K, Miyata M. 2016. Periodicity in attachment organelle revealed by electron cryotomography suggests conformational changes in gliding mechanism of Mycoplasma pneumoniae. mBio 7:e00243-16–e00216. doi:10.1128/mBio.00243-16. - DOI - PMC - PubMed
    1. Nishikawa M, Nakane D, Toyonaga T, Kawamoto A, Kato T, Namba K, Miyata M. 2019. Refined mechanism of Mycoplasma mobile gliding based on structure, ATPase activity, and sialic acid binding of machinery. mBio 10:e02846-19. doi:10.1128/mBio.02846-19. - DOI - PMC - PubMed

Publication types

Supplementary concepts

LinkOut - more resources