

Chromosomal characteristics of salt stress heritable gene expression in the rice genome
- PMID: 34044788
- PMCID: PMC8162008
- DOI: 10.1186/s12863-021-00970-7
Chromosomal characteristics of salt stress heritable gene expression in the rice genome
Abstract
Background: Gene expression is potentially an important heritable quantitative trait that mediates between genetic variation and higher-level complex phenotypes through time and condition-dependent regulatory interactions. Therefore, we sought to explore both the genomic and condition-specific characteristics of gene expression heritability within the context of chromosomal structure.
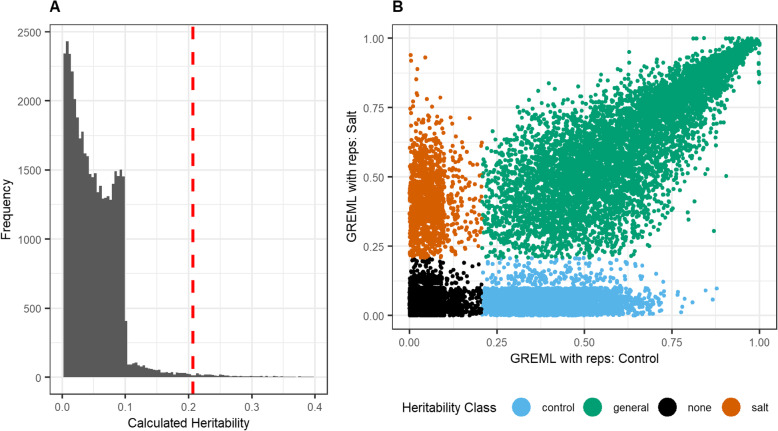
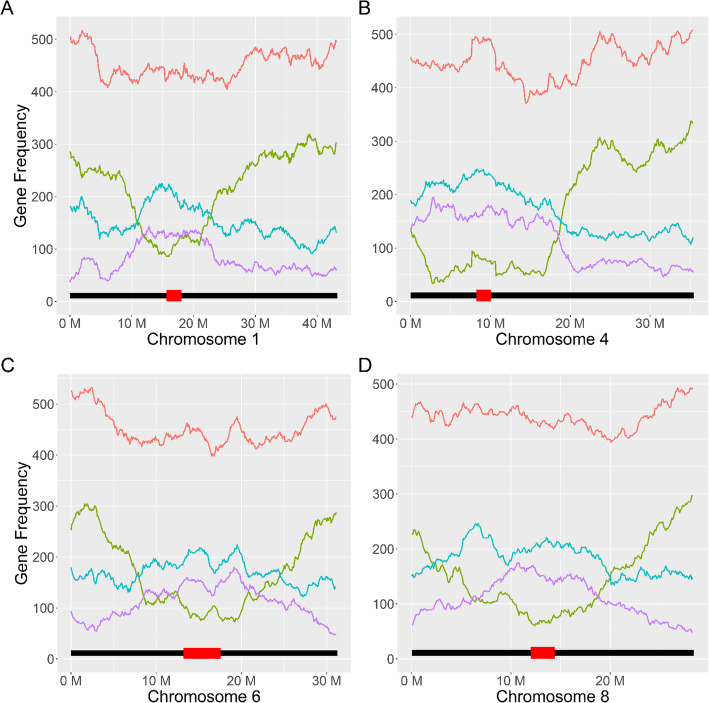
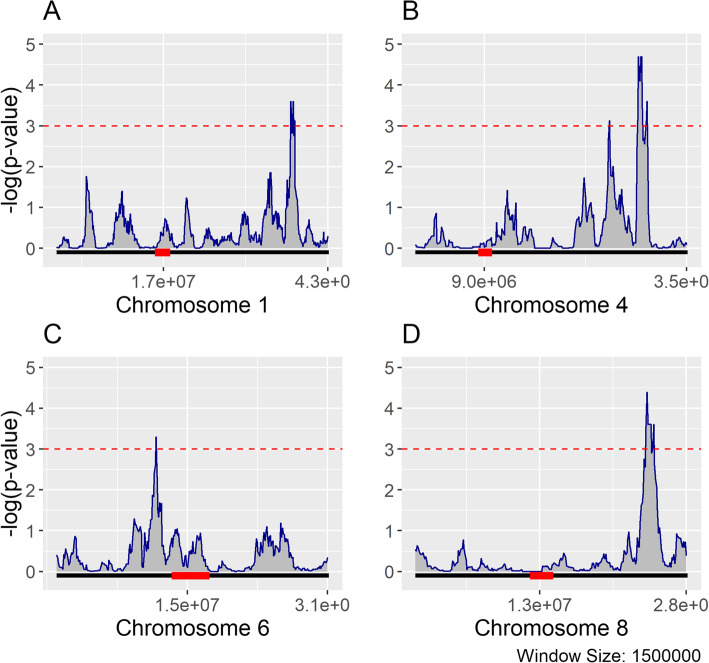
Results: Heritability was estimated for biological gene expression using a diverse, 84-line, Oryza sativa (rice) population under optimal and salt-stressed conditions. Overall, 5936 genes were found to have heritable expression regardless of condition and 1377 genes were found to have heritable expression only during salt stress. These genes with salt-specific heritable expression are enriched for functional terms associated with response to stimulus and transcription factor activity. Additionally, we discovered that highly and lowly expressed genes, and genes with heritable expression are distributed differently along the chromosomes in patterns that follow previously identified high-throughput chromosomal conformation capture (Hi-C) A/B chromatin compartments. Furthermore, multiple genomic hot-spots enriched for genes with salt-specific heritability were identified on chromosomes 1, 4, 6, and 8. These hotspots were found to contain genes functionally enriched for transcriptional regulation and overlaps with a previously identified major QTL for salt-tolerance in rice.
Conclusions: Investigating the heritability of traits, and in-particular gene expression traits, is important towards developing a basic understanding of how regulatory networks behave across a population. This work provides insights into spatial patterns of heritable gene expression at the chromosomal level.
Keywords: Agronomy; Genetics; Heritability; RNAseq; Transcriptomics.
Conflict of interest statement
The authors declare they have no competing interests.
Figures
Similar articles
-
Functional classification, genomic organization, putatively cis-acting regulatory elements, and relationship to quantitative trait loci, of sorghum genes with rhizome-enriched expression.Plant Physiol. 2006 Nov;142(3):1148-59. doi: 10.1104/pp.106.082891. Epub 2006 Sep 22. Plant Physiol. 2006. PMID: 16998090 Free PMC article.
-
QTL analysis of novel genomic regions associated with yield and yield related traits in new plant type based recombinant inbred lines of rice (Oryza sativa L.).BMC Plant Biol. 2012 Aug 9;12:137. doi: 10.1186/1471-2229-12-137. BMC Plant Biol. 2012. PMID: 22876968 Free PMC article.
-
Transcriptome Analysis of Salt Stress Responsiveness in the Seedlings of Dongxiang Wild Rice (Oryza rufipogon Griff.).PLoS One. 2016 Jan 11;11(1):e0146242. doi: 10.1371/journal.pone.0146242. eCollection 2016. PLoS One. 2016. PMID: 26752408 Free PMC article.
-
Toward understanding genetic mechanisms of complex traits in rice.J Genet Genomics. 2010 Oct;37(10):653-66. doi: 10.1016/S1673-8527(09)60084-9. J Genet Genomics. 2010. PMID: 21035092 Review.
-
Salt stress response in rice: genetics, molecular biology, and comparative genomics.Funct Integr Genomics. 2006 Oct;6(4):263-84. doi: 10.1007/s10142-006-0032-5. Epub 2006 Jul 25. Funct Integr Genomics. 2006. PMID: 16819623 Review.
Cited by
-
Reconstitution of functional tight junctions with individual claudin subtypes in epithelial cells.Cell Struct Funct. 2023 Jan 20;48(1):1-17. doi: 10.1247/csf.22068. Epub 2022 Dec 9. Cell Struct Funct. 2023. PMID: 36504093 Free PMC article.
-
Establishment and Maintenance of Heat-Stress Memory in Plants.Int J Mol Sci. 2024 Aug 18;25(16):8976. doi: 10.3390/ijms25168976. Int J Mol Sci. 2024. PMID: 39201662 Free PMC article. Review.
-
Comparative transcriptomic analyses of diploid and tetraploid citrus reveal how ploidy level influences salt stress tolerance.Front Plant Sci. 2024 Oct 30;15:1469115. doi: 10.3389/fpls.2024.1469115. eCollection 2024. Front Plant Sci. 2024. PMID: 39544537 Free PMC article.
-
Identifying stress responsive genes using overlapping communities in co-expression networks.BMC Bioinformatics. 2021 Nov 7;22(1):541. doi: 10.1186/s12859-021-04462-4. BMC Bioinformatics. 2021. PMID: 34743699 Free PMC article.
References
-
- Hammond JP, Mayes S, Bowen HC, Graham NS, Hayden RM, Love CG, Spracklen WP, Wang J, Welham SJ, White PJ, King GJ, Broadley MR. Regulatory hotspots are associated with plant gene expression under varying soil phosphorus supply in brassica rapa. Plant Physiol. 2011;156(3):1230–1241. doi: 10.1104/pp.111.175612. - DOI - PMC - PubMed
Publication types
MeSH terms
LinkOut - more resources
Full Text Sources
Other Literature Sources