. 2021 May 28;21(1):629.
doi: 10.1186/s12885-021-08354-x.

Metformin alters therapeutic effects in the BALB/c tumor therapy model

Affiliations

Metformin alters therapeutic effects in the BALB/c tumor therapy model

Felix B Meyer et al. BMC Cancer. .

Abstract

Background: Despite considerable medical proceedings, cancer is still a leading cause of death. Major problems for tumor therapy are chemoresistance as well as toxic side effects. In recent years, the additional treatment with the antidiabetic drug metformin during chemotherapy showed promising results in some cases. The aim of this study was to develop an in vitro tumor therapy model in order to further investigate the potential of a combined chemotherapy with metformin.

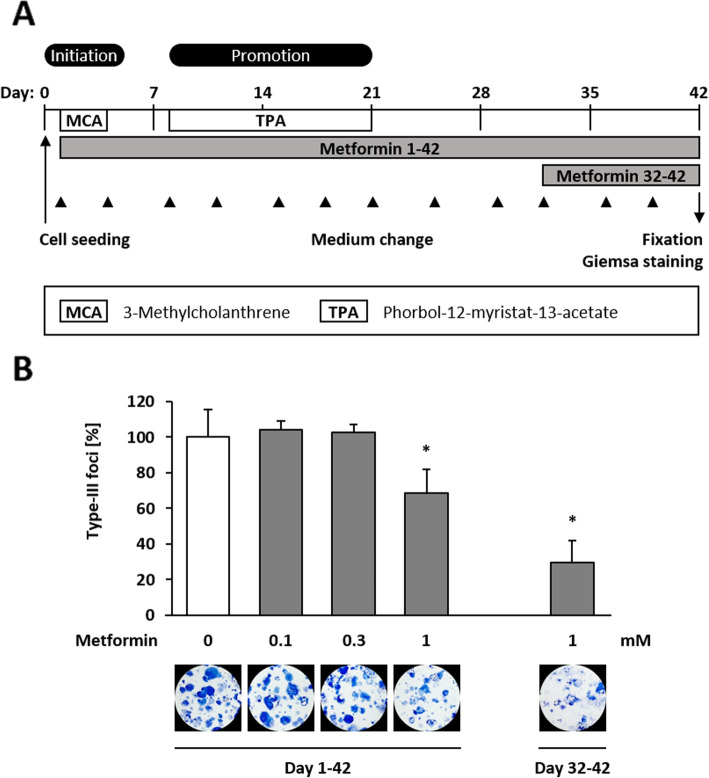
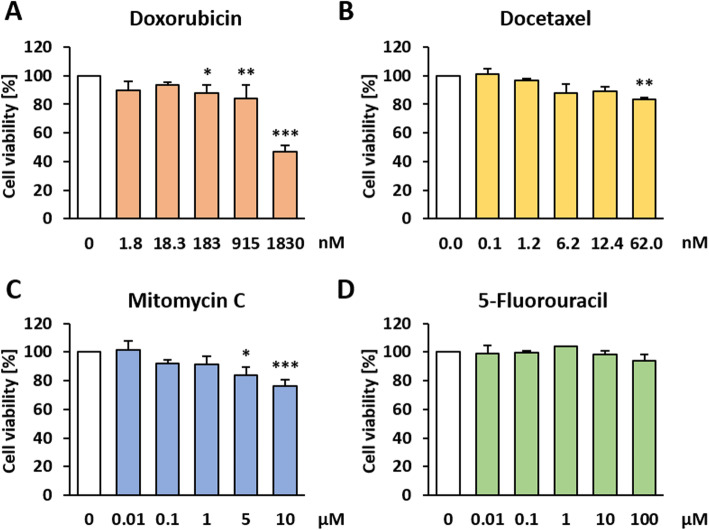
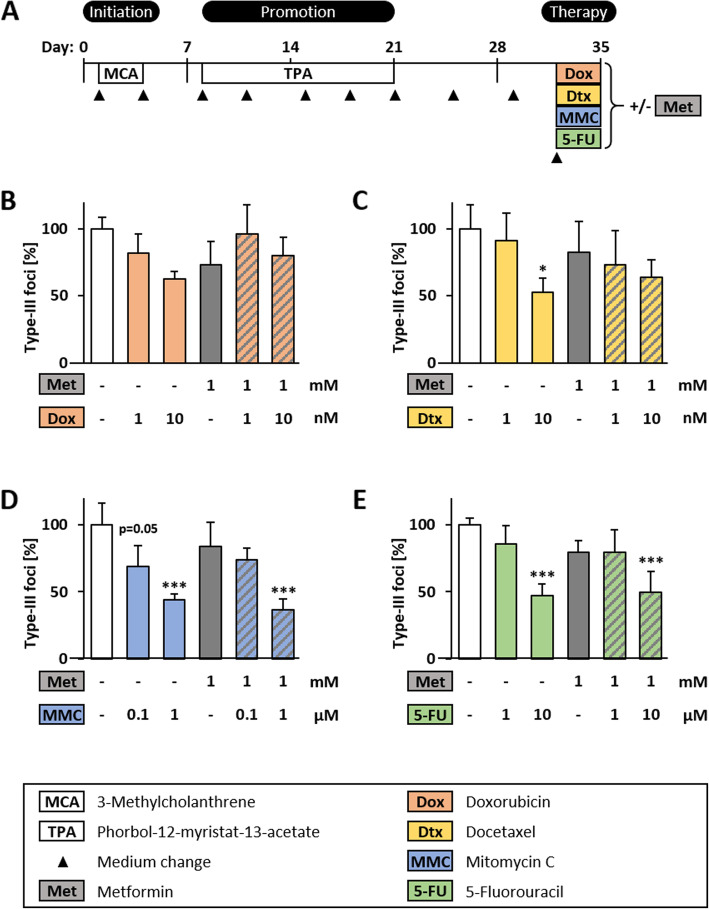
Methods: Cytotoxic effects of a combined treatment on BALB/c fibroblasts were proven by the resazurin assay. Based on the BALB/c cell transformation assay, the BALB/c tumor therapy model was established successfully with four different and widely used chemotherapeutics from different categories. Namely, Doxorubicin as a type-II isomerase inhibitor, Docetaxel as a spindle toxin, Mitomycin C as an alkylating agent and 5-Fluorouracil as an antimetabolite. Moreover, glucose consumption in the medium supernatant was measured and protein expressions were determined by Western Blotting.

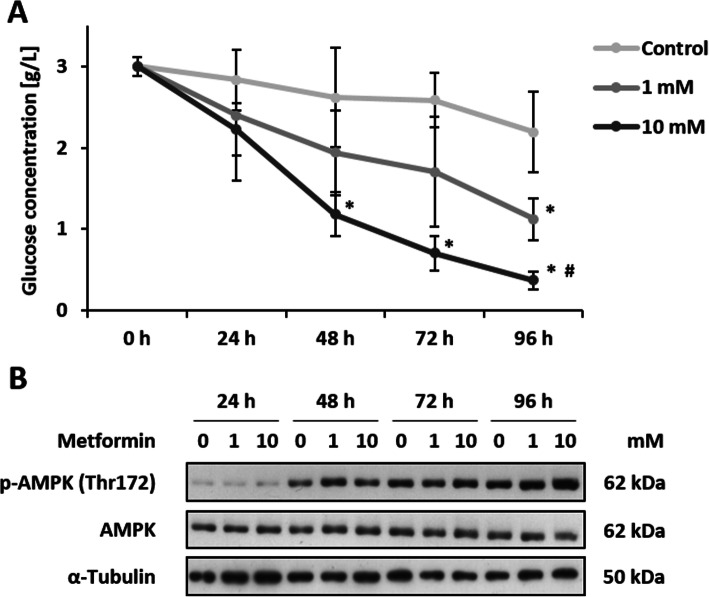
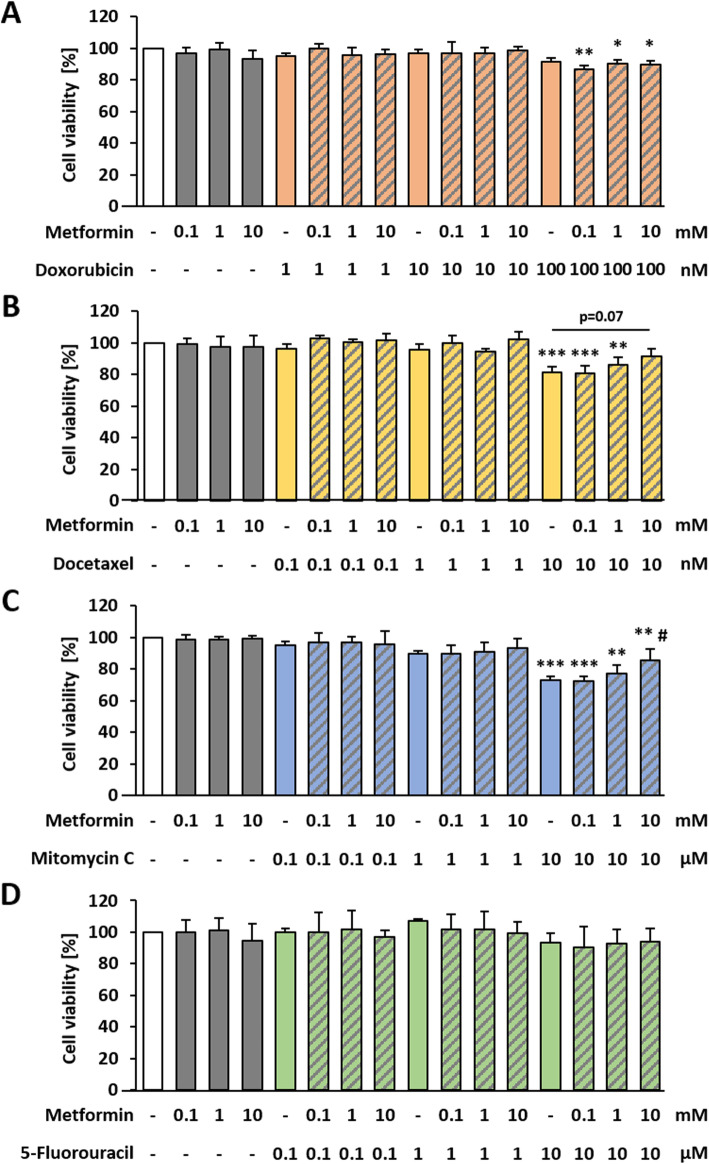
Results: Initial tests for the combined treatment with metformin indicated unexpected results as metformin could partly mitigate the cytotoxic effects of the chemotherapeutic agents. These results were further confirmed as metformin induced resistance to some of the drugs when applied simultaneously in the tumor therapy model. Mechanistically, an increased glucose consumption was observed in non-transformed cells as well as in the mixed population of malignant transformed cell foci and non-transformed monolayer cells, suggesting that metformin could also increase glucose consumption in transformed cells.

Conclusion: In conclusion, this study suggests a cautious use of metformin during chemotherapy. Moreover, the BALB/c tumor therapy model offers a potent tool for further mechanistic studies of drug-drug interactions during cancer therapy.

Keywords: Adjuvant; Cancer; Energy metabolism; In vitro model; Metformin.


Conflict of interest statement

The authors declare that they have no competing interests.

Figures

Fig. 1
Fig. 1
Altered energy metabolism after metformin treatment. Non-transformed BALB/c cells were seeded in 10 cm cell culture dishes and allowed to grow confluent for 72 h. Afterwards, cells were treated with 1 or 10 mM metformin. Medium supernatant was collected after 0, 24, 48, 72 and 96 h and cells were harvested for protein analysis. a Glucose concentration was measured and data are shown as mean + SD of 3 biological replicates. Statistical differences were calculated with a one-way ANOVA (post-hoc: Bonferroni or Dunnett-T3) with * = (p < 0.05) vs. control and # = (p < 0.05) vs. 1 mM metformin for each point in time. b Proteins were extracted and protein expression as well as phosphorylation levels of AMPK at Thr172 were detected via immunoblot in 3 biological replicates. After detection of p-AMPK, the membrane was stripped two times and re-probed with AMPK mAB and α-Tubulin mAB to confirm equal loading. Images shown are cropped from full-length blots represented in Additional file 2: Supplementary Figure 2
Fig. 2
Fig. 2
Anti-carcinogenic effect of Metformin in the BALB-CTA. a The BALB/c 3 T3 cell transformation assay was performed according to the recommended protocol. In brief, cells were seeded in 6-well plates and treated with the tumor initiator MCA (0.5 μg/ml) on day 1–4 and the tumor promotor TPA (0.3 μg/ml) from day 8–21 in order to induce malignant cell transformation. Metformin was added additionally either chronical from day 1–42 or in the late phase of malignant cell transformation from day 32–42. On day 42, cells were fixed with methanol and stained with Giemsa solution for better visualization of cell foci. b Representative pictures and the number of type-III foci of 3 biological replicates (mean + SD) are shown. Statistical differences were calculated with a one-way ANOVA (post-hoc: Bonferroni) with * = (p < 0.05) vs. control
Fig. 3
Fig. 3
Cytotoxic effects of chemotherapeutics on BALB/c cells. Non-transformed BALB/c cells were seeded in 96 well plates and allowed to grow confluent for 48 h. Afterwards, cells were treated for 24 h with different concentrations of a Doxorubicin, b Docetaxel, c Mitomycin C or d 5-Fluorouracil. Cell viability was measured indirectly by the reduction of resazurin to fluorescent resorufin. Data are shown as mean + SD of 3 biological replicates. Statistical differences were calculated with a one-way ANOVA (post-hoc: two sided Dunnett-T or Dunnett-T3) with * = (p < 0.05); ** = (p < 0.01) and *** = (p < 0.001) vs. control
Fig. 4
Fig. 4
Establishment of the BALB/c tumor therapy model (BALB-TTM) with chemotherapeutic agents. a The BALB/c 3 T3 cell transformation assay was performed as described earlier. An additional treatment was conducted on day 32 with Doxorubicin (Dox), Doxetaxel (Dtx), Mitomycin C (MMC) or 5-Fluorouracil (5-FU) for 72 h and cells were fixed on day 35. Representative pictures and the number of type-III foci of 3 biological replicates (mean + SD) are shown for different concentrations of b Doxorubicin, c Docetaxel, d Mitomycin C and e 5-Fluorouracil. Statistical differences were calculated with a one-way ANOVA (post-hoc: Bonferroni or Dunnett-T3) with ** = (p < 0.01) and *** = (p < 0.001) vs. control
Fig. 5
Fig. 5
Cytotoxic effects of chemotherapeutics plus metformin on BALB/c cells. Non-transformed BALB/c cells were seeded in 96 well plates and allowed to grow confluent for 48 h. Afterwards, cells were treated for 24 h with different concentrations of a Doxorubicin, b Docetaxel, c Mitomycin C or d 5-Fluorouracil alone or in combination with different concentrations of metformin. Cell viability was measured indirectly by the reduction of resazurin to fluorescent resorufin. Data are shown as mean + SD of 3 biological replicates. Statistical differences were calculated with a one-way ANOVA (post-hoc: two sided Dunnett-T or Dunnett-T3) with * = (p < 0.05); ** = (p < 0.01) and *** = (p < 0.001) vs. control and # = (p < 0.05) vs. 10 μM Mitomycin C
Fig. 6
Fig. 6
Combined treatment with chemotherapeutic agents plus metformin in the BALB-TTM. a The BALB/c 3 T3 cell transformation assay was performed as described earlier. An additional treatment was conducted on day 32 with Doxorubicin, Doxetaxel, Mitomycin C or 5-Fluorouracil alone or in combination with metformin for 72 h and cell were fixed on day 35. The number of type-III foci of 4 biological replicates (mean + SD) are shown for different concentrations of b Doxorubicin, c Docetaxel, d Mitomycin C and e 5-Fluorouracil in combination with 1 mM metformin. Statistical differences were calculated with a one-way ANOVA (post-hoc: Bonferroni) with * = (p < 0.05) and *** = (p < 0.001) vs. control
Fig. 7
Fig. 7
Metformin alters glucose consumption in the BALB-TTM. The BALB/c 3 T3 cell transformation assay was performed as described earlier. An additional treatment was conducted from day 32–35 with metformin. On day 35 and 38, fresh medium without metformin was added again. Control cells were not treated with MCA/TPA. Medium supernatant was collected at day 32, 33, 34, 35, 38 and 42 and glucose concentration was measured. The slanting lines indicate the decrease of glucose after fresh medium with 3.15 g/l D-glucose was added every 3–4 days. Statistical differences were calculated with a one-way ANOVA (post-hoc: Bonferroni) with * = (p < 0.05) and ** = (p < 0.01) vs. control for each point in time

Similar articles

Cited by

References

    1. Cancer. https://www.who.int/news-room/fact-sheets/detail/cancer. Accessed 04 Nov 2020.
    1. Mokhtari RB, Homayouni TS, Baluch N, Morgatskaya E, Kumar S, Das B, Yeger H. Combination therapy in combating cancer. Oncotarget. 2017;8(23):38022–38043. doi: 10.18632/oncotarget.16723. - DOI - PMC - PubMed
    1. Evans JMM, Donnelly LA, Emslie-Smith AM, Alessi DR, Morris AD. Metformin and reduced risk of cancer in diabetic patients. Brit Med J. 2005;330(7503):1304–1305. doi: 10.1136/bmj.38415.708634.F7. - DOI - PMC - PubMed
    1. Pecinova A, Brazdova A, Drahota Z, Houstek J, Mracek T. Mitochondrial targets of metformin - are they physiologically relevant? Biofactors. 2019;45(5):703–711. doi: 10.1002/biof.1548. - DOI - PubMed
    1. Meng SM, Cao J, He QY, Xiong LS, Chang E, Radovick S, Wondisford FE, He L. Metformin activates AMP-activated protein kinase by promoting formation of the alpha beta gamma Heterotrimeric complex. J Biol Chem. 2015;290(6):3793–3802. doi: 10.1074/jbc.M114.604421. - DOI - PMC - PubMed

MeSH terms