

Dynamic changes in peripheral blood lymphocyte subset counts and functions in patients with diffuse large B cell lymphoma during chemotherapy
- PMID: 34044841
- PMCID: PMC8162016
- DOI: 10.1186/s12935-021-01978-w
Dynamic changes in peripheral blood lymphocyte subset counts and functions in patients with diffuse large B cell lymphoma during chemotherapy
Abstract
Background: This study aimed to analyze the lymphocyte subsets, their activities and their dynamic changes during immunochemotherapy in patients newly diagnosed with diffuse large B cell lymphoma (DLBCL).
Methods: Patients with DLBCL (n = 33) were included in the present study. Their peripheral lymphocyte subsets, phenotypes and functions were detected using flow cytometry. The dynamic results of lymphocyte activities were available for 18 patients.
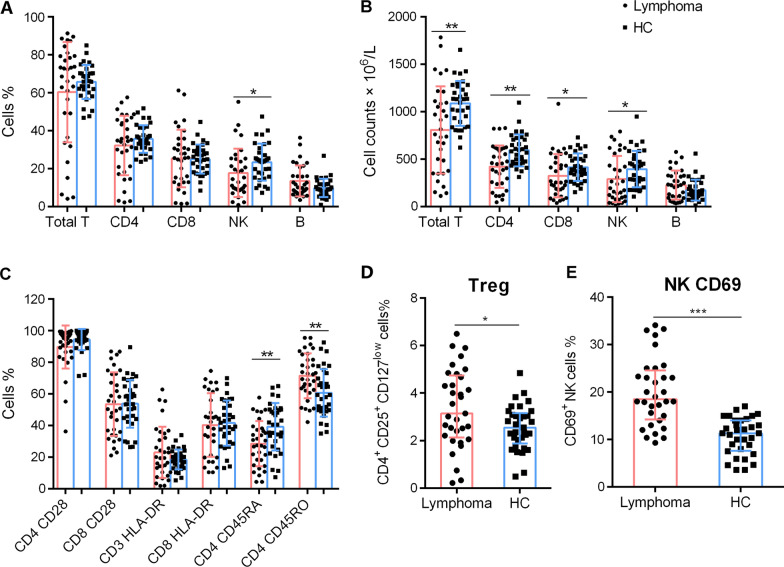
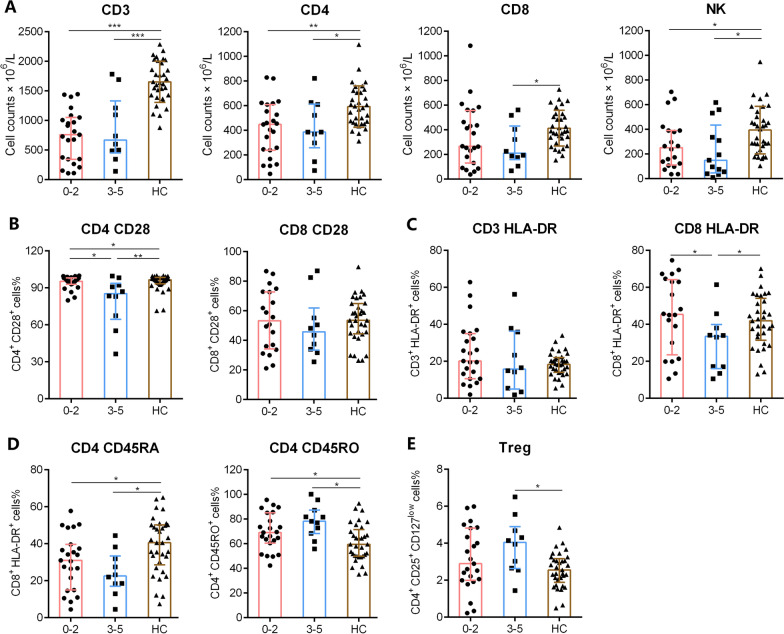
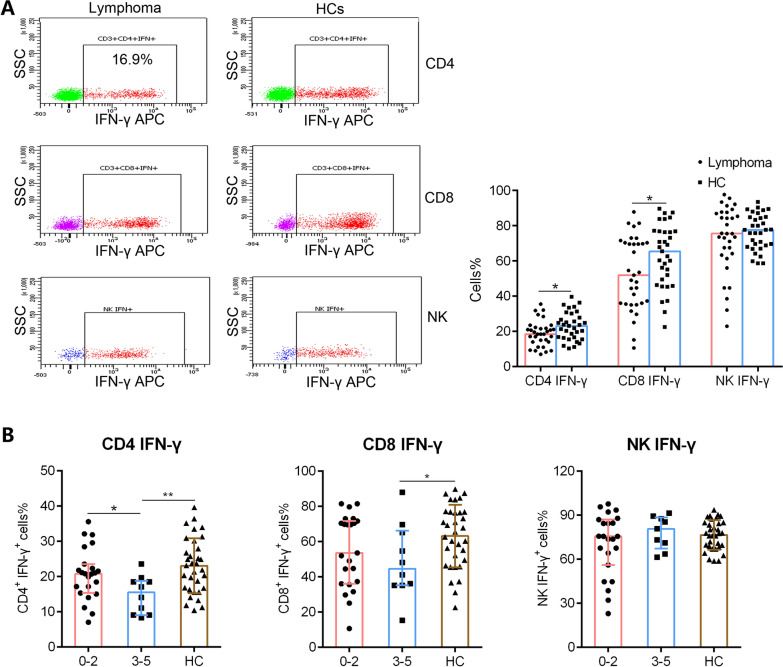
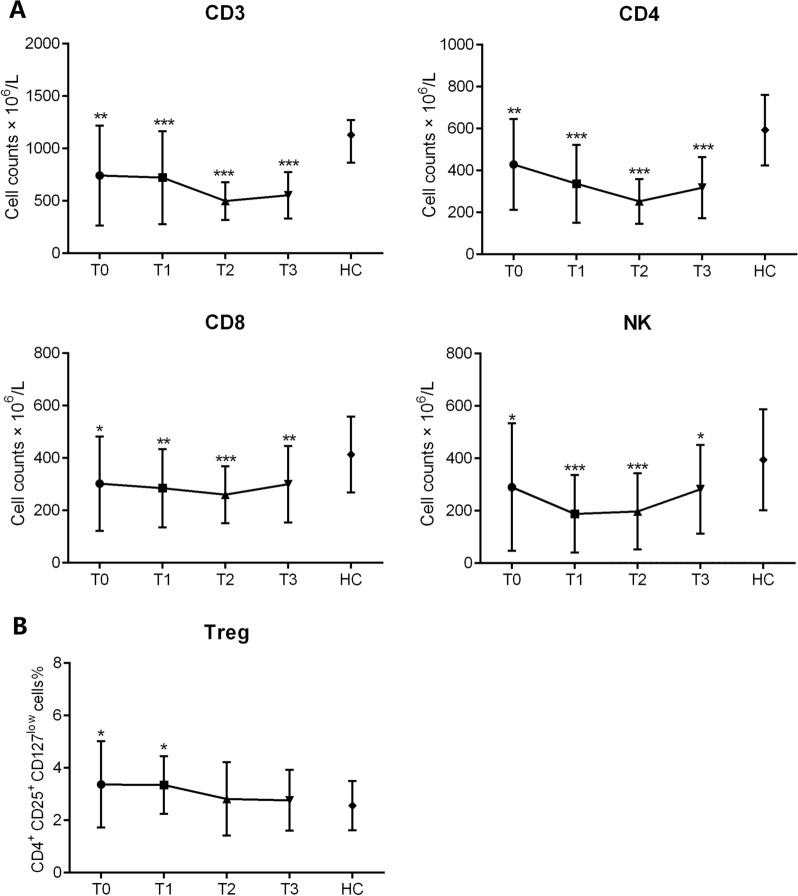
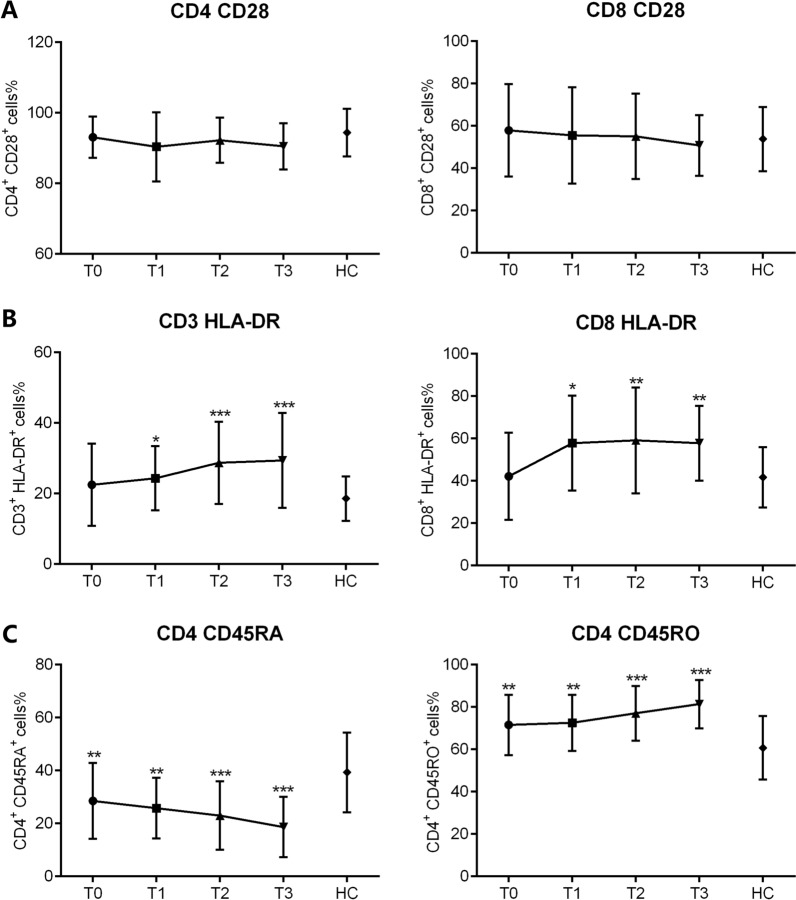
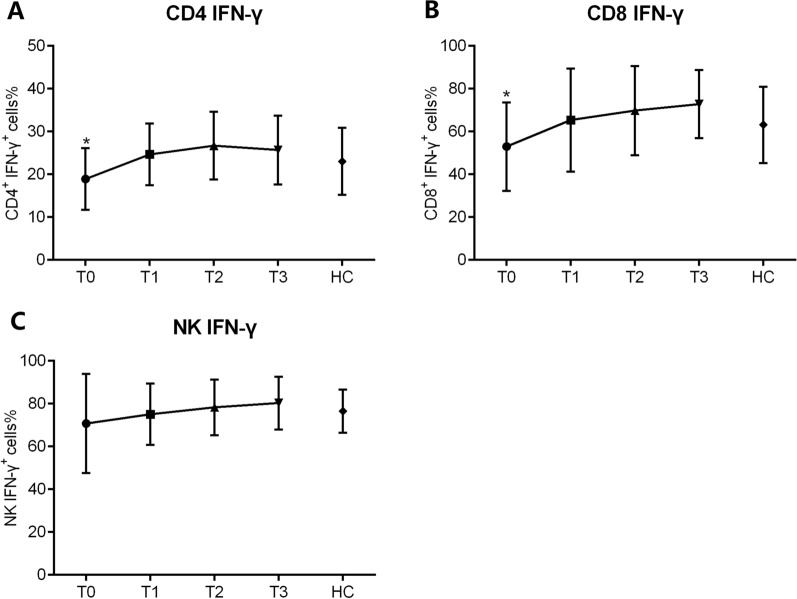
Results: Compared with healthy controls (HCs), the counts of CD3+, CD4+, and CD8+ T cells as well as those NK cells decreased in patients newly diagnosed with DLBCL, mainly attributed to patients with high risk of prognosis assessed by International Prognostic Index (IPI) score. Lymphocyte counts didn't present significant difference between high risk (IPI scores 3-5) and low risk patients (IPI scores 0-2), but CD4+ T cells and CD8+ T cells expressed higher levels of CD28 and HLA-DR, respectively, in patients with IPI score ranging from 3 to 5. Patients at high risk harbored higher percentage of regulatory T cells (Tregs), and their CD4+ and CD8+ T cells produced lower levels of IFN-γ, reflecting an impaired cellular immune response. The dynamic changes of lymphocyte numbers and functions during treatment were further investigated. Total counts of CD3+, CD4+, CD8+ T and NK cells progressively decreased because of the cytotoxicity of chemotherapy and then gradually recovered after six cycles treatment (rituximab combined with cyclophosphamide, doxorubicin, vincristine and prednisone, R-CHOP). The functions of CD4+ and CD8+ T cells recovered by the end of two cycles R-CHOP treatment, although NK cell function was not significantly affected throughout treatment. These results suggest that the counts and functions of lymphocytes are significantly decreased in patients with DLBCL, particularly those of CD4+ and CD8+ T cells.
Conclusions: The absolute counts and functions of CD4+, CD8+ T cells, which were significantly lower in patients with DLBCL, gradually recovered after effective treatment. Therefore, combined detection of T cell counts and functions are critically important for administering effective personalized immunotherapy as well as for identifying new prognostic markers or DLBCL.
Keywords: CD4+ T cells; CD8+ T cells; Diffuse large B cell lymphoma; Lymphocyte subsets; NK cells.
Conflict of interest statement
The authors declare that they have no competing interest.
Figures
Similar articles
-
Prognostic Impact of Peripheral Blood T-Cell Subsets at the Time of Diagnosis on Survival in Patients with Diffuse Large B-Cell Lymphoma.Acta Haematol. 2021;144(4):427-437. doi: 10.1159/000510912. Epub 2020 Dec 3. Acta Haematol. 2021. PMID: 33271543
-
[Expression and Clinical Significance of Cytokines and Lymphocyte Subsets in Patients with Diffuse Large B-Cell Lymphoma].Zhongguo Shi Yan Xue Ye Xue Za Zhi. 2023 Auguest;31(4):1061-1068. doi: 10.19746/j.cnki.issn.1009-2137.2023.04.021. Zhongguo Shi Yan Xue Ye Xue Za Zhi. 2023. PMID: 37551478 Chinese.
-
CD4(+) tumor infiltrating lymphocytes are prognostic and independent of R-IPI in patients with DLBCL receiving R-CHOP chemo-immunotherapy.Am J Hematol. 2013 Apr;88(4):273-6. doi: 10.1002/ajh.23398. Epub 2013 Mar 5. Am J Hematol. 2013. PMID: 23460351
-
[Deep lung--cellular reaction to HIV].Rev Port Pneumol. 2007 Mar-Apr;13(2):175-212. Rev Port Pneumol. 2007. PMID: 17492233 Review. Portuguese.
-
Association of Peripheral Blood Cell Profile With Alzheimer's Disease: A Meta-Analysis.Front Aging Neurosci. 2022 May 6;14:888946. doi: 10.3389/fnagi.2022.888946. eCollection 2022. Front Aging Neurosci. 2022. PMID: 35601620 Free PMC article.
Cited by
-
PD-L1 Is Involved in the Development of Non-Hodgkin's Lymphoma by Mediating Circulating Lymphocyte Apoptosis.Vaccines (Basel). 2023 Sep 11;11(9):1474. doi: 10.3390/vaccines11091474. Vaccines (Basel). 2023. PMID: 37766150 Free PMC article.
-
Prognostic value of lactate dehydrogenase to absolute lymphocyte count ratio and albumin to fibrinogen ratio in diffuse large B-cell lymphoma.Medicine (Baltimore). 2024 Jul 26;103(30):e39097. doi: 10.1097/MD.0000000000039097. Medicine (Baltimore). 2024. PMID: 39058821 Free PMC article.
-
Prediction significance of autophagy-related genes in survival probability and drug resistance in diffuse large B-cell lymphoma.Aging (Albany NY). 2024 Jan 17;16(2):1049-1076. doi: 10.18632/aging.205282. Epub 2024 Jan 17. Aging (Albany NY). 2024. PMID: 38240686 Free PMC article.
-
Response to DA-EPOCH-R is associated with activation of 'fitter' cytotoxic T cells in patients with newly diagnosed double and triple hit high-grade B-cell lymphoma.Haematologica. 2024 Nov 1;109(11):3760-3765. doi: 10.3324/haematol.2024.285170. Haematologica. 2024. PMID: 38961740 Free PMC article. No abstract available.
-
Peripheral immune cell profiling of double-hit lymphoma by mass cytometry.BMC Cancer. 2023 Feb 23;23(1):184. doi: 10.1186/s12885-023-10657-0. BMC Cancer. 2023. PMID: 36823603 Free PMC article.
References
LinkOut - more resources
Full Text Sources
Other Literature Sources
Research Materials
