

EYA2 suppresses the progression of hepatocellular carcinoma via SOCS3-mediated blockade of JAK/STAT signaling
- PMID: 34044846
- PMCID: PMC8157759
- DOI: 10.1186/s12943-021-01377-9
EYA2 suppresses the progression of hepatocellular carcinoma via SOCS3-mediated blockade of JAK/STAT signaling
Abstract
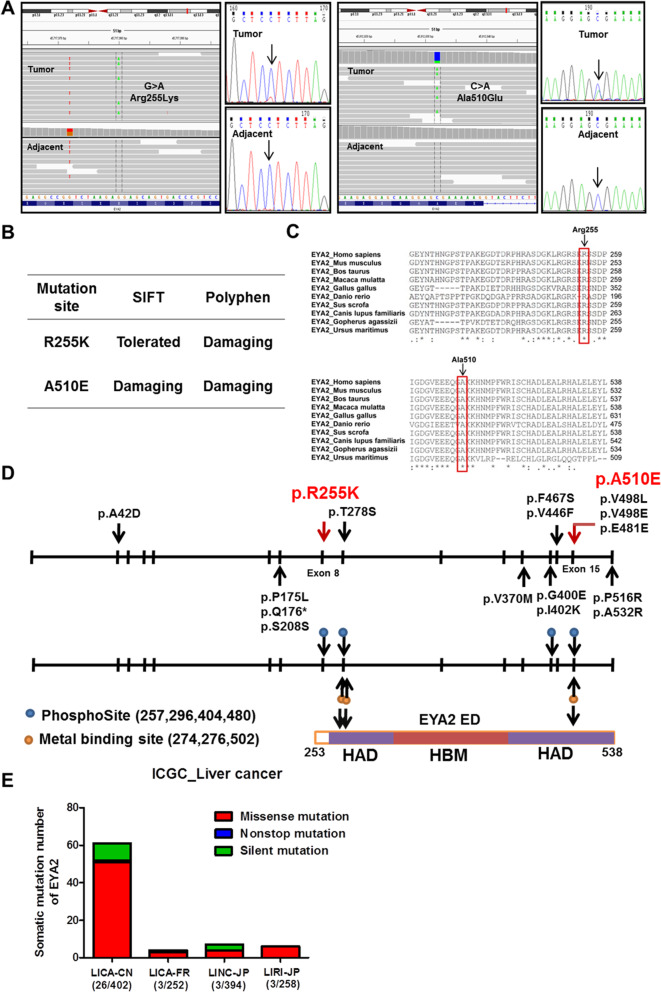
Background: Somatic mutations are involved in hepatocellular carcinoma (HCC) progression, but the genetic mechanism associated to hepatocarcinogenesis remains poorly understood. We report that Eyes absent homolog 2 (EYA2) suppresses the HCC progression, while EYA2(A510E) mutation identified by exome sequencing attenuates the tumor-inhibiting effect of EYA2.
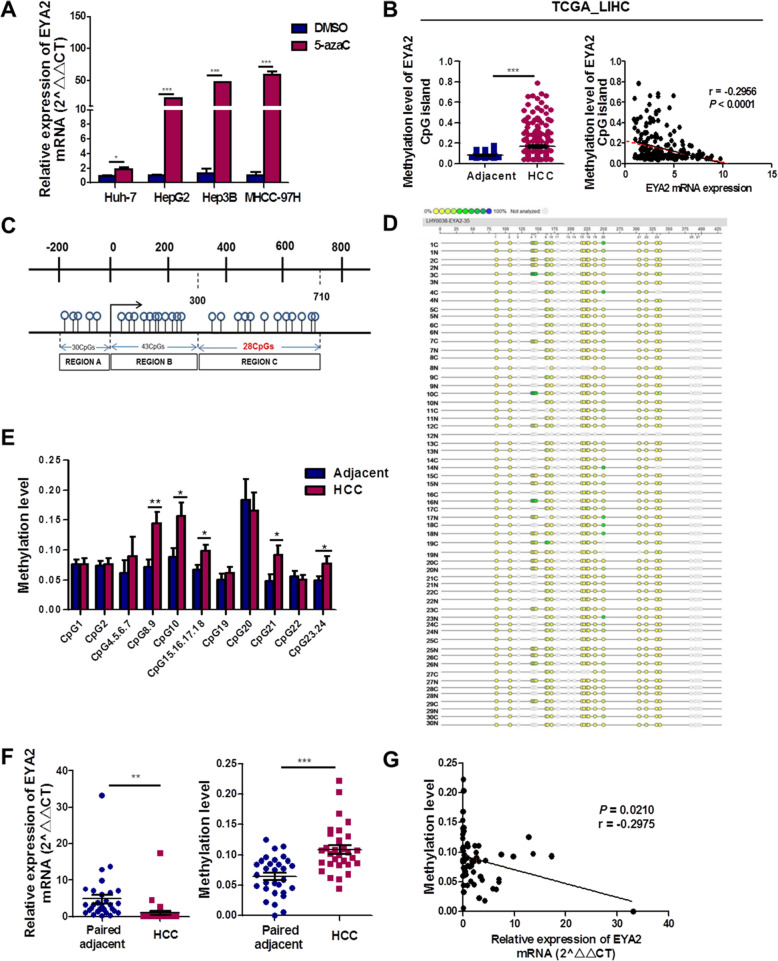
Methods: Whole-exome sequencing was performed on six pairs of human HCC primary tumors and matched adjacent tissues. Focusing on EYA2, expression level of EYA2 in human HCC samples was evaluated by quantitative real-time PCR, western blot and immunohistochemistry. Loss- and gain-of-function studies, hepatocyte-specific deletion of EYA2 (Eya2-/-) in mice and RNA sequencing analysis were used to explore the functional effect and mechanism of EYA2 on HCC cell growth and metastasis. EYA2 methylation status was evaluated using Sequenom MassARRAY and publicly available data analysis.
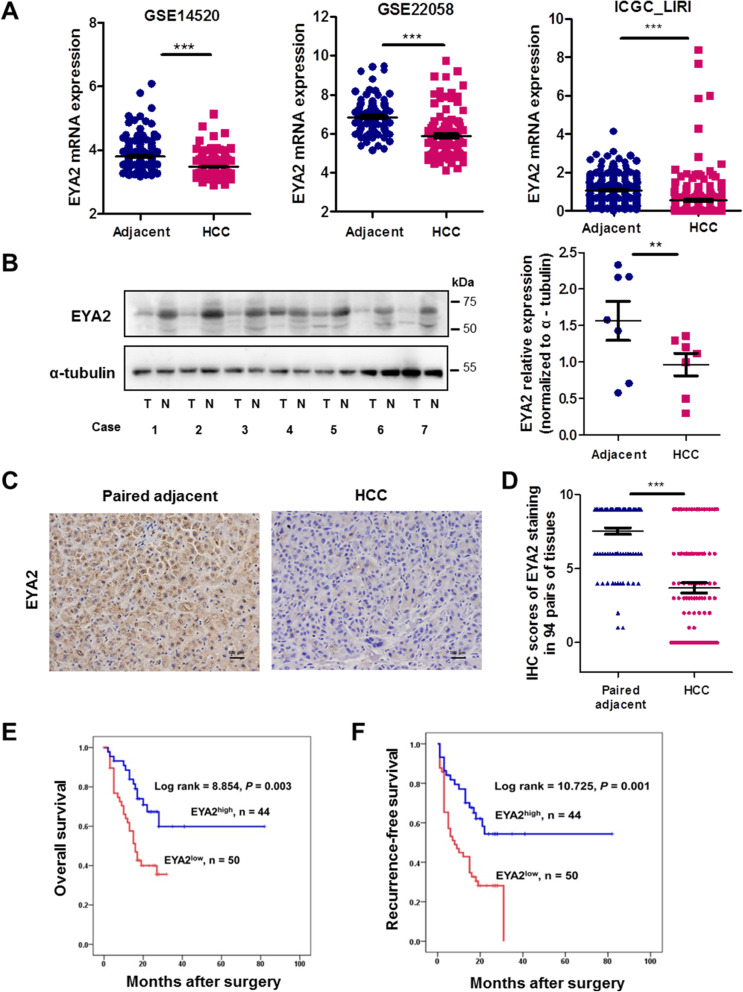
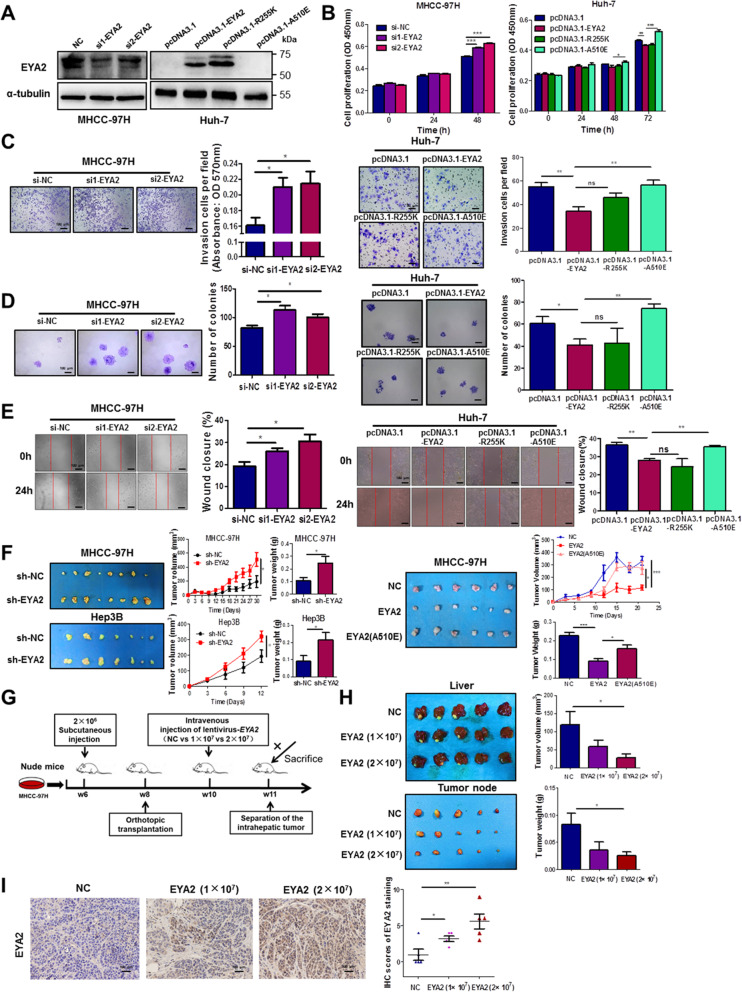
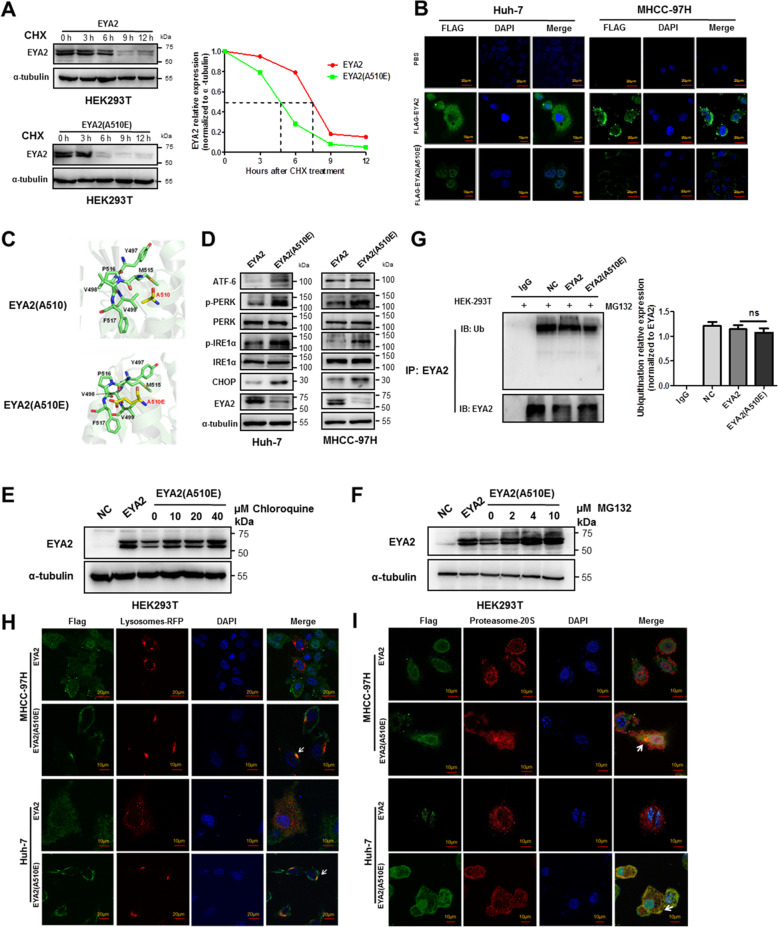
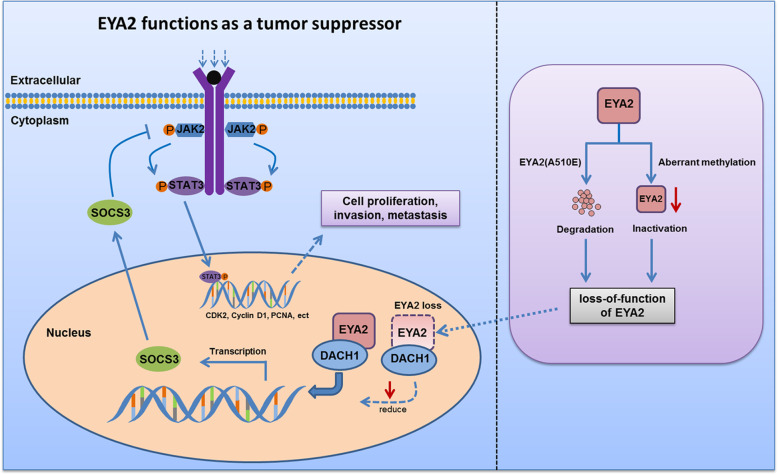
Results: A new somatic mutation p.Ala510Glu of EYA2 was identified in HCC tissues. The expression of EYA2 was down-regulated in HCC and associated with tumor size (P = 0.001), Barcelona Clinic Liver Cancer stage (P = 0.016) and tumor differentiation (P = 0.048). High level of EYA2 was correlated with a favorable prognosis in HCC patients (P = 0.003). Results from loss-of-function and gain-of-function experiments suggested that knockdown of EYA2 enhanced, while overexpression of EYA2 attenuated, the proliferation, clone formation, invasion, and migration of HCC cells in vitro. Delivery of EYA2 gene had a therapeutic effect on inhibition of orthotopic liver tumor in nude mice. However, EYA2(A510E) mutation led to protein degradation by unfolded protein response, thus weakening the inhibitory function of EYA2. Hepatocyte-specific deletion of EYA2 in mice dramatically promoted diethylnitrosamine-induced HCC development. EYA2 was also down-regulated in HCC by aberrant CpG methylation. Mechanically, EYA2 combined with DACH1 to transcriptionally regulate SOCS3 expression, thus suppressing the progression of HCC via SOCS3-mediated blockade of the JAK/STAT signaling pathway.
Conclusions: In our study, we identified and validated EYA2 as a tumor suppressor gene in HCC, providing a new insight into HCC pathogenesis.
Keywords: Eyes absent homolog 2; JAK/STAT signaling pathway; Somatic mutation; Tumor suppressor gene; Unfolded protein response; Whole-exome sequencing.
Conflict of interest statement
The authors declare that they have no competing interests.
Figures

Similar articles
-
Ubiquitous activation of Ras and Jak/Stat pathways in human HCC.Gastroenterology. 2006 Apr;130(4):1117-28. doi: 10.1053/j.gastro.2006.01.006. Gastroenterology. 2006. PMID: 16618406
-
In vivo and in vitro effects of microRNA-221 on hepatocellular carcinoma development and progression through the JAK-STAT3 signaling pathway by targeting SOCS3.J Cell Physiol. 2019 Apr;234(4):3500-3514. doi: 10.1002/jcp.26863. Epub 2018 Oct 28. J Cell Physiol. 2019. Retraction in: J Cell Physiol. 2022 Mar;237(3):2000. doi: 10.1002/jcp.30512. PMID: 30370582 Retracted.
-
MicroRNA-196a/-196b regulate the progression of hepatocellular carcinoma through modulating the JAK/STAT pathway via targeting SOCS2.Cell Death Dis. 2019 Apr 15;10(5):333. doi: 10.1038/s41419-019-1530-4. Cell Death Dis. 2019. PMID: 30988277 Free PMC article.
-
Exploring the JAK/STAT Signaling Pathway in Hepatocellular Carcinoma: Unraveling Signaling Complexity and Therapeutic Implications.Int J Mol Sci. 2023 Sep 6;24(18):13764. doi: 10.3390/ijms241813764. Int J Mol Sci. 2023. PMID: 37762066 Free PMC article. Review.
-
Emerging roles of suppressor of cytokine signaling 3 in human cancers.Biomed Pharmacother. 2021 Dec;144:112262. doi: 10.1016/j.biopha.2021.112262. Epub 2021 Oct 1. Biomed Pharmacother. 2021. PMID: 34607102 Review.
Cited by
-
Expression Characteristics, Immune Signature, and Prognostic Value of the SOCS Family Identified by Multiomics Integrative Analysis in Liver Cancer.Cancer Rep (Hoboken). 2024 Sep;7(9):e2161. doi: 10.1002/cnr2.2161. Cancer Rep (Hoboken). 2024. PMID: 39307915 Free PMC article.
-
Dysregulation of Liver Regeneration by Hepatitis B Virus Infection: Impact on Development of Hepatocellular Carcinoma.Cancers (Basel). 2022 Jul 22;14(15):3566. doi: 10.3390/cancers14153566. Cancers (Basel). 2022. PMID: 35892823 Free PMC article. Review.
-
Pyroptosis-Related LncRNA Signature Predicts Prognosis and Is Associated With Immune Infiltration in Hepatocellular Carcinoma.Front Oncol. 2022 Mar 3;12:794034. doi: 10.3389/fonc.2022.794034. eCollection 2022. Front Oncol. 2022. PMID: 35311105 Free PMC article.
-
Evolving cognition of the JAK-STAT signaling pathway: autoimmune disorders and cancer.Signal Transduct Target Ther. 2023 May 19;8(1):204. doi: 10.1038/s41392-023-01468-7. Signal Transduct Target Ther. 2023. PMID: 37208335 Free PMC article. Review.
-
Identification and validation of SOCS1/2/3/4 as potential prognostic biomarkers and correlate with immune infiltration in glioblastoma.J Cell Mol Med. 2023 Aug;27(15):2194-2214. doi: 10.1111/jcmm.17807. Epub 2023 Jun 14. J Cell Mol Med. 2023. PMID: 37315184 Free PMC article.
References
-
- Ding X, He M, Chan AWH, Song QX, Sze SC, Chen H, et al. Genomic and Epigenomic features of primary and recurrent hepatocellular carcinomas. Gastroenterology. 2020;S0016-5085(20):30659–30664. - PubMed
Publication types
MeSH terms
Substances
LinkOut - more resources
Full Text Sources
Other Literature Sources
Medical
Molecular Biology Databases
